
Survey at a Glance:
The From Discovery to Purchase: Key Digital & Physical Influences on the Customer Journey report is based on a survey of 12,866 US consumers fielded in August 2022. Here’s a preview of our key findings.
- The top five places consumers conduct pre-purchase research are Google or an equivalent search engine (89%), Amazon (88%), brand websites (56%), Walmart.com (55%), and other retailer websites (54%).
- 62% of shoppers say a paid advertisement doesn’t decrease the likelihood they’ll click on something; 9% said it increases their likelihood of doing so.
- Certain factors increase marketing email clickthrough, including price discounts or promotions (85%), products that pique the shopper’s interest (49%) and positive ratings and reviews (46%). The same three factors increase clickthrough of social media posts or ads.
- 99% use website search bars at least sometimes.
- 96% use category dropdowns at least sometimes.
- The top three factors website visitors consider when determining which products to explore further are price (87%), ratings and reviews (82%), and listed discounts (63%).
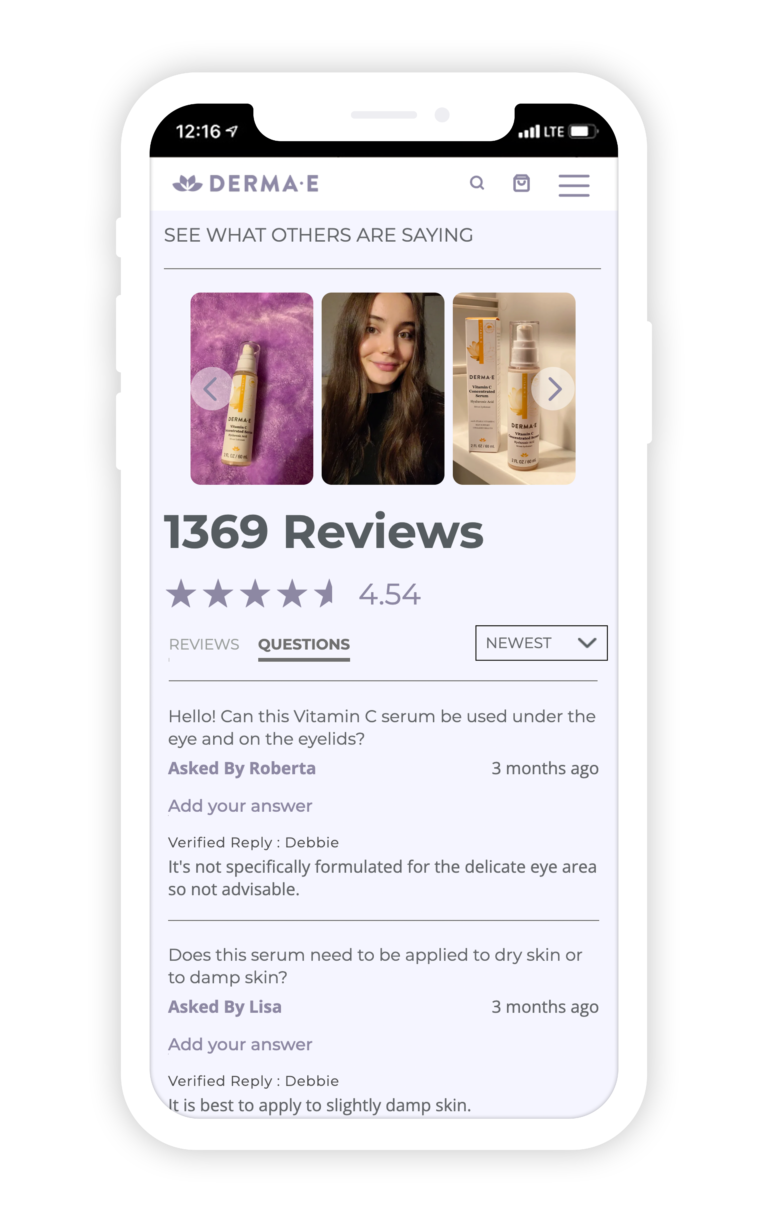
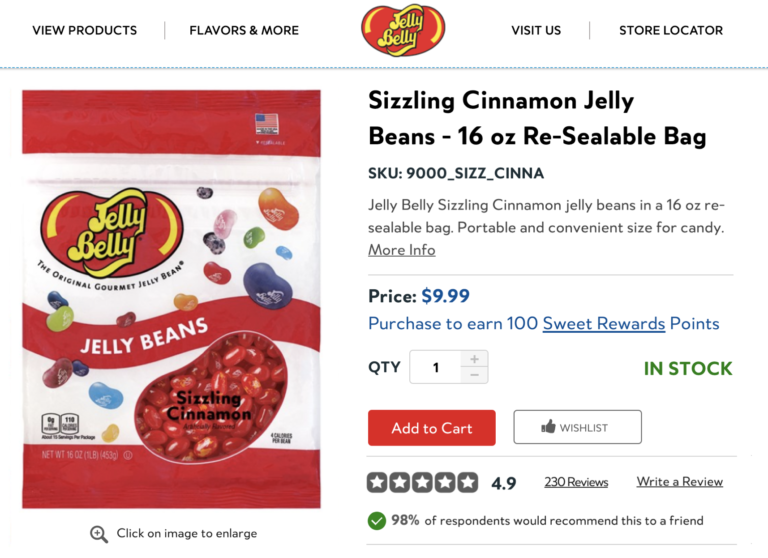
- 92% of shoppers consider ratings and reviews when viewing product pages.
- Other top considerations include price (88%), written descriptions from the brand/retailer (68%), questions provided by previous customers (65%), and shipping information (62%).
- Top sites where consumers have converted in the last six months include Amazon (97%), retailer websites (74%), Walmart.com (71%), and brand websites (56%).
- 99% of shoppers research purchases online before going to a store at least sometimes.
- 92% research purchases online while shopping in a brick-and-mortar store.
- In-store shoppers consider many factors when researching products online, including price (90%), ratings and reviews (84%), product information provided by the brand (61%), and in-store availability (60%) – among others.
Introduction
In the past few years, retail has undergone a dramatic shift. For starters, more spending has shifted online – a trend that accelerated at the start of the pandemic yet shows no signs of slowing down. In fact, Statista forecasts that by 2025, ecommerce will account for nearly a quarter of total global retail sales.
And while in-store shopping continues to thrive, we’re seeing some big changes there, too. Services such as buy online pickup in-store (BOPIS) after a slow start are becoming more commonplace – which are blurring the lines between ecommerce and in-person shopping and transforming the role of the store. And in-store shoppers are doing plenty of online research – both before and while they’re in physical stores.
Regardless of whether a consumer is browsing online, in-store, or some combination of the two, their journey is rarely as linear as the marketing textbooks would have you think. Instead, it’s full of twists and turns – and oftentimes, multiple channels. According to a report from Salesforce, over three-quarters of customers have used multiple channels to start and complete a transaction.
For brands and retailers, this is a logistical nightmare. How do shoppers find out about and research your products? And consequently: where should you invest resources on customer acquisition in a world where you can’t possibly accurately size the impact of each and every part of your marketing strategy?
Now, more than ever, brands and retailers must focus on delivering seamless shopping experiences across channels that meet the expectations of modern consumers. The first step is to better understand what their habits and expectations are.
Recently, we surveyed nearly 13,000 consumers in the US to understand how they’re navigating the purchase journey. In this report, we’ll explore how shoppers discover, research, browse, and compare products – whether they purchase online or in a brick-and-mortar store.
Who We Surveyed
This report is based on an analysis of a survey of 12,866 consumers in the US from August 2022. Here’s a closer look at who we surveyed.
Generations
(1997-present)

(1981-1996)

(1965-1980)

(1946-1964)

Household Income
Shopping Frequency & Spending Across Channels
Before we examine how shoppers are navigating the shopping journey, let’s first take a step back to see how frequently they’re shopping across channels and how much they’re spending.
Consumers Shop Frequently
The most common shopping frequency for both online and in-store shoppers is 2-3 times per week. Notably, consumers are more likely to shop online daily than they are to do so in-store.
In addition, shopping frequency varies by age – but only slightly. For example, younger consumers shop online slightly more often than their older counterparts.
Monthly Spend Across Channels Varies
The largest portion of online shoppers (30%) spend between $101 and $250 per month, while the largest portion of in-store shoppers (32%) spend between $251 and $500. It seems consumers are shopping online more frequently – but the transactions are smaller. On the other hand, consumers tend to shop in-store less frequently – but spend more when they do.
As expected, monthly spending is correlated with household income. Those with higher incomes tend to spend more each month.
How Consumers Discover, Browse, and Buy Online
Ecommerce is growing – and will continue to do so. Let’s take a closer look at how consumers discover, browse, and ultimately, purchase products online.
Researching and Discovering Products Online
Where Online Shoppers Conduct Product Research
Online shoppers do plenty of research before making a purchase – and they have endless information at their fingertips. Here’s a look at where shoppers are doing their product research. Perhaps not surprisingly, Google (or another search engine) tops the list – with Amazon coming in at a close second. While answers vary slightly by generation, Google and Amazon are the top for each.
The Role of Marketing Initiatives in Product Discovery
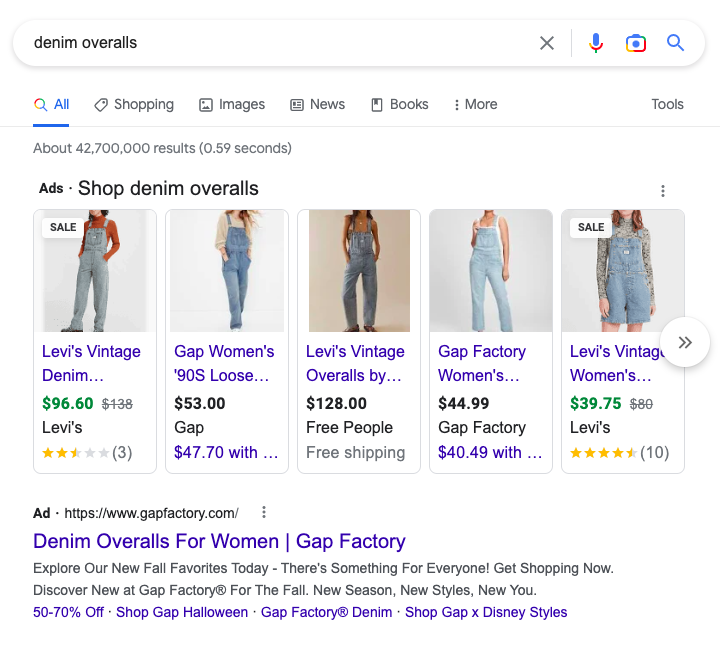
Oftentimes, consumers stumble upon products being promoted by paid advertising – whether or not they’re actively shopping. Maybe it’s a search ad that displays alongside Google search results. Or perhaps a display ad on a favorite website. 62% of consumers indicate a paid advertisement doesn’t decrease the likelihood they’ll click on something – and 9% indicate it’ll actually increase their likelihood of doing so.
Of note, Gen Z’ers are the generation most likely to indicate a paid promotion will increase their likelihood of clicking through, whereas Millennials are the group most likely to say such a promotion will decrease their likelihood of clickthrough.
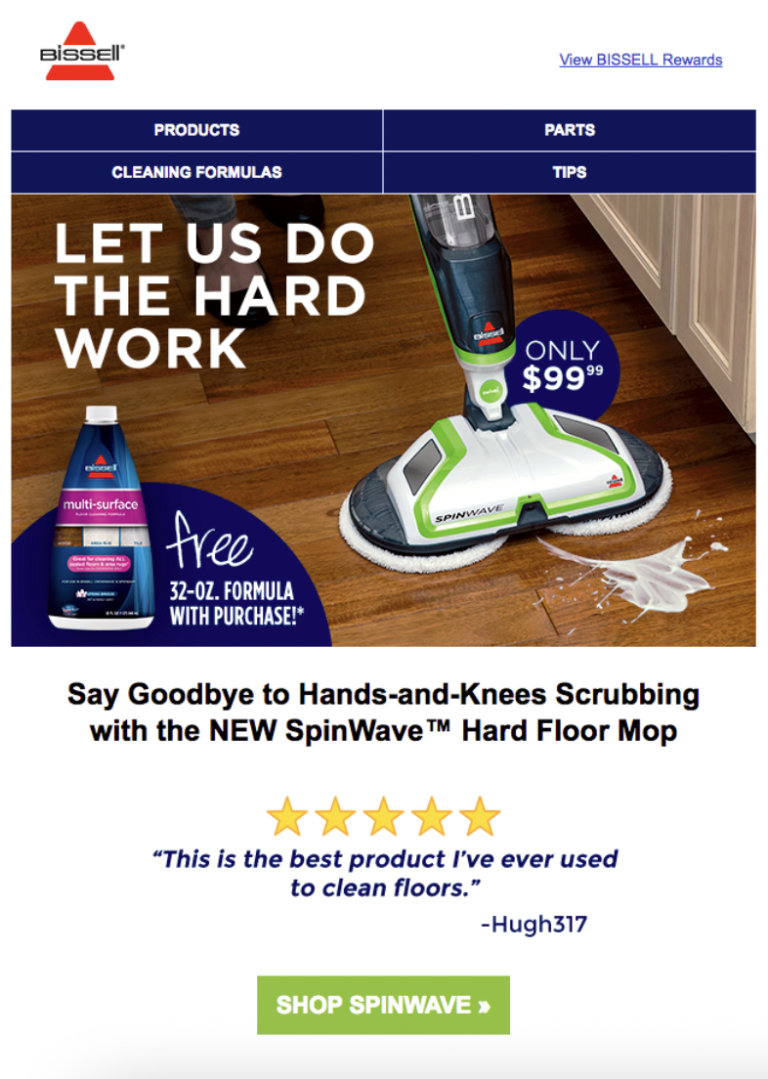
Email is another common marketing tactic used by brands and retailers. Our survey found that there are many components of marketing emails that increase the likelihood of clickthrough. Chief among them? The presence of a price discount or sales promotion.

Price discounts or sales promotions are also the component of brand or retailer social media posts or ads that are most likely to increase clickthrough. However, there are many other features – including positive ratings and reviews – that shoppers say will increase their likelihood of clicking through.

Exploring ECommerce Sites
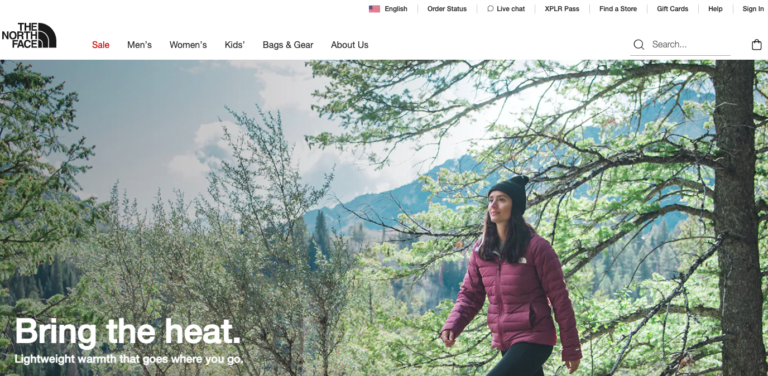
A shopper lands on an ecommerce site, either organically or as the result of a marketing initiative. Here’s a look at how they navigate the site – and the criteria they use to determine which products to explore further.
Website Visitors Rely on Certain Site Features
The vast majority (99%) of consumers use the search bar of websites to find a product at least sometimes. Notably, Gen Z shoppers are the group most likely to indicate they always type searches into the search bar of websites.
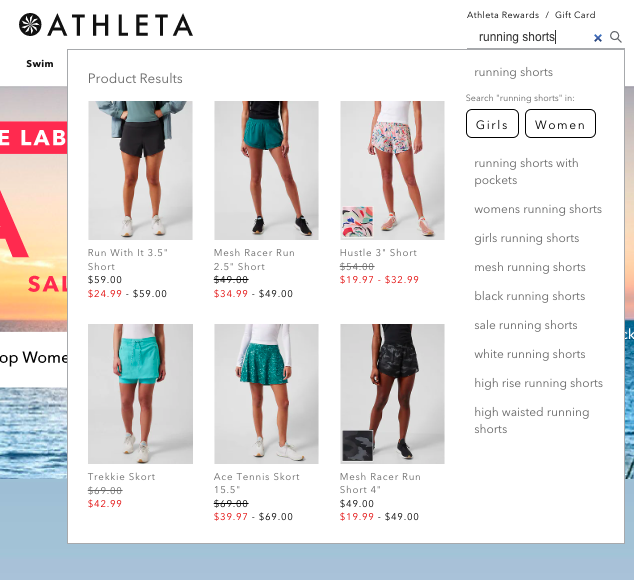
Most shoppers – 96% – also use category dropdowns as a way to navigate websites. Gen Z’ers are particularly frequent users of website dropdowns.
Website Visitors Consider Many Factors
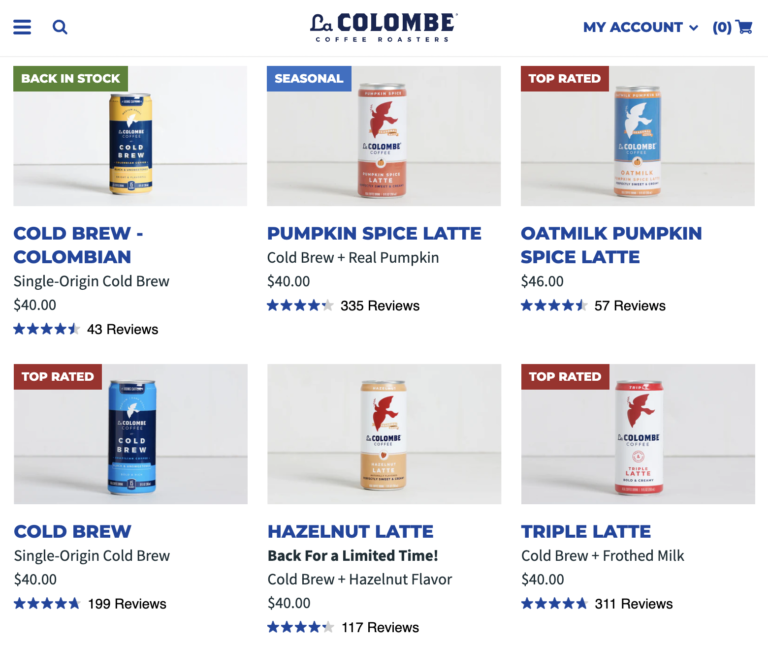
After landing on a website, shoppers weigh myriad factors to determine which products to explore further. Price (87%) and ratings and reviews (82%) top the list. Brands and retailers must ensure this information is easy to find not only on product pages – but also category pages and even the homepage.
Navigating Product Pages and Making Purchase Decisions
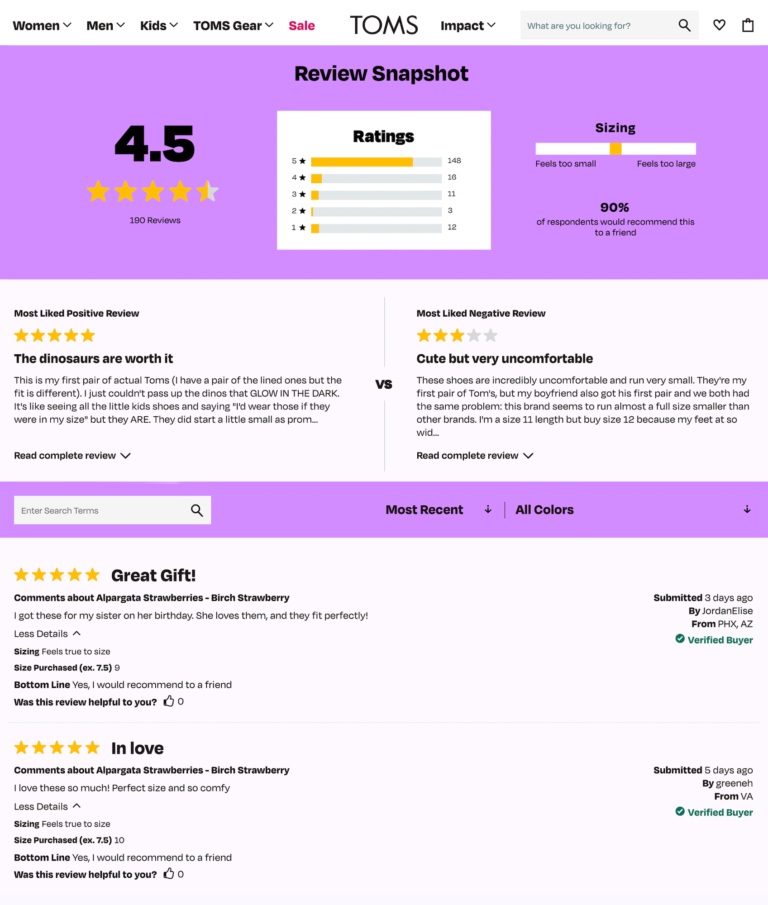
After landing on a product page, shoppers consider many factors to determine whether or not to make a purchase. Ratings and reviews top the list, with 92% of consumers indicating this is something they consider. In fact, ratings and reviews surpasses even the price of the product in terms of importance.
Where Online Shoppers Convert
Earlier in this report, we explored where consumers start the online purchase journey. But where are they ultimately making a purchase? The majority – 97% – have made a purchase from Amazon in the last six months. However, a large portion of online shoppers have also made purchases on retailer and brand websites.
How & Where In-Store Shoppers Conduct Pre-Purchase Research
Sure, ecommerce is growing. However, the majority of retail purchases still happen in a brick-and-mortar store. In many cases, these in-store shoppers are doing plenty of research before making an in-store purchase.
99% of those we surveyed research products online before setting foot in a store. Gen Z shoppers are particularly frequent pre-purchase researchers.
In addition, a large portion of consumers – 92% – pull out their phones to do research while shopping in a physical store location. Though shoppers of all generations do this, younger consumers tend to do it more frequently.
In-store shoppers consider many factors when researching in-store purchases online. However, price and ratings and reviews are the two that top the list.
5 Key Takeaways for Winning Brands & Retailers
Ecommerce is growing, but brick-and-mortar continues to thrive. Brands and retailers must focus on delivering great experiences throughout the purchase journey, whether it’s online, in-store, or some combination of the two.
Read on to explore the five key takeaways from our latest survey.
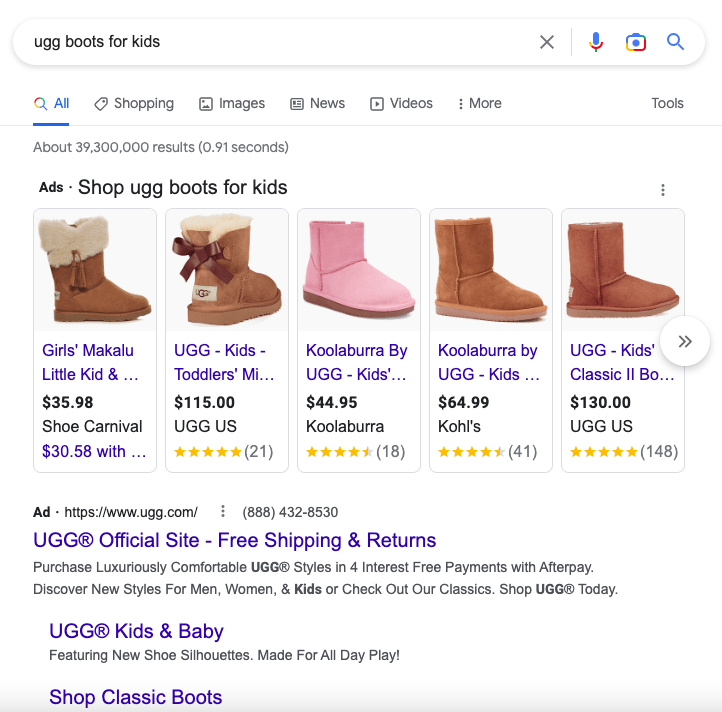
Nearly nine in ten (89%) of consumers turn to Google or another search engine when researching products online, and 88% use Amazon to conduct pre-purchase research. Brands and retailers must have a solid SEO strategy in place to ensure their product pages appear high in search results. Collecting and displaying a steady stream of reviews can have a positive impact on search rank, so be sure to make that a priority. In addition, consider displaying star ratings in your paid search ads as a way to entice more shoppers to learn more.
Digital marketing – such as email and social media – are effective ways to get more visitors to your product pages. Consider infusing your campaigns with promotions, as well as ratings and reviews content. Many consumers indicate the presence of these components increases their likelihood of clicking through.
Once a consumer lands on your website, it’s essential to provide them with the tools and information they need to find the products that best fit their needs. 99% of consumers use the search bar on websites, and 96% use category drop downs. So be sure to incorporate these features into your website.
In addition, 82% of shoppers rely on ratings and reviews prior to landing on a product page to determine which products to explore further. So look for opportunities to add star ratings and reviews content to other parts of your website, including category pages and even your homepage.
Once a shopper lands on a product page, the presence of ratings and reviews is THE most important factor impacting purchase decisions. In fact, the importance of ratings and reviews surpasses price.
Make it a top priority to collect reviews across your entire product catalog. Then, prominently display this content on your product pages. Be sure to include features in your review display that make it easy for shoppers to sort, filter, and search for the content that’s most relevant to them – regardless of what device they’re using to browse and buy.
99% of shoppers do online research at least sometimes before shopping in a brick-and-mortar store. And 92% research a product while in the store.
In-store shoppers consider many factors when conducting online product research. Price and ratings and reviews top the list. Be sure your online shoppers can easily access this information when browsing your website or mobile app via their mobile device.