Deep Dive

Beauty Shoppers’ Dependence on User-Generated Content

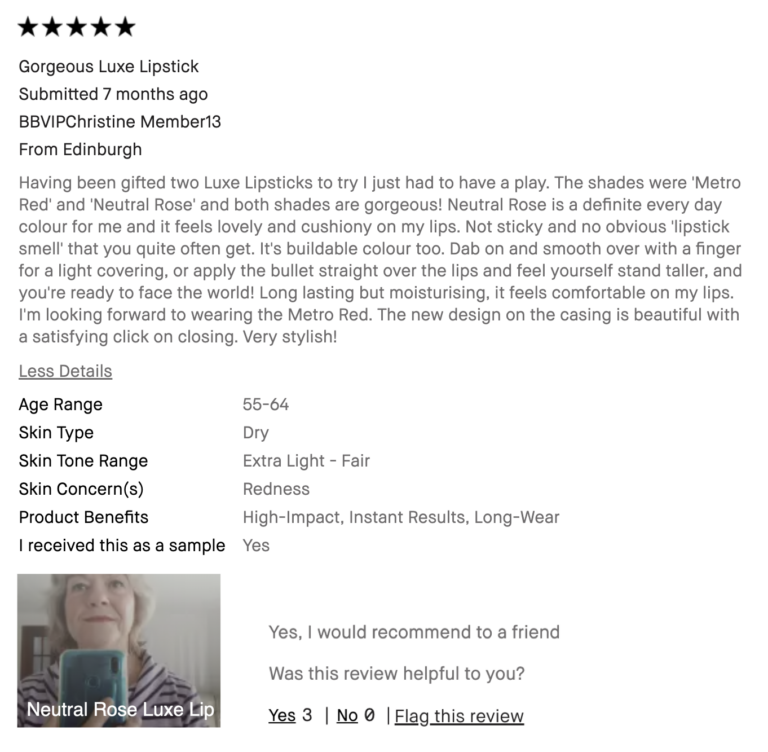
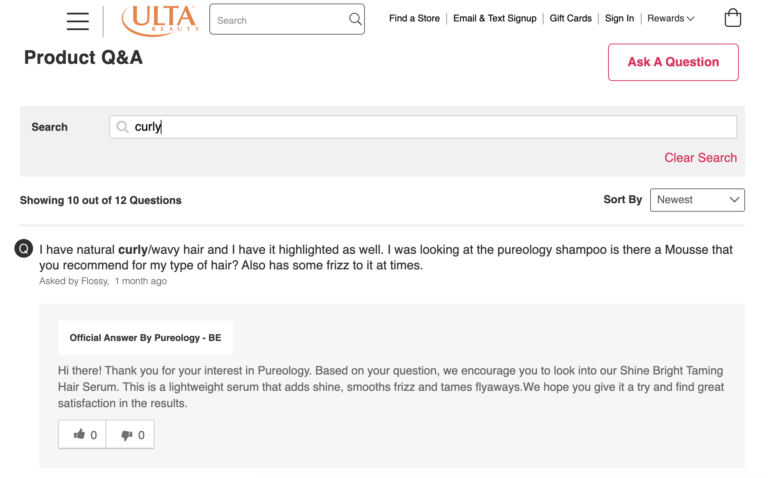
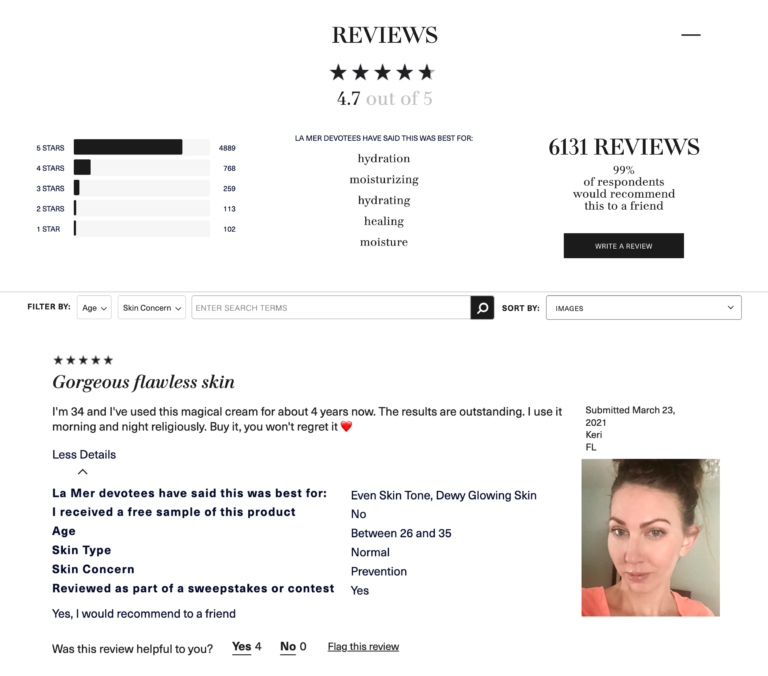
User-generated content is the top consideration for beauty shoppers. In fact, ratings, reviews, and user-generated imagery are more impactful than any other factor – including traditional word of mouth. We explore some of the other key factors impacting beauty purchase decisions here. 

Now, let’s take a closer look at how beauty shoppers consume UGC and what they want from this content.

UGC Elements Most Valued by Beauty Shoppers

There are many components of user-generated content – from average star rating and volume – to recency and written commentary. Which elements do beauty shoppers pay attention to?

The average star rating is the most important element; 77% of beauty shoppers pay attention to this information when considering whether to buy a beauty item. Beauty shoppers also pay attention to review volume (75%), written commentary (74%), and recency (60%). 

Most Valuable Elements of UGC, According to Beauty Shoppers
When considering whether to buy a beauty item, which of the following do you pay attention to?
Average star rating
2023
77%
2022
75%
Volume of reviews
2023
75%
2022
68%
Customer opinion on specific product details (color of product, durability)
2023
74%
2022
75%
Recency of reviews (newer reviews feel more credible)
2023
60%
2022
54%
Customer-submitted imagery
2023
56%
Customer-answered questions
2023
51%
Customer-submitted videos
2023
38%

Review Consumption Habits Online and In-Store

This year, nearly all (99.5%) of beauty shoppers read reviews at least sometimes when shopping online; 63% do so always. 

A large portion – 92% – read reviews at least sometimes when shopping for beauty products in a brick-and-mortar store. This is up significantly from 85% in 2022. 

Frequency at Which Beauty Shoppers Consult Reviews (Online)
2023
2022
Frequency at Which Beauty Shoppers Consult Reviews (In-Store)
2023
2022

How do beauty shoppers prefer to access ratings and reviews when shopping in physical store locations? Most want to access this content via the brand or retailer site on their phone (66%) or via the mobile app (48%). 

How In-Store Beauty Shoppers Prefer to Access Ratings and Reviews
On the brand or retailer website on my phone
66%
Through the app
48%
On in-store displays
35%
Phone notifications when entering the store
13%

Q&A Consumption Habits

One of the benefits of in-store shopping is that consumers can ask questions and get advice from in-store associates. When shopping online, many turn to the questions and answers (Q&A) portion of the product page.

This year, 98% of consumers consult Q&A at least sometimes when shopping for beauty products online. Over a third (37%) always do so. 

Frequency at Which Online Beauty Shoppers Consult Q&A
2023
2022

User-Generated Visual Content Consumption Habits

A beauty product that works well for one person may not work for another. For example, a haircare product that’s a great fit for a consumer with curly hair won’t meet the needs of another consumer with straight hair. 

Seeing photos from other consumers with similar characteristics can help a shopper determine which products will (and won’t) meet their needs. 

This year, 97% of consumers seek out photos and videos from other consumers at least sometimes when shopping online for beauty products. Over a third (37%) do so always. 

Frequency at Which Online Beauty Shoppers Seek Out Photos and Videos from Fellow Consumers
2023
2022

Information Beauty Shoppers Want from UGC

It’s clear beauty shoppers are turning to user-generated content. Here’s a snapshot of the types of information they’re looking for when they consume UGC.

Information Beauty Shoppers Seek when Consuming Feedback from Other Shoppers
When seeking out information provided by other shoppers (i.e. through reviews, images, videos etc), which of the following do you pay attention to?
Consistency/quality of the product
82%
Skin type and effect on skin
77%
What the product looks like on a person in real life
76%
How long the product lasted (a few hours vs. all day)
73%
Skin tone (and whether the shade worked for them)
73%
Scent
36%
Other products that complement it
29%
Key Takeaway 1

Ratings and Reviews are a Must-Have for Beauty Shoppers

Today, the vast majority of beauty shoppers consult reviews – whether they’re shopping online or in a brick-and-mortar store. And when they read those reviews, they consider many factors, including star rating, written commentary, volume and recency.

It’s critical to generate a steady stream of reviews for all of your products. That way, consumers can always find a high volume of fresh reviews for any product they’re considering.

And remember – while the average star rating is certainly important, 74% of consumers say they pay attention to the reviewer’s opinion on specific details relevant to the product. So, consider making the written commentary field of your write-a-review form mandatory.

Key Takeaway 2

Q&A is Key to Removing Purchase Barriers

In-store beauty shoppers have the opportunity to ask a sales associate their questions. Online shoppers don’t have that luxury. Instead, many are turning to the Q&A portion of the product page to browse questions that have already been asked – and submit their own.

If you haven’t already, now’s the time to add a Q&A section to your product pages. Make it easy for shoppers to search through existing content. And, be sure you provide timely responses to any questions submitted through Q&A.

Key Takeaway 3

Beauty Shoppers Depend on User-Generated Visual Content to Identify the Right Products for their Needs

Today, nearly all (97%) of beauty shoppers seek out user-generated visual content at least sometimes. Many do so far more often.

Being able to see how different products look on different people can help shoppers identify the right products for their needs. 

If you’re not already, start collecting photos and videos as part of reviews – and curate this content from social media. Then, showcase these photos and videos in a visual gallery on your product pages. It’s a sure way to boost confidence – and conversion. A recent analysis found there was a 103.9% lift in conversion among site visitors who interacted with user-generated photos and videos.