A complete breakdown of how interacting with UGC impacts conversion rates, based on an analysis of 1.5MM online product pages from over 1,200 brand and retailer sites during the entire year of 2022.

Power Points:

How User-Generated Content Impacts Conversion: 2023 Edition is based on an analysis of 1.5MM online product pages from over 1,200 brand and retailer sites throughout 2022. For reference, we conducted the same analysis in 2021 and 2020.

Here’s an overview of our key findings.

The Presence of UGC Impacts Conversion – But Interaction is Where the Magic Happens
  • In 2022, there was a 3.8% lift in conversion among site visitors who were served up some form of UGC.

  • Visitors who interact with UGC in some way convert at a rate that’s 102.4% higher than average. This is up slightly from a conversion lift of 100.6% in 2021.
Ratings and Reviews Continue to Double Conversion Rates
  • There was a 108.6% lift in conversion among shoppers who interact with ratings and reviews. 

  • Some of the review features that drive the largest conversion lifts include Helpful Yes votes (356.3%), Helpful No votes (271.9%) and Review Search (271.9%). You can find real-life examples of these features and others later on in this report.

  • The most common way for shoppers to apply star rating filters is on one-star review content. 61.3% of star rating filter interactors do so.

  • There’s a 71.9% lift in conversion among those who click to only see one-star reviews, which is proof positive that negative reviews don’t necessarily scare shoppers away. 
Q&A Reigns as the Type of UGC with the Most Powerful Impact on Conversion
  • There was a staggering 177.2% lift in conversion among consumers who interacted with Q&A on the product page. 

  • Certain Q&A features have a particularly large impact on conversion rates, including Show More Answers (178.1%), Click Read Answers (178.1%), and Answer Helpful 165.6%. We’ll share real-world examples of each of these features (and others) in the Q&A portion of this report. 
The Impact of User-Generated Visual Content on Conversion Holds Steady
  • In 2022, there was a 103.9% lift in conversion among visitors who interacted with user-generated photos and videos. 

  • Certain interactions are especially impactful on conversion rates, including clicking to expand the image gallery (103.1%), clicking to view the next image/video (106.3%), and clicking to see the previous image/video (93.8%).
Ongoing Measurement and Optimization is Key to Maximizing Conversion
  • When looking to develop a winning UGC display, best practices are a good place to start. However, there’s no “one size fits all” UGC display. What works for one business may fall flat for another.

  • The key is to analyze your UGC performance on a regular basis. Then, leverage those insights to fuel optimizations that increase conversion impact. 
Chapter 1

Introduction

Consumers Depend on User-Generated Content

Modern consumers weigh any number of considerations when making a purchase decision. But increasingly, they’re seeking out user-generated content to guide them during the purchase journey. 

If you’re not convinced, consider the following facts:

of online shoppers read reviews regularly or always.
0 %
of in-store shoppers read reviews.
0 %
of consumers always or regularly read Q&A.
0 %
of shoppers always or regularly seek out photos and videos from other consumers before making a purchase.
0 %

But How Does UGC Actually Impact Visitor Conversion?

Meeting shoppers’ expectations is reason enough to make user-generated content a priority. After all, if you don’t give shoppers (even the so-called loyal ones) what they want, they won’t hesitate to look elsewhere. Salesforce research tells us 71% of consumers have switched brands at least once in the last year. 

But before doubling down on UGC, brands and retailers want to understand the expected return. This is understandable. In the best of times, it’s important to allocate resources where you’ll see the biggest return. This is even more true in times of economic uncertainty. 

Typically, conversion is the metric brands and retailers focus on most. So, what exactly is the conversion impact of user-generated content?

For this year’s edition of our annual conversion report, we analyzed activity on more than 1,200 brand and retailer sites during 2022 to understand how three key types of UGC impact conversion:

  • Ratings and reviews
  • Q&A
  • Visual content

Beyond looking at the overall impact of each type of UGC, we also drilled down further to understand the impact of key features of each type of UGC. 

Measure, Optimize, Repeat

Understanding how user-generated content (and the specific features of UGC) impact conversion is certainly important. But it’s not the end all be all.

There’s no one-size-fits all review display that’ll deliver maximum ROI for all brands and retailers. Each business is different. And it’s important to determine what works best for yours. 

Use the insights in this report to identify new features and functionality that are worth exploring. Then, measure the performance of your UGC regularly. And use those insights to drive further optimizations that generate the highest impact on conversion rates.

Methodology and Definitions

The following report is based on an analysis of activity on 1.5MM online product pages from over 1,200 brand and retailer sites during 2022. Here is list of key terminology to refer to when reading the report:

Time period for analysis
This data was pulled for the period from January 1, 2022 to December 31, 2022.
Websites analyzed
Activity on more than 1.5 million product detail pages across 1,200 ecommerce websites. These websites encompass myriad ecommerce categories.
Visitor conversion
The visitor conversion metric, used as the baseline for this report, is calculated based on conversions from individual visitors within a 24 hour period. A new visitor session starts every 24 hours, with all accompanying downstream implications on the conversion metric.
Ecommerce UGC page visitor overall
Calculated for any consumer visiting a product detail page that runs PowerReviews UGC display analytics technology.
UGC impression
Calculated based on unique visitors who have scrolled a product page enough to be served an impression of at least one type of user-generated content (review, Q&A, or imagery). The review snippet (the UGC element used at the top of PDPs to display a summary of the average star rating, number of reviews, etc.) is excluded from the UGC impression metric. Throughout this report, we use this metric to more closely examine the different types of UGC – specifically reviews, Q&A, videos and photos.
UGC interaction
A metric calculated based on visitors who interact with UGC. Some examples of UGC interactions include clicking “read more” on a review, opening a user-submitted photo, or using the search box to run a search within review content.
Chapter 2

How UGC Impacts Visitor Conversion

The Simple Act of Displaying UGC on Product Pages Positively Impacts Conversion

When looking at activity during the entire year of 2022, there was a 3.2% conversion rate on the 1,200 sites we analyzed running PowerReviews’ UGC technology. This figure may be a bit higher than other benchmarks from other sources. There are a couple reasons for this.

  1. We base conversion on visitors rather than sessions. Reference the section above for additional information on our methodology. 

  2. Assuming the product detail page is built this way (which most are), all shoppers in the sample we analyzed are served up some form of UGC above the fold. In most cases, this is a UGC summary that includes the product’s average star rating, review count and review distribution. Again, see the methodology section above for more information on what we classify as a UGC impression or UGC interaction. 

Once a site visitor scrolls to a point where they see some form of UGC, their likelihood of conversion increases. In fact, there’s a 3.8% lift in conversion when a site visitor is served some form of UGC.

UGC Interactions Drive Conversions

Though the presence of UGC impacts conversion, the real magic happens when visitors interact with this content. In 2022, there was a 102.4% lift in conversion among UGC interactors – which is up slightly from 100.6% in 2021. 

Snapshot: How UGC Impacts Conversion
2020
eCommerce UGCPage Visitor Overall Conversion Rate
3.4%
UGC Impression Conversion Rate
3.6%
4.3% conversion lift from UGC impression
UGC Interaction Conversion Rate
7.2%
108.4% conversion lift from UGC interaction
2021
eCommerce UGCPage Visitor Overall Conversion Rate
2.8%
UGC Impression Conversion Rate
3.1%
8.5% conversion lift from UGC impression
UGC Interaction Conversion Rate
5.7%
100.6% conversion lift from UGC interaction
2022
eCommerce UGCPage Visitor Overall Conversion Rate
3.2%
UGC Impression Conversion Rate
3.3%
3.8% conversion lift from UGC impression
UGC Interaction Conversion Rate
6.4%
102.4% conversion lift from UGC interaction

Throughout this report, we’ll dig deeper into the different ways shoppers are interacting with UGC – and how these myriad interactions impact conversion. 

Chapter 3

The Impact of Ratings & Reviews on Purchase Behavior

Ratings and Reviews Continue Boost Conversion Rates 2X

At the start of the pandemic, consumers started shifting a greater portion of their spending online. Three years later, this trend continues – with no signs of slowing down. By 2026, Statista predicts that ecommerce will account for 24% of total retail sales worldwide.

There are many benefits to browsing and buying online. But one downside is that there’s risk involved with purchasing a product without first experiencing it in person.

Reading reviews from those who have already purchased the product in question helps shoppers overcome this risk. In addition, accessing this feedback increases shoppers’ likelihood of making a purchase. In 2022, there was a 108.6% lift in conversion among site visitors who interact with ratings and reviews – which is up slightly from 2021.

How Review Interactions Impact Conversion
Lift in conversion when visitors interact with ratings and reviews
2020
120.3%
2021
108.3%
2022
108.6%

How Myriad Review Interactions Drive Conversion

Each ratings and reviews display includes a number of features and functionality that help shoppers find and consume the most relevant content. In the chart below, you’ll see a high level look at how key ratings and reviews features impact conversion. Then, we’ll take a closer look at each of these features.
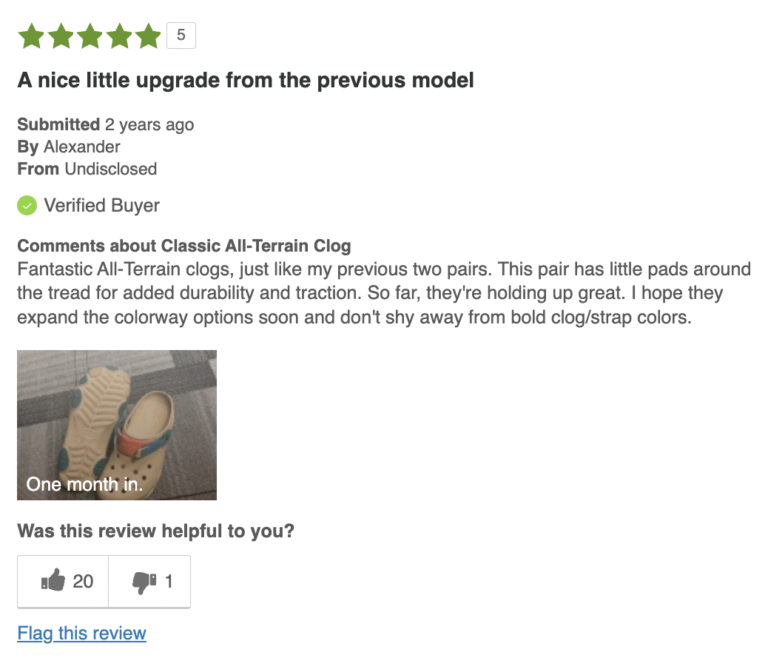
How Key Review Features Impact Conversion
Conversion lift among visitors who engaged with each ratings and reviews feature, compared to the standard conversion rate for the same pages
Helpful Yes
356.3%
Helpful No
271.9%
Review Search
271.9%
Footer Back to Top
178.1%
Footer Page Previous
162.5%
Review Snippet
153.1%
Faceoff Positive
131.3%
Faceoff Negative
118.8%
Review Sort
103.1%
Footer Page Next
93.8%
Filter Tag
84.4%
Filter Stars
81.8%
More Details
65.6%

Helpful Votes

Let’s face it: some reviews are more helpful than others. The reviews that are most helpful are those that speak to the individual’s wants, needs, use cases, and concerns. On many review displays, a shopper can indicate whether a review is or isn’t helpful by clicking on a thumbs up or thumbs down icon.

Again this year, helpful voting is the type of review interaction with the largest impact on conversion. There’s a staggering 356.3% lift in conversion for visitors who click the thumbs up to indicate a review was helpful. 

However, a less-than-helpful review doesn’t mean the sale is doomed. Quite the opposite. Site visitors who click the thumbs down icon convert at a rate that’s 271.9% higher than average. 
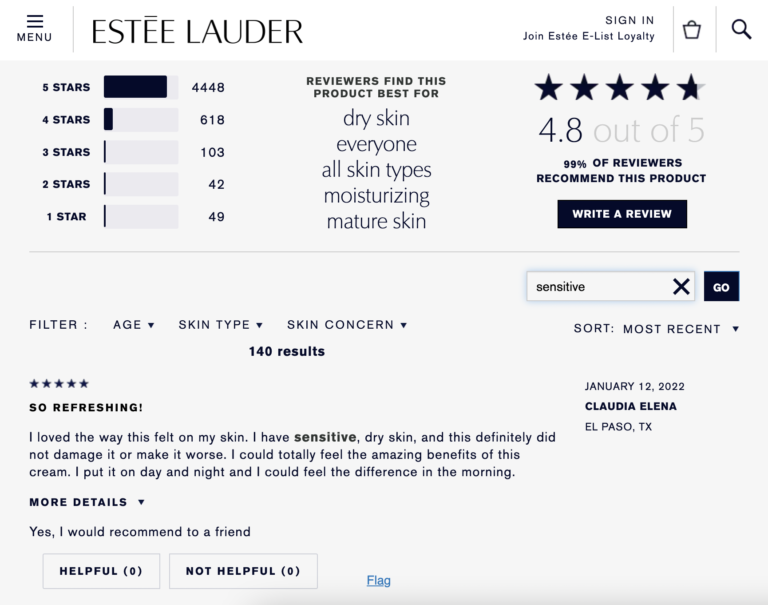
Review Search

These days, consumers expect to find a high volume of reviews for any product they’re considering. A recent survey found that nearly a quarter (23%) of consumers say that ideally, products should have 500 reviews or more!

But that doesn’t mean shoppers are reading every review for a product. Instead, they’re honing in on the content that’s most relevant to them. One way they do this is by doing a search for a specific keyword or phrase. 

Using the review search bar has a huge impact on conversion. Those who use it convert at a rate that’s 271.9% higher than average.

Footer Actions

By default, a certain number of reviews are displayed on a given product page. Once a visitor has scrolled to the bottom of the display, they typically have the option to navigate in a number of ways. 

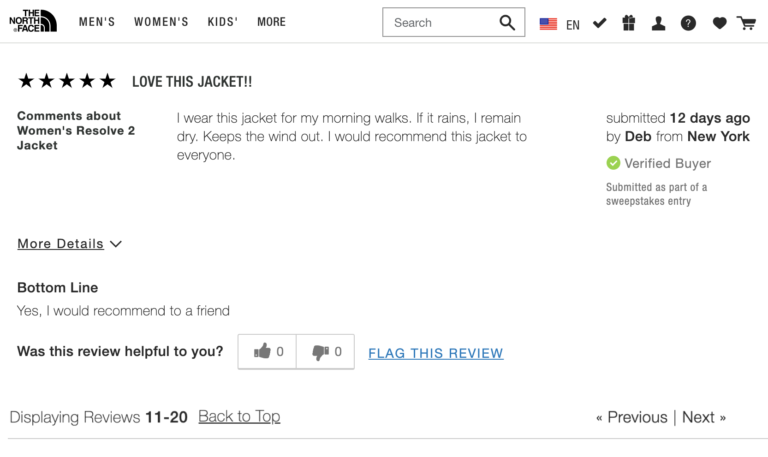
Here’s a look at three such actions – and how each impacts conversion rates. Interestingly, clicking “back to top” was the footer action with the largest impact on conversion in 2022. In both 2021 and 2020, hitting the “previous” link was the footer action with the largest impact. 
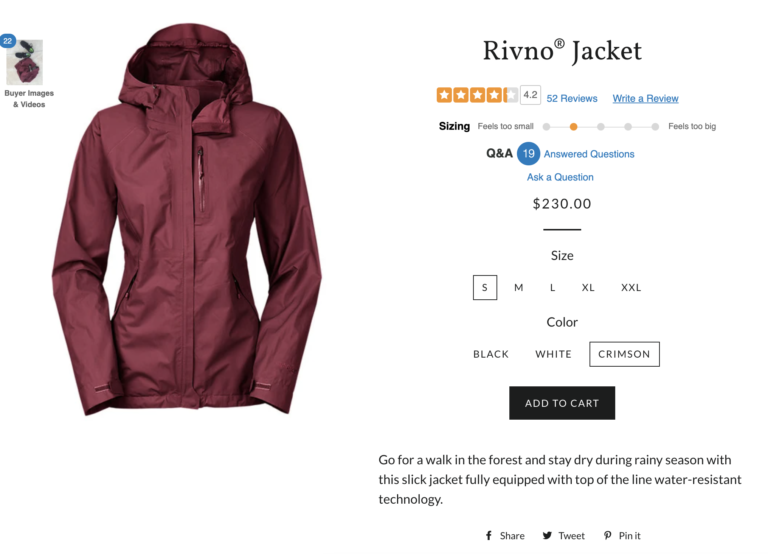
How Footer Actions Impact Conversion
2020
Back to Top
129.4%
Previous
288.2%
Next
182.4%
2021
Back to Top
178.6%
Previous
242.9%
Next
117.9%
2022
Back to Top
178.1%
Previous
162.5%
Next
93.8%

Review Snippet

The vast majority of consumers actively seek out review content. As such, it’s a best practice to display a summary of review content at the top of the product page. This summary – also known as a snippet – usually includes information like the average star rating and review count for the product in question. 

A great average star rating can entice shoppers to click the snippet. When they do, they’re taken to the full review display to sort, filter, search and read reviews. 

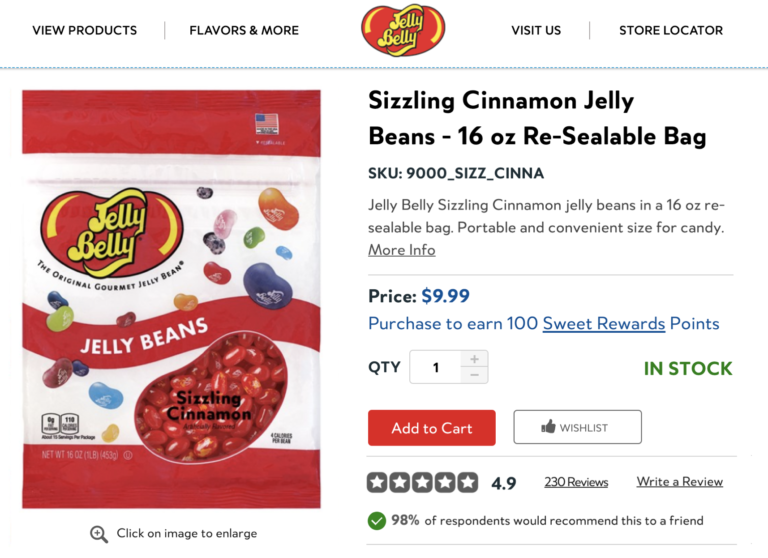
In 2022, there was a 153.1% conversion lift among site visitors who clicked the review snippet. If you don’t already, be sure to incorporate a review snippet “above the fold” on your product pages. This content is sure to capture shoppers’ attention, entice them to learn more, and ultimately, convince them to convert!

Review Faceoff

Some brands and retailers incorporate a review faceoff into their display. Essentially, a faceoff shows a product’s most liked positive review next to its most liked negative one. Faceoffs are a really helpful tool for shoppers. Faceoffs allow consumers to quickly and understand the best and worst experiences others have had with the product. 

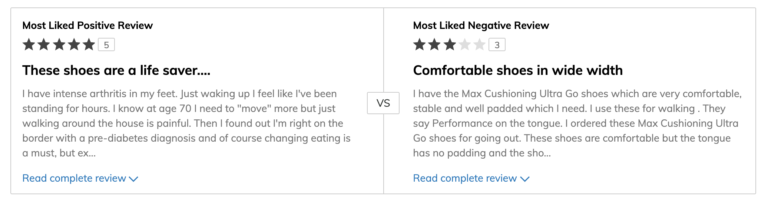
Perhaps not surprisingly, there’s a significant lift in conversion – to the tune of 131.3% – among shoppers who click to read the complete positive review featured in the review snapshot. Clearly, a glowing review can be the push a shopper needs to follow through with a purchase.

What is surprising is that there’s a 118.8% lift in conversion when visitors click to read the complete negative review. This is yet another data point proving that negative reviews – while never the goal – aren’t the enemy. Rather, this content helps shoppers understand the worst case scenario – and whether it’s something they can live with. (*Spoiler alert: it often is).

Review Sorting

As we’ve mentioned multiple times, consumers don’t read every review available for a product. Instead, they seek out content that speaks to their needs and use cases. 

The best review displays include sorting functionality that allows shoppers to quickly surface the most relevant content. For example, shoppers may be able to sort content based on a number of factors, including recency, star rating, helpfulness, and inclusion of visual content.

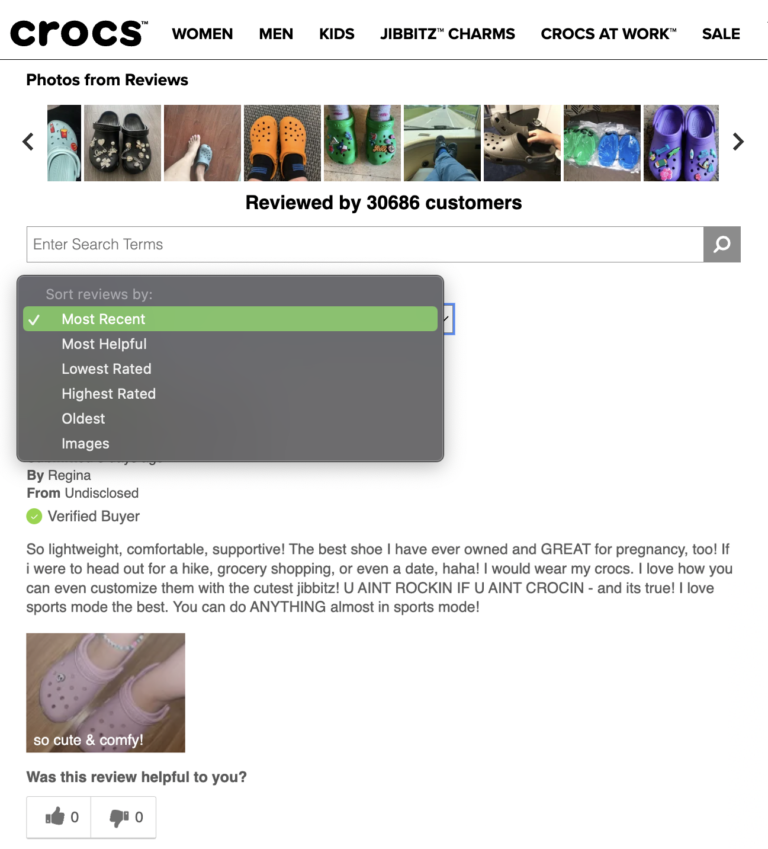
In 2022, there was a 103.1% lift in conversion among visitors who clicked to sort reviews in some manner. 

Different types of sorting behavior have varying levels of impact on conversion. In 2022, the sorting behavior with the greatest impact was sorting by highest rating. This makes sense, as seeing positive reviews front and center can boost confidence and conversion. 

In the chart below, we dig deeper into the conversion impact of the most common types of sorting behavior.

Conversion Lift by Type of Review Sorting Behavior
2020
Highest Rating
158.8%
Most Recent
73.5%
Oldest
108.8%
Most Helpful
200%
Lowest Rating
102.9%
Images
170.6%
2021
Highest Rating
142.9%
Most Recent
196.4%
Oldest
110.7%
Most Helpful
121.4%
Lowest Rating
103.6%
Images
89.3%
2022
Highest Rating
181.3%
Most Recent
171.9%
Oldest
134.4%
Most Helpful
115.6%
Lowest Rating
100%
Images
68.8%

Filter Tags

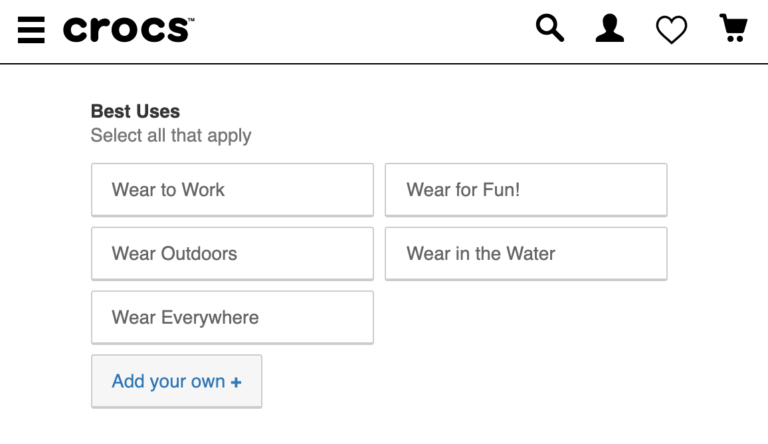
Some brands and retailers ask reviewers to select “tags” related to the product. These might include pros, cons and best uses of a product – among other, merchant-specific tags. For example, a reviewer might indicate that a con of a pair of shoes is that they’re unfashionable – but a best use is for wearing to work.

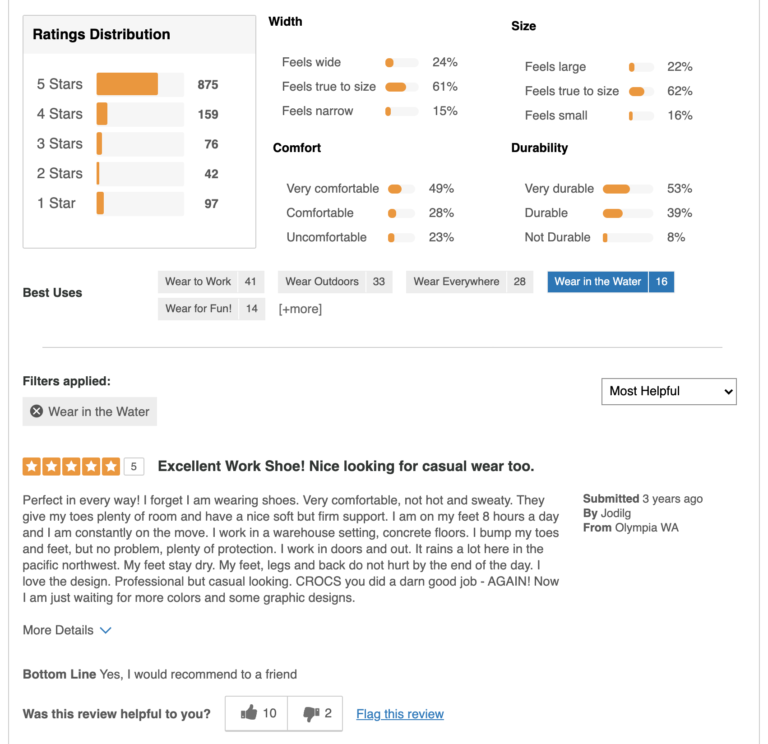
Then, future shoppers can filter reviews using these specific tags. For example, a consumer can click on “wear in water” to see all 16 reviews that list this as a best use for the product. 

In 2022, site visitors who used tag filtering converted at a rate that’s 84.4% higher than average. This is up from a 78.6% lift in conversion in 2021. 

Star Filters

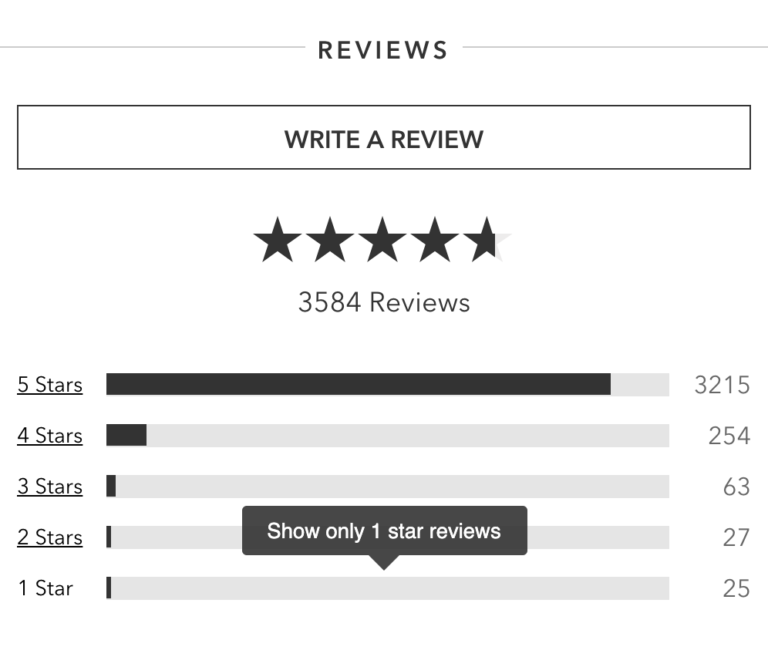
Many review displays include functionality that allows visitors to drill down reviews by star rating. Visitors can see how many reviews are available for each star rating. Then, they can click on a star rating to see only the content with that particular rating. 

There’s an 81.8% lift in conversion among visitors who take the action of filtering reviews by any star rating.

When it comes to conversion, does the star rating selected by the visitor matter? Take a look at the graphic below and you’ll see the answer is yes.

Engagement and Conversion Lift for Star Filtering
Portion of visitors who engage with each star filter – and how it impacts conversion
5 Stars
Star Interactors Engage
29%
Conversion Lift
134.4%
4 Stars
Star Interactors Engage
20.7%
Conversion Lift
131.3%
3 Stars
Star Interactors Engage
23.4%
Conversion Lift
106.3%
2 Stars
Star Interactors Engage
23.1%
Conversion Lift
96.9%
1 Star
Star Interactors Engage
61.3%
Conversion Lift
71.9%
Note: Star interactors typically filter by more than one rating.

Filtering by one-star reviews is the most common way for shoppers to engage with rating filters. That’s not surprising. A recent survey found that nearly all (96%) of shoppers seek out negative reviews. 52% specifically look for one-star reviews. 

Brands and retailers may think this is a bad thing. If a shopper sees all the negative reviews for a product, surely it’ll scare them away, right? Wrong. 

In reality, visitors who filter to see one-star reviews convert at a rate that’s significantly higher than average. There’s a 71.9% lift in conversion among visitors who click to see only one-star reviews. 

Clearly, negative reviews aren’t a deterrent. Rather, they’re an important tool that help shoppers find the right products – and make informed purchase decisions. 

Read More

In some cases, shoppers can expand a review to get additional details.

In 2022, there was a 65.6% lift in conversion among visitors who clicked to expand a review to get more details. This is up significantly from 2021, when there was a 50% conversion lift for this interaction. 

Chapter 4

How Q&A Interactions Drive Conversion

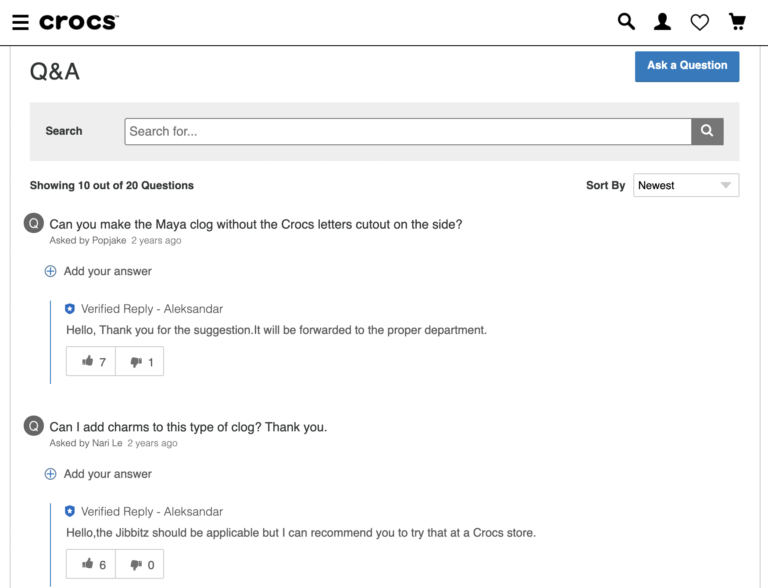
In-store shoppers have the opportunity to ask questions and get product recommendations. Online shoppers don’t have that opportunity.

Increasingly, brands and retailers are bridging the gap by incorporating a questions and answers (Q&A) section onto product pages. This functionality allows shoppers to browse questions that have already been asked and answered. Of course, shoppers can also submit their own queries. 

Q&A Reigns as the Most Powerful Conversion Booster

In the two previous editions of this report, we found that Q&A was the type of UGC with the most significant impact on conversion. This is still true. 

In 2022, there was a 177.2% lift in conversion among visitors who interacted with Q&A in some way. While this is down slightly from 2021, it is still extremely significant. 

Brands and retailers that don’t incorporate Q&A into their product pages are missing out on a simple – yet hugely impactful – opportunity to grow conversion.

How Q&A Interactions Impact Conversion
Lift in conversion when visitors interact with Q&A
2020
157.1%
2021
194.2%
2022
177.2%

How Different Q&A Interactions Drive Conversion

Each Q&A display incorporates features and functionality to make it easier for shoppers to consume existing content and submit their own. The ways consumers interact with these features impact conversion. 

Below is a high level overview of how various features and functionality impact conversion. Then, we’ll take a closer look at each. 
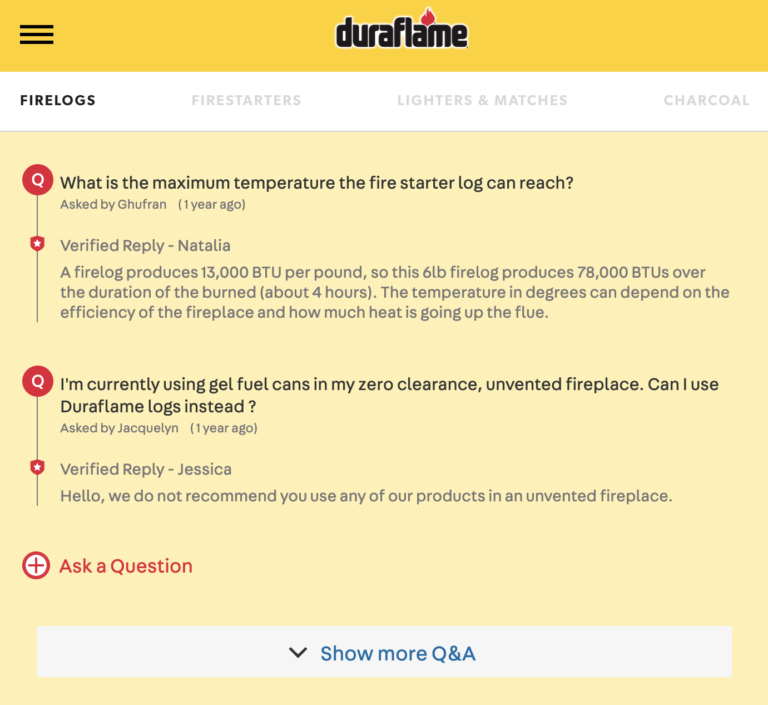
How Various Q&A Features Impact Conversion
Conversion lift among site visitors who engaged with each feature
Show More Answers
178.1%
Click Read Answers
178.1%
Answer Helpful
165.6%
Answer Question
131.3%
Ask Question Snippet
103.1%
Ask Question Header
93.8%

Show More Answers

A set number of questions and answers appear in a given Q&A display. A shopper can then click on text that says “Show more Q&A” to access additional content – if it exists.

Shoppers that seek out additional Q&A beyond the initially displayed content are interested in learning as much as they can about a product. These folks are also more likely to make a purchase. There’s a 178.1% lift in conversion among shoppers who click “Show more Q&A” – making it one of the two most impactful Q&A features on conversion.

Click Read Answers

Typically, a single answer is displayed for a question submitted via Q&A. But, there are circumstances when there may be multiple answers available to a single question. For instance, a single question may have a response from the brand, in addition to one from a previous customer sharing their perspective. Visitors can see additional responses (if they’re available) by clicking on “show 1 more answer.”

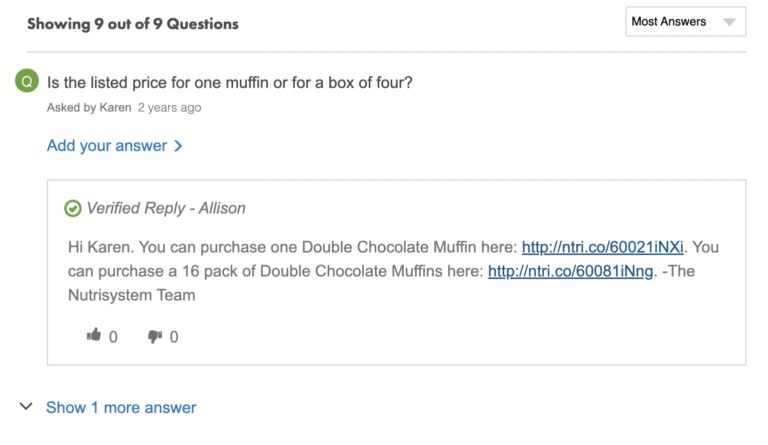
Those who do so convert at a rate that’s 178.1% higher than average. 
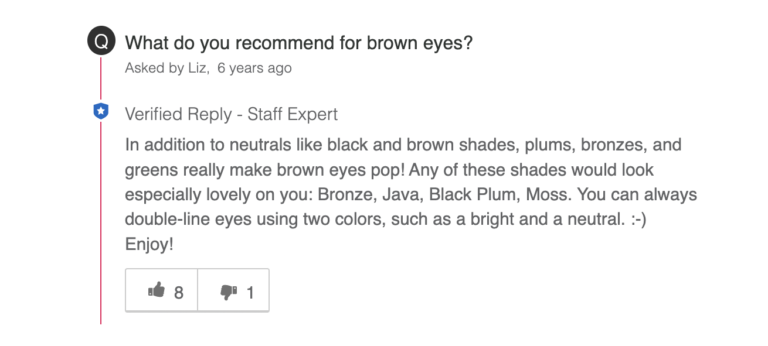
Answer Helpful

In some cases, a site visitor might find a specific answer to a question to be especially helpful in their purchase journey. It may even be the factor that led to them confidently clicking “add to cart.”

If so, the shopper can tap or click the thumbs up icon to indicate it was helpful. This helps future shoppers quickly identify the most helpful content.

There’s a 165.6% lift in conversion among site visitors who click the icon indicating an answer was helpful. 
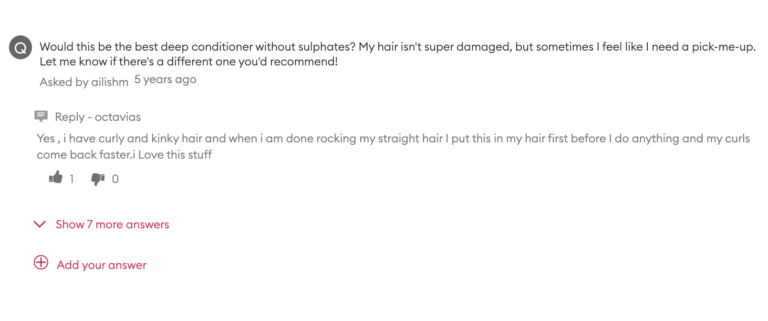
Answer Question

Of course, brand-provided responses to questions are extremely helpful. But a growing number of brands and retailers are also allowing existing customers to answer questions about products they’ve purchased in the past. This makes sense because consumers trust their peers. Research tells us 94% of consumers value answers to Q&A that are posted by other consumers who have already purchased the product. 

Some Q&A displays allow customers to submit their answer to an existing question by clicking on the text that says “add your answer.” There’s a 131.3% lift in conversion among those who do. 

Ask Question Snippet

A best practice is to include a UGC overview – also referred to as a snippet – at the top of product pages. This snippet provides a high level summary of the UGC available for the product,  including the item’s average star rating and review count – as well as the number of answered questions. Some brands and retailers also incorporate a link for shoppers to click to ask their own question. 

There is a 103.1% lift in conversion among site visitors who click on “Ask a Question” in the UGC snippet.

Ask Question Header

Another way shoppers can submit a question is to click or tap the “Ask a Question” button in the Q&A header. Those who do so convert at a rate that’s 93.8% higher than average. 

Crocs product pages feature searchable Q&A sections for customers needing additional info
Chapter 5

How User-Generated Imagery Impacts Purchase Behavior

We know from previous research that over three-quarters (77%) of consumers always or regularly seek out photos and videos from others who have actually purchased the product in question.

Interacting with this content boosts shoppers’ confidence – and the likelihood of making a purchase. We see a 6.5% conversion rate among site visitors who interact with user-generated visual content – which is a 103.9% lift in conversion!

Interactions with User-Generated Visual Content Drive Big Conversion Lifts
Lift in conversion when visitors interact with user-generated imagery
2020
91.4%
2021
106.3%
2022
103.9%

A Closer Look at How Interactions with User-Generated Visual Content Boost Conversion

Clearly, user-generated visual content has the power to significantly increase conversion rates. Now, let’s take a closer look at how different forms of visual content interaction impact conversion.

The Impact of Visual Content Interactions on Conversion Rates
Lift in conversion with different types of visual content interactions
Image Gallery
103.1%
Image Gallery Next
106.3%
Image Gallery Previous
93.8%

Image Gallery

Increasingly, consumers seek out photos and videos from other consumers who have purchased a given product. It’s a best practice to showcase this imagery in a visual content gallery on your product pages. Doing so is an important way to boost confidence – and purchase likelihood. 

In 2022, there was a 103.1% in conversion among site visitors who clicked on any image within a visual content gallery. 

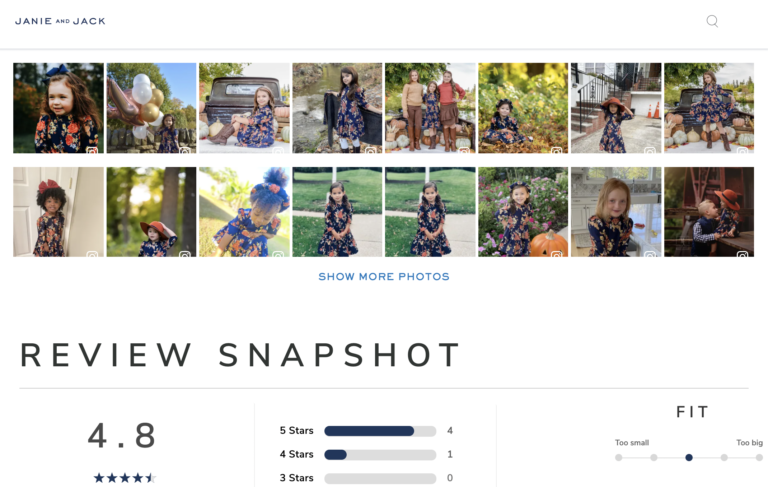
Image Gallery Navigation

An image or video in an image gallery captures a shoppers’ attention, so they click on it to make it larger. Once they’re satisfied, they may opt to view other imagery by clicking on the forward and backward arrows. 

There’s a 106.3% conversion lift among visitors who click the arrow to see the next image – which is up slightly from 2021. On the other hand, there’s a 93.8% conversion lift among those who click the backward arrow to see the previous image. 

Chapter 6

5 Key Takeaways for Maximizing the Conversion Impact of UGC

User-generated content is an expected part of the purchase journey. It’s also a powerful tool proven to drive significant impact on conversion.

The following are our top five key takeaways from this new analysis.

One
The Presence of UGC is Powerful

The simple act of displaying UGC impacts conversion. There’s a 3.8% conversion lift among shoppers who scroll a product page long enough to be served up some type of UGC. The conversion lift is significantly higher – 102.4% – among shoppers who interact with that content in some manner. 

While UGC was once a nice-to-have, it’s now a must-have. Brands and retailers that don’t collect and display this content are missing out on a simple, yet powerful way to drive sales. 

Two
Ratings and Reviews (Still) Double Conversion

There are many benefits to online shopping. But a downside is that there’s some risk involved with purchasing a product sight unseen. Reading ratings and reviews helps online shoppers mitigate this risk – and increase their purchase likelihood. Case in point? There’s a 108.6% conversion lift among shoppers who interact with ratings and reviews on product pages. 

If you’re not already collecting reviews, start doing so ASAP. If you are collecting reviews, look for ways to collect more. In both cases, develop a winning, conversion-boosting review display. Be sure to incorporate features and functionality that make it easy for shoppers to hone in on the content that’s most relevant to them. A great place to start is to try out the myriad features that are proven to drive the largest impact to conversion. 

Three
Q&A Remains the Most Impactful Form of UGC

In-store shoppers can ask questions in-person. Online shoppers don’t have that luxury. Instead, many are turning to the Q&A portion of product pages to browse existing questions and ask their own. We know from previous research that 72% of online shoppers always or regularly read Q&A. And 68% submit their own. 

Those who interact with Q&A also convert at a rate that’s 177.2% higher than average. This makes it the most impactful form of UGC on conversion yet again.

Consider adding a Q&A portion to your product pages. It’s a sure way to address purchase blocking questions and boost conversion. If you already have Q&A on your product pages, consider optimizing your display with conversion-boosting features and functionality.

Four
The Impact of User-Generated Imagery Can’t be Denied

Brand-provided imagery still has a role to play. But increasingly, consumers seek out visual content from others like them who have already purchased and used the product in question. 

This visual content has a huge impact on conversion. There’s a 103.9% increase in conversion among visitors who interact with user-generated photos and videos. 

This year, make it a priority to collect more photos and videos from your shoppers. You can do so by including a request for imagery in your write-a-review form. You can also curate this content directly from Instagram. Then, be sure to feature your user-generated visual content in a gallery on your product pages so it’s easy for your shoppers to find and consume.

Five
The Best Brands and Retailers are Committed to Ongoing Measurement and Optimization

Throughout this report, we dove deep into how various UGC features impact conversion overall. But remember: there’s no “one site fits all” UGC display that should be adopted by all brands and retailers. What works for one business may not for another. 

Ongoing measurement is key. Your UGC provider should offer robust reporting capabilities that allow you to easily determine how each type of UGC (and its corresponding features) impacts your conversion rates. You can also see which features aren’t making much of an impact. Armed with these insights, you can make impactful optimizations that’ll drive an even bigger boost to your conversion rates – and your bottom line. 

Ratings and reviews have become a key part of the purchase journey for consumers of all ages. But Generation Z shoppers – defined as those born between 1997 and 2013 – interact with this content in ways that differ from previous generations.  

Here’s a snapshot of how Gen Z shoppers consume reviews and how this content (or a lack thereof) impacts their purchase behavior, curated from our research from the past two years. 

For Young Shoppers Ratings and Reviews are a Must

Gen Z shoppers rely on reviews, whether they’re shopping online, in-store, or some combination of the two. Failing to collect and display this content is a sure way to lose Gen Z shoppers. 

of online shoppers read reviews at least sometimes.
0 %
of Gen Z seek out websites with reviews.
0 %
of Gen Z shoppers read reviews while shopping in-store.
0 %
are less likely to buy a product if there are no reviews.
0 %

Star Ratings Alone Aren’t Enough

A star rating is important. But for many Gen Zs, it’s not enough.

of Gen Zs always go beyond the basics to read the content of reviews.
0 %
Gen Z Shoppers Are Less Likely to Purchase a Product with Star Ratings Alone
Are you more or less likely to purchase a product if it only has star ratings, not written reviews?
Less likely
64%
More likely
13%
The same
23%

Volume and Recency are Top Considerations for Gen Z Shoppers

Gen Zs weigh many factors when reading reviews. Volume and recency top the list. 

Volume
are more likely to buy a product with 1,000 reviews than one with 100 reviews (assuming the average star ratings are identical).
0 %
of Gen Z say that volume is especially important when considering a new or unknown product.
0 %
Recency
of Gen Z would explore alternative products if the one they originally considered only had reviews that were three months or older.
0 %
would explore alternative products if all reviews for the product they were considering were a year or older.
0 %

Visual Content is a Valued Component of Reviews

Increasingly, young shoppers seek out visual content from others who have already purchased and used a given product. For many, the presence (or absence) of this content within reviews has a significant impact on purchase behavior. 

How Often Gen Zs Seek out Visual Content Within Reviews
Always
48%
Regularly
33%
Sometimes
17%
Never
2%
of Gen Zs are more likely to buy a product that has reviews that include photos and videos.
0 %

Authenticity is a Growing Concern Among Gen Z

Gen Z shoppers trust feedback from other shoppers like them. But fraudulent content is top of mind. 

of Gen Z are concerned with fake reviews.
0 %
indicate their concern has grown in the past five years.
0 %

Perfect Reviews are Too Good to be True

For Gen Z shoppers, negative reviews are a tool that helps fuel informed purchase decisions. And for many, the lack of negative content raises red flags. 

of Gen Z seek out 1-star reviews.
0 %
are suspicious of products with a perfect average star rating.
0 %
Ideal Average Star Rating, According to Gen Z
5 stars
6%
4.5-4.99 stars
38%
4.0-4.49 stars
44%
3.51-3.99 stars
10%
Under 3.5 stars
2%

Reviews Have the Power to Positively Impact Return Rates

Gen Z shoppers are no strangers to returning merchandise purchased online. The good news? The presence of ratings and reviews can dramatically reduce returns among these young shoppers.

Frequency of Merchandise Returns Among Gen Z
Always
3%
Regularly
6%
Sometimes
74%
Never
17%
Of Gen Z shoppers are less likely to return a product if they read ratings and reviews prior to purchase.
0 %

Gen Z Shoppers are Prolific Review Writers

In addition to reading reviews, Gen Z shoppers often write their own content. They do so for a number of reasons.

Review Submission Frequency
Multiple times per month
62%
Once per month
15%
Once every 1-3 months
9%
Once every 4-6 months
4%
Once every 7-12 months
0%
Less than once per year
7%
I never provide ratings and reviews (unless I receive a free sample)
3%
Top Motivations for Writing Reviews
A positive experience
86%
Receiving free product samples
79%
Helping and guiding others
75%
A negative experience
71%
Incentives (reward points, discounts, etc.)
65%

Are you Meeting the Expectations of Gen Z Shoppers?

Gen Z shoppers are coming of age, and their purchasing power will only continue to grow. Brands and retailers need to take account of their unique needs, habits, and preferences. 

Are you Meeting the Expectations of Gen Z Shoppers?

Gen Z shoppers are coming of age, and their purchasing power will only continue to grow. Brands and retailers need to take account of their unique needs, habits, and preferences. 

Category Benchmarks

Wondering how your UGC program stacks up? Here are benchmarks for the Health & Beauty category:

Avg. Review Coverage
0 %
Avg. Reviews/Product
0
Avg. Rating
0
Avg. Review Length
0
Avg. Media Coverage
0 %
Avg. Media/Product
0
Avg. Prod Question Coverage
0 %
Avg. Questions/Product
0

Methodology: Analysis of lifetime Ratings and Reviews submitted across 25.4MM+ online product pages on 3,600+ brand and retailer sites as of March 6, 2023

Best Practices

Not quite there yet? Check out some of our best practices to learn about how you can level up your UGC program.

Learn more about how PowerReviews can help you do more with UGC
The main return habits of consumers and what brands and retailers can do to reduce their likelihood, according to a survey of 9,000+ consumers.

Survey at a Glance:

The Why Do Shoppers Return Purchases, and How Can Brands and Retailers Reduce Returns  report is based on a survey of 9,286 US adults fielded in November 2022. Here’s a snapshot of our key findings.

Your Return Policy Can Make or Break the Sale
  • Eight in ten (81%) of shoppers say that free shipping is an important consideration when making a purchase online.

  • 87% of consumers would be at least a little likely to stop shopping with a brand or retailer that stopped offering free returns; 39% would be very likely to do so. 

  • 80% of consumers would be at least a little likely to stop shopping with a brand or retailer if they reduced the time window in which they’d accept free returns; 17% would be very likely to do so.
Shoppers Aren’t Shy About Returning Products Purchased Online
  • Nearly nine in 10 (88%) shoppers return products purchased online at least sometimes. 

  • 53% of consumers return products purchased online as often as they return those purchased in store. Only 18% return online merchandise more often. 

  • Shoppers return products across all categories, but clothing (82%), shoes (51%) and electronics (43%) top the list. 
Sustainability is Top of Mind for Consumers – and Can be a Competitive Differentiator for Brands and Retailers
  • Just 17% of consumers think that the majority of returned products are discarded.
  • Three-quarters of shoppers are at least somewhat concerned with the environmental impact of free returns; 14% are very concerned. 
  • 92% of consumers are at least a little inclined to shop with a brand or retailer if they have more sustainable return and shipping practices. Four in 10 (40%) are very inclined to shop with such a brand. 
Consumers Have Myriad Reasons for Returning Products Purchased Online – Many of Which Can Be Addressed
  • Damages and defects are the top reason for returns; 81% of consumers have returned products purchased online because they were damaged or defective.

  • Poor fit is a reason for returns among 75% of consumers.
  • The number three reason for returns is that the item didn’t match its description; 56% of consumers cited this as a reason. 
User-Generated Content is a Powerful Way to Combat Some of the Top Reasons for Product Returns
  • 72% of consumers are less likely to return a product they purchased online if they were able to read questions from other consumers and submit their own via the Q&A section on the product page prior to purchase. 

  • Being able to see photos and videos from other consumers before making a purchase reduces the return likelihood for 69% of shoppers. 

  • 66% of shoppers say the ability to read ratings and reviews prior to purchase decreases their likelihood to make a return.
  •  
Chapter 1

Introduction

Product returns are a fact of life for all brands and retailers – even the best out there. Returns (especially free ones) are a logistical nightmare – and a costly one at that. According to an NRF survey, the average retailer incurs $166 million in returns for every $1 billion in sales. And the costs of shipping both ways, labor, and storage add up. 

To add insult to injury, Gartner research found that less than half (48%) of returned merchandise can be resold at full price. In fact, returned merchandise ends up in the landfill more often than we’d like to think – causing a big hit to both your bottom line and the environment.

It’s no wonder why a growing number of brands and retailers are saying “enough is enough” and taking action to reduce returns. Some – including industry leaders like the Gap and J.Crew – have reduced the window in which they’ll accept free returns. And according to an article for RetailWire, others, including Abercrombie & Fitch, REI, and Anthropologie, are charging a fee for mailed returns. Some are even doing both. 

Tightening your returns policies may help you reduce the amount of merchandise that’s sent back. But if your policies are too rigid, it’ll likely cost you your customers. That’s because modern consumers have come to expect flexible (and free) returns across product categories.

Brands and retailers must strike the right balance of meeting shoppers’ expectations for flexible returns – while still preserving profits. But how?

The first step is to take a closer look at the returns habits of modern consumers – and the reasons behind their behaviors. By understanding the key motives behind returns, brands and retailers can more effectively address them.

We surveyed more than 9,000 U.S. consumers to understand how return policies impact purchase decisions, why shoppers return merchandise, and strategies that help brands and retailers to combat many of these reasons.

Methodology

This report is based on an analysis of a survey completed by 9,286 adult consumers in the U.S. The survey was fielded in November of 2022. 

Here’s a closer look at who we surveyed:

Generations

Gen Z
(1997-present)
1%
Millennials
(1981-1996)
63%
Gen X
(1965-1980)
28%
Baby Boomers
(1946-1964)
8%

Household Income

$0-$25,000
9%
$26,000-$50,000
19%
$51,000-$75,000
19%
$76,00-$100,000
20%
$101,000-$250,000
25%
$250,000+
3%
Prefer not to say
5%

Average Overall Monthly Online Spend

*Calculated based on the mean of the responses to the following question: Please enter a rough estimate how much you spend OVERALL ONLINE PER MONTH in the box here (in US Dollars).
$646.95
Chapter 2

Top Considerations When Shopping Online

We know from previous research that ratings and reviews have become the most important factor impacting purchase decisions, followed by price. 

But beyond those basics, there are many other things consumers consider when making purchase decisions. Free shipping tops the list, with nearly all (99%) of consumers indicating it’s something they consider when purchasing online. At 81%, free returns comes in at #2. 

Consumers’ Top Considerations When Purchasing Online
Which of the following are important options/considerations to you when making a purchase online?
2021
Free shipping
96%
Free returns
79%
Fast shipping
74%
Buy online, return in-store
48%
Buy online, pickup in-store
48%
2023
Free shipping
99%
Free returns
81%
Fast shipping
72%
Buy online, return in-store
50%
Buy online, pickup in-store
47%

Free returns are a top consideration among all generations and income levels. However, in line with last year’s findings, the higher a consumer’s household income, the more likely they are to value free returns. 

Income Comparison: Shoppers Who Say Free Returns are Important
Are you more likely to leave a review for more expensive products?
2021
$0-$25,000
75%
$26,000-$50,000
76%
$51,000-$75,000
77%
$76,000-$100,000
80%
$101,000+
83%
2023
$0-$25,000
75%
$26,000-$50,000
76%
$51,000-$75,000
77%
$76,000-$100,000
80%
$101,000-$250,000
82%
$250,000+
86%
Prefer Not to Say
86%
Chapter 3

How Changes to Return Policies Impact Purchase Behavior

The majority of consumers say that free returns is something they look out for when making purchase decisions. Yet, a growing portion of brands and retailers are looking to scale back on free returns to reduce overheads. Some are eliminating free returns altogether. Others are shortening the window for making returns. 

How do changes to returns policies impact shoppers’ behaviors?

Axing Free Shipping will Send Customers Packing

87% of consumers say they’d be at least a little likely to stop shopping with a brand if they stopped offering free returns; 39% are very likely to ditch the brand. 

How Eliminating Free Returns Impacts Purchase Likelihood
If a brand stopped offering free returns, how likely is it you would stop shopping there?
Very likely
39%
Somewhat likely
28%
A little likely
20%
Not at all likely
13%

Eliminating free shipping has a similar impact on shoppers of all generations. However, Gen Z has the smallest portion of shoppers indicating they’d be very likely to stop shopping with a brand if they stopped offering free returns. 

Generational Comparison: How Eliminating Free Returns Impacts Purchase Likelihood
If a brand stopped offering free returns, how likely is it you would stop shopping there?
Gen Z
Very likely
28%
Somewhat likely
31%
A little likely
24%
Not at all likely
17%
Millennials
Very likely
38%
Somewhat likely
28%
A little likely
21%
Not at all likely
13%
Gen X
Very likely
40%
Somewhat likely
27%
A little likely
20%
Not at all likely
13%
Boomers
Very likely
42%
Somewhat likely
27%
A little likely
19%
Not at all likely
12%

In addition, as household income increases, so too does the portion of shoppers indicating they’re very likely to abandon a brand if they stop offering free shipping. 

Income Comparison: How Eliminating Free Returns Impacts Purchase Likelihood
If a brand stopped offering free returns, how likely is it you would stop shopping there?
$0-$25,000
Very likely
31%
Somewhat likely
26%
A little likely
23%
Not at all likely
20%
$26,000-$50,000
Very likely
35%
Somewhat likely
27%
A little likely
21%
Not at all likely
17%
$51,000-$75,000
Very likely
38%
Somewhat likely
26%
A little likely
22%
Not at all likely
14%
$76,000-$100,000
Very likely
40%
Somewhat likely
28%
A little likely
20%
Not at all likely
12%
$101,000-$250,000
Very likely
42%
Somewhat likely
30%
A little likely
19%
Not at all likely
9%
$250,000+
Very likely
52%
Somewhat likely
25%
A little likely
14%
Not at all likely
9%

Shortened Return Windows will Deter Shoppers

Eight in ten consumers would be at least a little likely to stop shopping with a brand or retailer if they reduced the time window in which they would accept free returns; 17% would be very likely to do so.

How Shortening the Return Window Impacts Purchase Likelihood
If a brand or retailer reduced the time window in which it would accept free returns, how likely is it you would stop shopping there?
Very likely
17%
Somewhat likely
32%
A little likely
31%
Not at all likely
20%

The impact of a reduced free return window is very similar across generations. However, Gen Z shoppers are slightly more prone to indicate they’re very likely to ditch a brand after they shorten the window for free returns. 

Generational Comparison: Impact of Shortening Return Window on Purchase Likelihood
If a brand or retailer reduced the time window in which it would accept free returns, how likely is it you would stop shopping there?
Gen Z
Very likely
19%
Somewhat likely
30%
A little likely
32%
Not at all likely
19%
Millennials
Very likely
17%
Somewhat likely
32%
A little likely
31%
Not at all likely
20%
Gen X
Very likely
16%
Somewhat likely
32%
A little likely
32%
Not at all likely
20%
Boomers
Very likely
17%
Somewhat likely
31%
A little likely
31%
Not at all likely
21%

Shortening the free returns window impacts consumers across all income brackets. However, the lower a consumers’ income, the more probable it is that a shortened return window won’t impact whether they buy from the brand or retailer in the future. 

Income Comparison: How Shortening the Return Window Impacts Purchase Likelihood
If a brand or retailer reduced the time window in which it would accept free returns, how likely is it you would stop shopping there?
$0-$25,000
Very likely
18%
Somewhat likely
32%
A little likely
26%
Not at all likely
24%
$26,000-$50,000
Very likely
16%
Somewhat likely
31%
A little likely
30%
Not at all likely
23%
$51,000-$75,000
Very likely
16%
Somewhat likely
31%
A little likely
32%
Not at all likely
21%
$76,000-$100,000
Very likely
18%
Somewhat likely
32%
A little likely
31%
Not at all likely
19%
$101,000-$250,000
Very likely
17%
Somewhat likely
31%
A little likely
34%
Not at all likely
18%
$250,000+
Very likely
19%
Somewhat likely
34%
A little likely
33%
Not at all likely
14%
Chapter 4

Concern with the Environmental Impact of Free Returns

For many consumers, free returns have become an expectation. While free returns are convenient for consumers, there’s no denying their negative impact on the environment. 

Consumers Underestimate the Portion of Returned Products That are Trashed

A returned product might face any number of fates – depending on factors including product type, condition, and reason for return. And unfortunately, a large portion ends up in the trash heap.

But what do consumers think happens to the merchandise they’ve returned? 

The largest portion of consumers (44%) believe that the majority of returned merchandise is resold. A mere 17% think that most returned merchandise ends up being discarded. Yet, according to an article for NPR, about a quarter of returns are trashed.  

What Consumers Think Happens to Most Returned Merchandise
What do you think happens to the majority of products you return?
Discarded
17%
Donated
3%
Resold
44%
Unsure
36%

Gen Z shoppers have a more realistic view of the portion of returned merchandise that is thrown away. Also of note, the older the consumer, the more likely they are to be unsure of what happens to returned merchandise. 

Generational Comparison: What Consumers Believe Happens to Returned Products
What do you think happens to the majority of products you return?
Gen Z
Discarded
24%
Donated
5%
Resold
38%
Unsure
33%
Millennials
Discarded
18%
Donated
3%
Resold
44%
Unsure
35%
Gen X
Discarded
14%
Donated
4%
Resold
44%
Unsure
38%
Boomers
Discarded
12%
Donated
3%
Resold
43%
Unsure
42%

Consumers are Concerned with the Environmental Impact of Free Returns

According to the same NPR article mentioned earlier, returns in the U.S. create nearly six billion pounds of landfill waste each year. And that’s not to mention the 15M tons of CO2 emitted in the returns process. 

But does the environmental impact of free returns concern shoppers? Three-quarters say they’re at least a little concerned; 14% are very concerned. 

Consumers’ Environmental Concerns with Free Returns
How much does the carbon footprint/environmental impact caused by free returns concern you?
Very concerned
14%
Somewhat concerned
34%
A little concerned
27%
Not concerned
25%

Of note, younger consumers are more likely to indicate they’re very concerned about the environmental impact of free returns. 19% of Gen Z consumers are very concerned, compared to 12% of Boomers. On the other hand, older consumers are more likely to say they’re not concerned at all. Nearly a third (31%) of Boomers are not at all concerned with the environmental impact caused by free returns – compared to 20% of Gen Z’ers. 

Generational Comparison: Consumers’ Environmental Concerns with Free Returns
How much does the carbon footprint/environmental impact caused by free returns concern you?
Gen Z
Very concerned
19%
Somewhat concerned
34%
A little concerned
27%
Not concerned
20%
Millennials
Very concerned
15%
Somewhat concerned
37%
A little concerned
26%
Not concerned
22%
Gen X
Very concerned
13%
Somewhat concerned
30%
A little concerned
28%
Not concerned
29%
Boomers
Very concerned
12%
Somewhat concerned
28%
A little concerned
29%
Not concerned
31%

Offering more sustainable return and shipping practices can be a competitive advantage among the many consumers concerned about the environment. Nearly all (93%) of consumers indicate they’re at least a little inclined to shop with a brand or retailer that offers more sustainable return and shipping practices. 40% are very inclined to do so. 

Consumers’ Environmental Concerns with Free Returns
How much does the carbon footprint/environmental impact caused by free returns concern you?
Very inclined
40%
Somewhat inclined
39%
A little inclined
14%
Not at all inclined
7%

Of note, 44% of Gen Z’ers say they’d be very inclined to shop with a brand or retailer with more sustainable return and shipping practices, compared to 35% of Boomers. On the other hand, 11% of Boomers indicate they’re not at all inclined – compared to 5% of Gen Z’ers. 

Sustainable Return and Shipping Practices Can Attract Customers of all Ages
How inclined would you be to shop with a brand or retailer that has more sustainable return and shipping practices?
Gen Z
Very inclined
44%
Somewhat inclined
40%
A little inclined
11%
Not inclined
5%
Millennials
Very inclined
42%
Somewhat inclined
39%
A little inclined
13%
Not inclined
6%
Gen X
Very inclined
36%
Somewhat inclined
39%
A little inclined
17%
Not inclined
8%
Boomers
Very inclined
35%
Somewhat inclined
37%
A little inclined
17%
Not inclined
11%
Chapter 5

The Return Habits of Modern Consumers

Now that we have a clear understanding of the importance consumers place on free shipping – and how changes to free shipping policies impact their behavior – let’s take a closer look at the return habits of consumers.

Returns are Extremely Common

Again this year, 88% of consumers say they return products purchased online at least sometimes. That leaves a mere 12% than never return merchandise purchased online. 

Most Consumers Have Returned Online Purchases
How often would you say you return products ordered online?
2021
Always
2%
Regularly
5%
Sometimes
81%
Never
12%
2023
Always
2%
Regularly
3%
Sometimes
83%
Never
12%

Interestingly, Gen Z are the group most likely to say they never return products purchased online. 

Generational Comparison: Frequency of Online Purchase Returns
How often would you say you return products ordered online?
Gen Z
Always
3%
Regularly
6%
Sometimes
74%
Never
17%
Millennials
Always
2%
Regularly
4%
Sometimes
82%
Never
12%
Gen X
Always
1%
Regularly
2%
Sometimes
84%
Never
13%
Boomers
Always
1%
Regularly
2%
Sometimes
85%
Never
12%

Those consumers with the lowest income ($0-$25,000) are the income group most likely to say they never return products ordered online. That’s likely because they’re not making many discretionary purchases online to begin with. 

On the other hand, those with high incomes ($250,000+) are the income group most likely to say they always or regularly return merchandise they purchase online. Again, this is because high income individuals spend more online – and thus have more opportunities to return merchandise.

Income Comparison: How Eliminating Free Returns Impacts Purchase Likelihood
If a brand stopped offering free returns, how likely is it you would stop shopping there?
$0-$25,000
Always
4%
Regularly
2%
Sometimes
68%
Never
28%
$26,000-$50,000
Always
2%
Regularly
2%
Sometimes
81%
Never
15%
$51,000-$75,000
Always
2%
Regularly
3%
Sometimes
82%
Never
13%
$76,000-$100,000
Always
1%
Regularly
3%
Sometimes
86%
Never
10%
$101,000-$250,000
Always
1%
Regularly
4%
Sometimes
87%
Never
8%
$250,000+
Always
1%
Regularly
9%
Sometimes
85%
Never
5%

Consumers Return Online and In-Store Purchased Merchandise at Similar Rates

It’s easy to assume that merchandise purchased online is returned more frequently than merchandise purchased in-store. This is the case for some consumers – but not all. 

Over half (53%) of shoppers say they return products purchased online as often as they return those purchased in store. Over a quarter (29%) say they return products purchased online less often than items they purchased in-store. 

Online and In-Store Purchases are Returned at Similar Rates
Do you return products purchased online more or less often than you return products you buy in-store?
2021
More
20%
Less
33%
The Same
47%
2023
More
18%
Less
29%
The Same
53%

There are some interesting outliers. For example, nearly half (45%) of Gen Z’ers say they return online purchases less frequently than items purchased in-store. On the other hand, Boomers are the group that’s least likely to say they return online purchases more than in-store ones. 

Generational Comparison: Online Vs. In-Store Purchase Return Frequency
Do you return products purchased online more or less often than you return products you buy in-store?
Gen Z
More
21%
Less
45%
The Same
34%
Millennials
More
20%
Less
30%
The Same
50%
Gen X
More
15%
Less
27%
The Same
58%
Boomers
More
13%
Less
26%
The Same
61%

Also of note, as income increases, so too does the portion of consumers who indicate they return online purchases more frequently than in-store purchases. That makes sense. High income individuals are likely buying more – and thus have more to return.

Income Comparison: Online Vs. In-Store Purchase Return Frequency
Do you return products purchased online more or less often than you return products you buy in-store?
$0-$25,000
More
12%
Less
34%
The Same
54%
$25,000-$50,000
More
14%
Less
33%
The Same
53%
$51,000-$75,000
More
16%
Less
32%
The Same
52%
$76,000-$100,000
More
19%
Less
27%
The Same
54%
$101,000-$250,000
More
22%
Less
24%
The Same
54%
$250,000+
More
32%
Less
22%
The Same
46%

Consumers Return Many Types of Products

Returns are common across many product types. However, there are certain items that are especially susceptible. Again this year, clothing tops the list – followed by shoes and electronics. 

Product Types Most Prone to Returns
Which types of products have you returned in the past?
2021
Clothing
88%
Shoes
44%
Electronics
43%
Home and garden
24%
Health and beauty
21%
Toys
19%
Appliances
18%
Groceries
14%
Baby
11%
Computers
8%
2023
Clothing
82%
Shoes
51%
Electronics
43%
Home and garden
22%
Health and beauty
25%
Toys
25%
Appliances
22%
Groceries
19%
Baby
14%
Computers
9%
Chapter 6

Why Consumers Return Online Purchases

Returns are all too common. But what are the top reasons consumers return merchandise purchased online?

This year, damaged or defective items top the list of reasons for returned merchandise. Poor fit (75%) and the item not matching its description (56%) round out the top three. 

Most Consumers Have Returned Online Purchases
How often would you say you return products ordered online?
2021
Item is damaged or defective
65%
Item doesn’t fit
70%
Item doesn’t match description
49%
Don’t like the item(s)
32%
Ordered multiple items/sizes
13%
Item arrived late
10%
2023
Item is damaged or defective
81%
Item doesn’t fit
75%
Item doesn’t match description
56%
Don’t like the item(s)
33%
Ordered multiple items/sizes
14%
Item arrived late
11%

The good news? Collecting and displaying user-generated content can help you dramatically decrease returns due to poor fit and a product not meeting expectations. We’ll explore this in detail in the next section of this report. 

Chapter 7

How the Presence of UGC Impacts Return Likelihood

It’s impossible to completely eliminate returns. However, there is something brands and retailers can do to significantly cut down on them: provide shoppers with access to plenty of user-generated content. 

This year, questions and answers are the type of UGC with the biggest impact on return rates. Nearly three-quarters (72%) of consumers indicate they’d be less likely to return products if they were able to read Q&A from other consumers – or submit their own questions to be answered by the brand or retailer. 

In addition, 69% would be less likely to return products purchased online if they had the opportunity to access user-generated photos and videos of the product in action. And 66% say the ability to read ratings and reviews would decrease their likelihood of returning merchandise.

User-Generated Content Decreases Likelihood of Product Returns
Which forms of UGC would make you less likely to return products you buy online if you’ve viewed them prior to purchasing?
2021
Ratings and reviews
70%
Image and video
67%
Q&A
68%
2023
Ratings and reviews
66%
Image and video
69%
Q&A
72%

As was the case last year, younger consumers are especially impacted by the presence of user-generated content.

82% of Gen Z shoppers and 76% of Millenials say they’d be less likely to return products if they were able to first browse questions asked by other shoppers or submit their own via Q&A functionality on the product page. In comparison, 66% of Gen X’ers and 61% of Boomers said this was the case. 

Generational Comparison: Q&A Decreases Likelihood of Merchandise Returns
Are you less likely to return products you buy online if you have either read Q&As from other customers or submitted a question yourself prior to purchasing?
2021
Gen Z
74%
Millennials
72%
Gen X
64%
Boomers
59%
2023
Gen Z
82%
Millennials
76%
Gen X
66%
Boomers
61%

The youngest shoppers are also much more prone to indicate that consuming user-generated visual content prior to purchase decreases their likelihood of returning a product.

Generational Comparison: User-Generated Imagery Decreases Likelihood of Merchandise Returns
Are you less likely to return products you buy online if you’ve viewed images and/or video content from other customers prior to purchasing?
2021
Gen Z
82%
Millennials
73%
Gen X
61%
Boomers
51%
2023
Gen Z
80%
Millennials
75%
Gen X
62%
Boomers
52%

When it comes to ratings and reviews, three quarters of Gen Z’ers and 71% of Millennials indicate they’d be less likely to return products if they were able to view this feedback prior to purchase. 58% of Gen X’ers and 52% of Boomers say this is the case. 

Generational Comparison: Reviews Decrease the Likelihood of Returns
Are you less likely to return products you buy online if you’ve viewed ratings and reviews from other customers prior to purchasing?
2021
Gen Z
75%
Millennials
75%
Gen X
64%
Boomers
59%
2023
Gen Z
75%
Millennials
71%
Gen X
58%
Boomers
52%
Chapter 8

5 Key Takeaways for Keeping Product Returns at Bay

Product returns are an inevitable aggravation for brands and retailers – and a costly one. Yet, eliminating returns will cost you customers. Brands and retailers must find the right balance between meeting shoppers’ expectations – and preserving profits.

The following are five key takeaways from our latest survey

One
Return Policies Have the Power to Attract or Detract Customers

These days, consumers expect flexible – and ideally free – returns. Eight in ten (81%) say that free shipping is something they consider when making a purchase online. 

Offering a free, flexible return policy can be a big competitive advantage.

On the other hand, eliminating such policies will cost you customers. Over a third (39%) of consumers say that if a brand or retailer stopped offering free returns, they’d be very likely to stop buying from the business.

Two
Returns are More Common than Ever

Most consumers want the option to return products purchased online for free. And many exercise this option. A staggering 88% return items purchased online at least sometimes. 

Many brands and retailers worry that the influx in online shopping will lead to greater return rates. However, only 18% of consumers return products purchased online more often than those purchased in-store. About half (53%) return products at the same rate – whether they were purchased online or in-store. The remaining 29% return online purchases less often than in-store purchases.

Three
Consumers are Concerned about Sustainability – and Support Businesses Whose Values Align with Theirs

Sure, free returns are convenient to customers. But between increased landfill waste and carbon emissions, returns aren’t so great for the environment.

Consumers are taking note. Three-quarters indicate they’re at least somewhat concerned with the environmental impact of free returns – and 14% are very concerned.

Adopting more sustainable shipping and returns practices is better for the earth – and it gives you a competitive advantage. Almost all consumers say they’re at least a little inclined to shop with a company that has environmentally friendly return and shipping practices, and 40% are very inclined to do so.

Four
There are Many Reasons for Product Returns – But a Few Rise to the Top

Returns are a fact of life for brands and retailers. Understanding the key reasons for returns is critical to reducing their frequency. 

Consumers return products purchased online for any number of reasons. But there are a few that stand out. 81% of consumers have returned merchandise purchased online because it was damaged or defective. Here, there may be an opportunity to improve quality control and shipping practices.

The other top reasons for returns are a poor fit (75%) and the item not matching its description. When shopping online, it can be harder to access fit and other product qualities. The onus is on brands and retailers to provide tools that give shoppers a clear, accurate picture of what to expect from a product – and help them to choose the right size.

Five
User-Generated Content is the Antidote to Excessive Returns

User-generated content, including Q&A, ratings and reviews, and visual content, can be a powerful way to combat some of the top reasons for returns, including poor fit and inaccurate expectations.

72% of shoppers say they’d be less likely to return products purchased online if they could read questions from past customers and submit their own via Q&A. 69% indicate that the presence of user-generated photos and videos would decrease their likelihood of purchase, and 66% say that being able to read ratings and reviews prior to purchase would make them less likely to return the product in question.