
Month: May 2023
Why Build a UGC Scorecard?
When selling their products through a retailer, brands are essentially putting their items on a giant shelf and need to make sure they stand out.
Collecting and displaying user-generated content (UGC), such as ratings & reviews and imagery or video, from other customers is one of the most impactful ways to drive sales.
A scorecard ensures brands are making the most of their UGC strategy by giving them a benchmark to work towards.
- Determine which items to click on from landing pages and search engines (pages with reviews drive 88% of web traffic)
- Compare between options
- Make an informed purchase decision in-store or online
Criteria
Based on data- supported best practices for UGC
| Criteria | Metric (at least…) | Goal |
|---|---|---|
|
|
8 | 31+ |
|
|
4.0 | 4.75 |
|
|
75% | 100% |
|
|
3 | 13 |
|
|
1 | 7 |
Rationale
More is more when it comes to reviews. For retailers, we see a significant lift in conversion rates if you collect 31+. If you need assistance collecting more review content, reach out to learn more about Product Sampling and/or Receipt. Review. Collect.
Anything above 4.0 stars up to 4.99 stars sees a big impact on page traffic and conversion. The sweet spot is 4.75.
Consumers want to see reviews on all of your products but 75% is a good target that accounts for new items and those that have a slower purchase frequency.
Our survey found 80% of consumers find images from other customers to be more valuable than brand imagery and 99% of consumers look for visuals submitted by other users. We see a 114% lift in conversion when shoppers interact with visual UGC. Avg. # of visual media per product for Retailers is 7 and overall is 13.
We see a 114% lift in conversion when shoppers interact with visual UGC. Avg. # of visual media per product for Retailers is 7 and overall is 13.
Today, eight in ten consumers specifically seek out websites with product reviews. Just as many (80%) place a higher value on consumer-generated photos than those supplied by the brand or retailer.
It’s undeniable that user-generated content (UGC) makes a huge impact on conversions, website traffic, and customer trust for both brands and retailers. However, consistently generating fresh reviews requires slightly different strategies for brands vs. retailers.
For retailers specifically, there are some critical and proven best practices for getting started with UGC and reviews.
Initial Set-Up & Implementation
Getting off to a good start is crucial – regardless of who you partner with on your program or if you’re going alone.
When you onboard with PowerReviews, you will be assigned a dedicated account team who is with you every step of the way, from implementation to success planning (and beyond).
Once the technical piece is out of the way, your implementation team will hand you over to your dedicated Account Manager (AM)Customer Success Manager (CSM). These two folks will be your main point of contact moving forward. In addition to answering your day-to-day questions, they’ll catch you up on the latest best practices, and be in touch regularly with new research, insights, and ideas to optimize and generally focus on how to help your UGC program succeed. You will also be assigned a Technical Support Analyst (TSA) for any technical issues that should arise.
Beyond sharing best practices for your own websites, your AM and CSM will also offer guidance for empowering your brands to engage and build relationships with their customers, so they can send more review content your way.
Your AM and CSM are passionate about making your UGC strategy a success, so give them all the tools you can, including:
- Your goals for your review program
- Your best point of contact (email, phone, etc)
- The competitors you want to keep an eye on
- Top categories to focus on
- And more
Best practices for a winning UGC program
There are three pillars to any successful UGC strategy: collecting user-generated content, displaying it for maximum effect, and analyzing the performance for future improvement. We review best practices for each, below.
Collect More Content
For retailers, brand participation is a key component of a winning UGC strategy. Follow these tips to encourage your brands to collect more UGC and improve their presence on your website.
1. Send Post-Purchase Emails
Sending post-purchase emails still reigns supreme as the best method for review collection. Our research shows that these follow-up emails generate between 70% to 90% of total review volume.
Retailers can even synchronize in-store order data with PowerReviews to collect reviews for in-store purchases. This can make a major difference in your review collection efforts, especially for retailers where a large volume of sales are made in store, like grocery and pet supplies. In-person shoppers are more likely to make additional, unplanned purchases, so following up with these shoppers allows you to collect even more reviews!
Best of all, this collection method generates results fast. Prior to collecting in-store reviews, wholesale retailer BJ’s was averaging between 4,000 to 6,000 reviews per month. After just one month of implementing in-store reviews, their average monthly review numbers increased by 499%, reaching over 33,000 reviews and staying steadily in that range ever since.
2. Leverage UGC Syndication
With PowerReviews UGC Syndication for Retailers, your partner brands can push UGC content originally posted on their website onto your product pages. That means more UGC for you.
How do you get your brands to opt in? Let PowerReviews do the work. We’ll set up co-branded landing pages and targeted email sends that make it easy for your brand partners to inquire about participating in your UGC program.
To start the conversation with your brand partners, you need to prove out the value of both reviews on your site and your overall ecommerce program generally.
First, your brands need to be educated and bought in on the revenue your site can drive for them. Is it a valuable sales channel for them? If not, could/should it be? And what proof points can you provide to endorse this?
Second, highlight the incremental revenue impact of reviews on your site – ideally with data. Perhaps also outline how your search algorithm is impacted by reviews (i.e. more reviews = more traffic and better conversion). Essentially, you want to be able to prove how adding reviews to your site will result in tangible ROI for brands.
3. Encourage brands to respond to Q&A and reviews on your site
Empower your brand partners to interact and build relationships with customers via their product pages on your website. For example, they can answer questions left on your product pages and respond to specific reviews (At PowerReviews, our Brand Engage capability enables you to offer this capability).
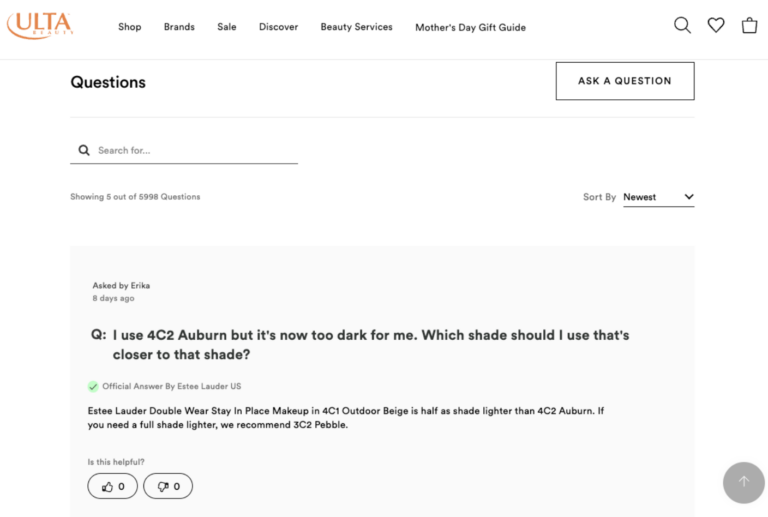
Fostering customer Q&A as a place where your customers can expect to receive answers to their questions is an essential UGC best practice. That’s because of all three types of UGC — ratings and reviews, image and video, and Q&A — Q&A has the largest impact on conversion. Specifically, there is a 103.1% lift in conversion among site visitors who click on “Ask a Question.”
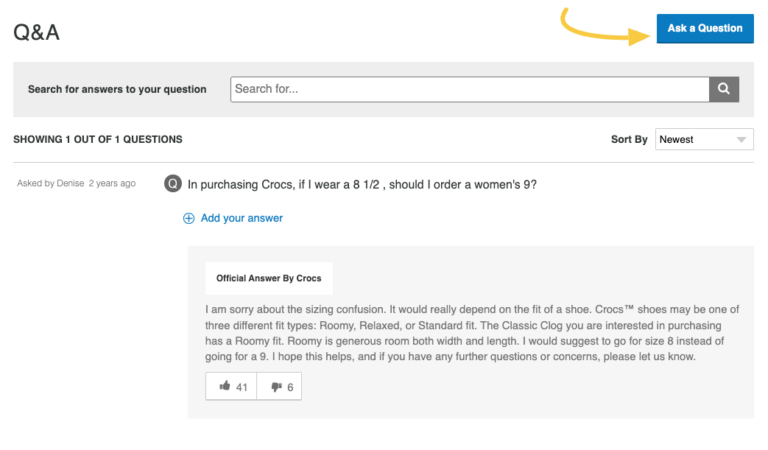
Not only does Brand Engage put the power in your brand’s hands, it also saves you, the retailer, time and resources. Best of all, it ensures your customers get their questions answered, eliminating uncertainty and easing their path to purchase.
Here’s an example from Ulta Beauty, where Estee Lauder representatives answer questions about a foundation.
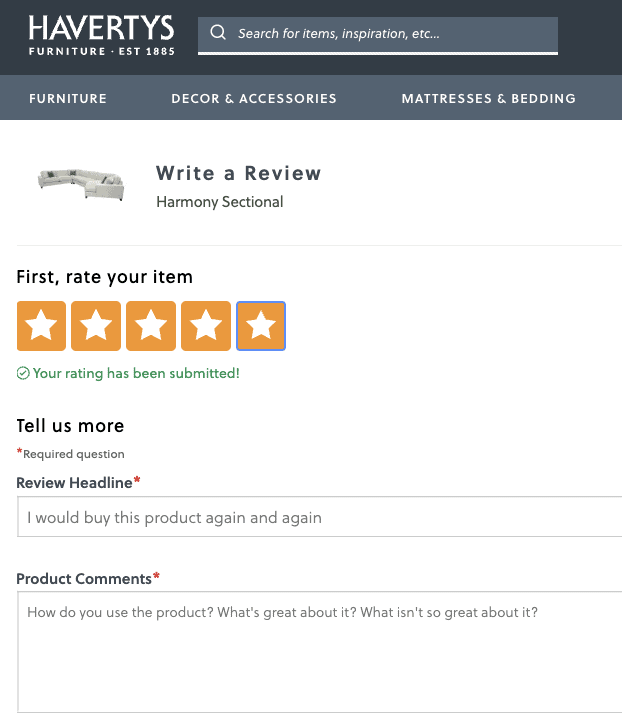
4. Allow Customers to Leave Ratings Only
While we know that detailed reviews are the holy grail of UGC, sometimes customers simply don’t have enough time to leave a full review and – from a pure revenue perspective – the raw review volume count and average rating have a bigger impact.
One option is to meet them where they are and let them leave a quick rating.
At a high level, we know average rating and review volumes are the #1 and #2 things shoppers notice.
At the end of the day, the most important thing to understand is what your customers value most. Not every ecommerce site is Amazon and consumers do typically adjust their expectations – and even preferences – accordingly.
Shopper trust is huge when it comes to reviews so your customers may end up preferring fewer reviews with more detail. The only way to know for sure is to analyze consumer behavior on your site.
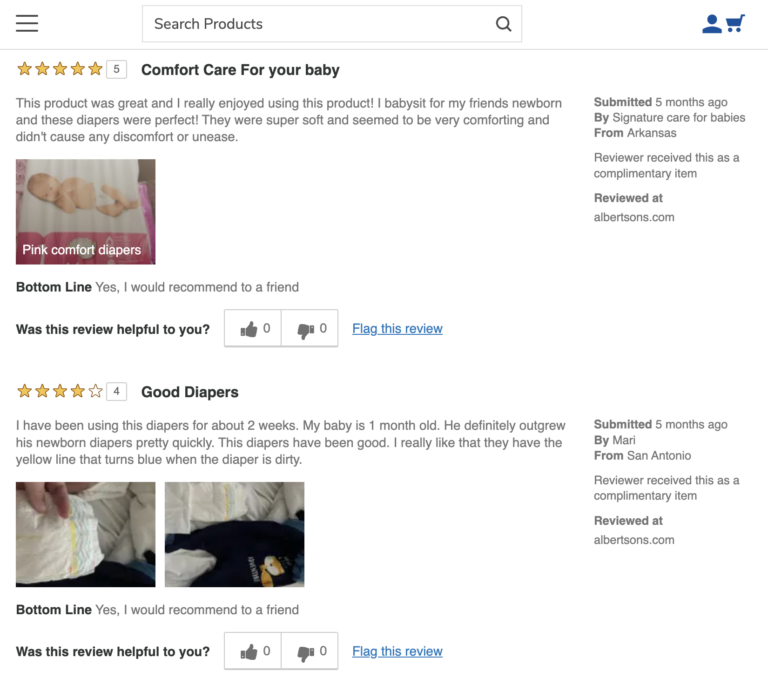
5. Accelerate Review Collection for Your Private Label Products
Syndication can do wonders for review volume for your partner brands. And follow up emails are a staple of any review collection strategy.
However, if you want to accelerate review collection, you’ll need another strategy. for your private label brands. Enter: product sampling.
PowerReviews sampling programs are a highly effective way to generate content for private label products to ensure they stand out on your website.
Here’s an example for Albertsons Private Label Diapers.
Display UGC for Maximum Impact
Now that you’re regularly bringing in fresh UGC, it’s time to make the most of it! Follow these UGC display best practices.
6. Curate UGC from Social Media
Shoppers aren’t only looking for written UGC. Many want to see visuals, too, with 94% of shoppers seeking out visual UGC at least sometimes — and 25% always seeking it out.
One of the easiest ways for retailers to generate visual UGC quickly and consistently is with social curation. Shoppers love sharing their latest finds on social media. With Social Curation, you can amplify their voice, and build out the UGC on your product pages.
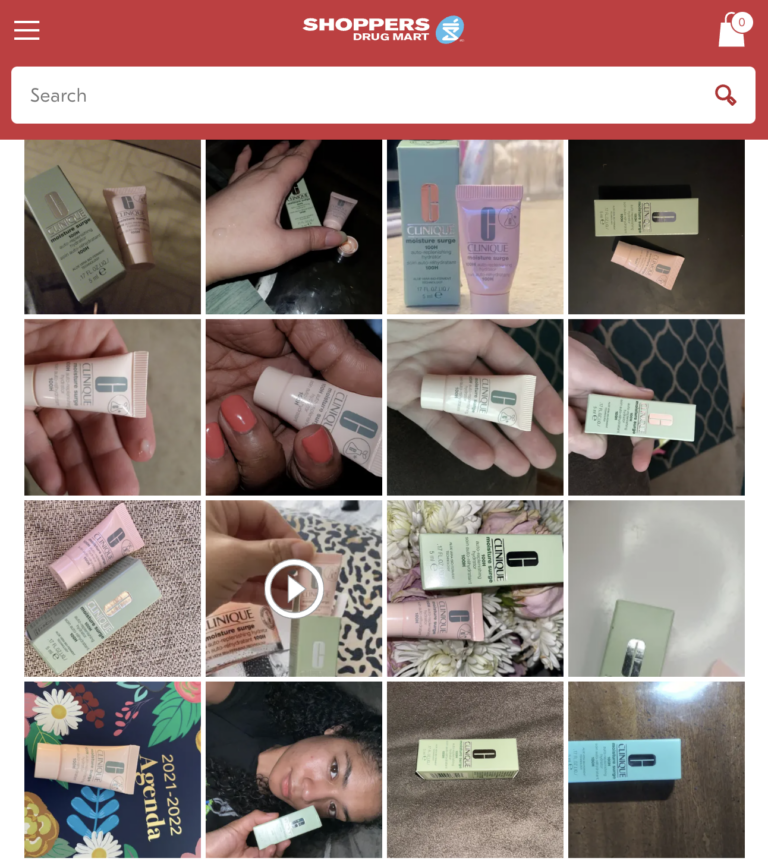
Work with your CSM to set up social curation on your product pages, home page, and elsewhere on your website. These campaigns are easy to set up using hashtags and other identifiers. With PowerReviews’ In Real Life (IRL) Gallery, a simple JavaScript snippet brings your Instagram UGC gallery wherever you want it on your website — with shoppable calls to action that link directly to the featured products.
7. Display a Brand Score for Products With 0 Reviews
Is a new product in need of reviews? No problem. PowerReviews’ Brand Score is a tool that allows you to show a cumulative score for a brand on product pages that don’t have any reviews yet.
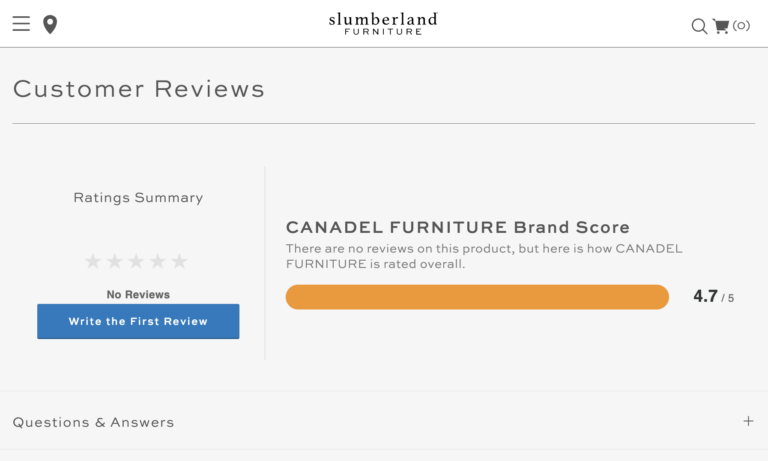
This offers shoppers more information about a brand generally, which may reduce their hesitation about purchasing this particular product.
Until the product gets a review, the page will show an average rating for products by that brand in the same category. (Psst… you can also enable this feature for your private label products.)
8.Create Review Displays That Convert
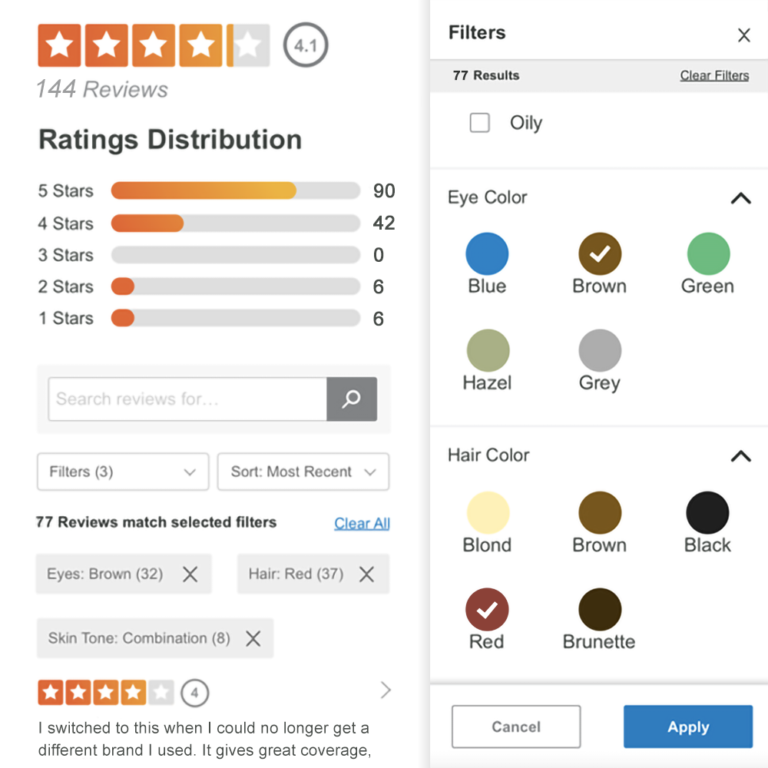
The ideal review display features a number of features that allow customers to find the UGC they seek, from review summaries and helpful votes to search and filter options.
While the conversion impact of any one of these features can vary from retailer to retailer, we’ve found the following to be the most impactful.
Search and filter options let users choose from a list of common filters, or type in a specific keyword to find reviews relevant to them. As you might expect, once shoppers hone in on the reviews most relevant to them, they’re more likely to make a purchase. We’ve found a 202.9% conversion lift among visitors who use the search feature (over general visitors to the same page). PowerReviews can work with you to customize the filter options for your products, as well as the look and feel of the review feature so it matches your brand.
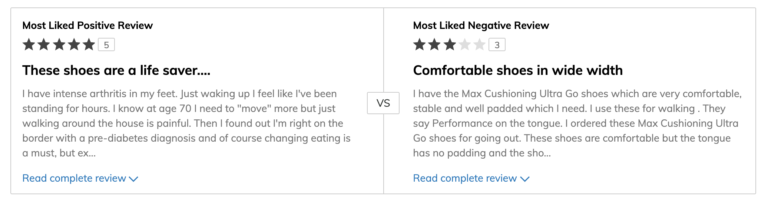
A review faceoff pits the Most Liked Positive Review against the Most Liked Negative Review at the top of your review display. This prominent position helps shoppers quickly identify the pros and cons of a product that have been most helpful for other shoppers to learn about. Our research shows there’s a 138.2% conversion lift for those who expand the positive review in the faceoff over general visitors to the same product page.
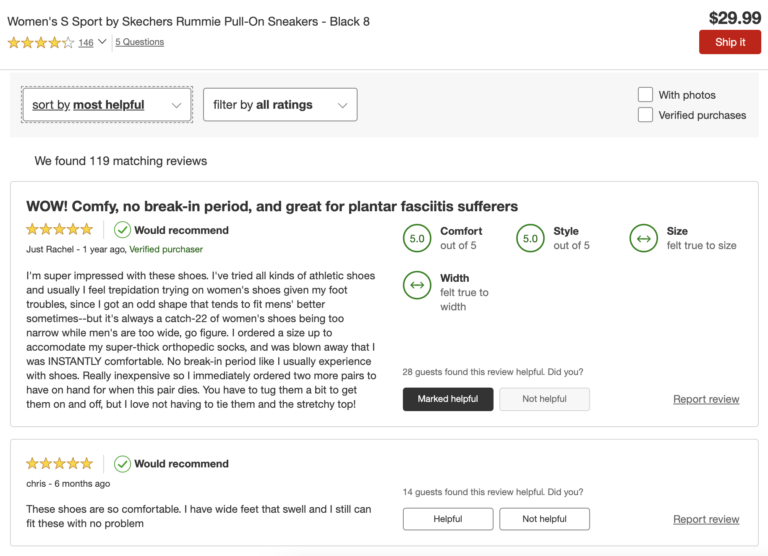
Adding “helpful” and “not helpful” voting buttons to your reviews invites shoppers to engage as they read through a product’s reviews. Interestingly, engaging with either button is associated with an increase in conversion rates: +314.7% for those who click “helpful,” and +182.4% for those who click “unhelpful.”
Our research has found these features to be generally helpful across industries, brands, and retailers. However, every retailer is different, and what works best for you may be different than your competitor (just take a look at our Inspiration Station!). That’s why PowerReviews continually analyzes what’s impacting purchases on your product pages. Based on the insights gathered from our analytics tools, we’ll provide suggestions to your team for ways to further optimize your review display and increase the value you’re getting from your UGC.
9. Load Reviews at Lightning Speed
The load speed of your product page can be the difference between making a sale and losing a customer forever.
That’s why PowerReviews built our displays to not only be the most flexible, but load faster than any other ratings and reviews vendor. We’re proud to say our code is the lightest around. Still, we encourage retailers to pay close attention to how their display affects load speed and identify additional opportunities to improve load speed on their product pages.
Analyze with world class tools
Regularly analyzing your UGC can help you see which review generation strategies are working. You can spot trends in your review collection. And, you can find low-hanging fruit, such as product pages missing reviews, visual UGC, or answers to Q&A.
10. Get a Bird’s-Eye View of Your UGC
At the highest level, you should be monitoring the headline data of your review program. For example, the average rating shoppers encounter when browsing your website, along with how many reviews and images each product has.
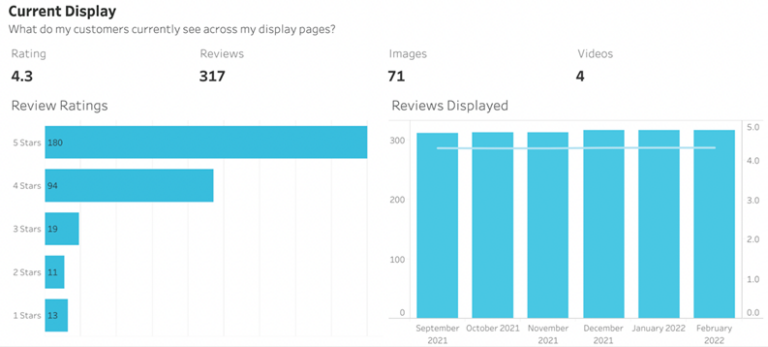
This information can help you understand where you stand in regards to industry benchmarks and consumer expectations. Generally, consumers tend to be suspicious of perfect 5-star ratings. They prefer average ratings around 4.5 stars. Focus your efforts on bringing lower-rated products above 4 stars.
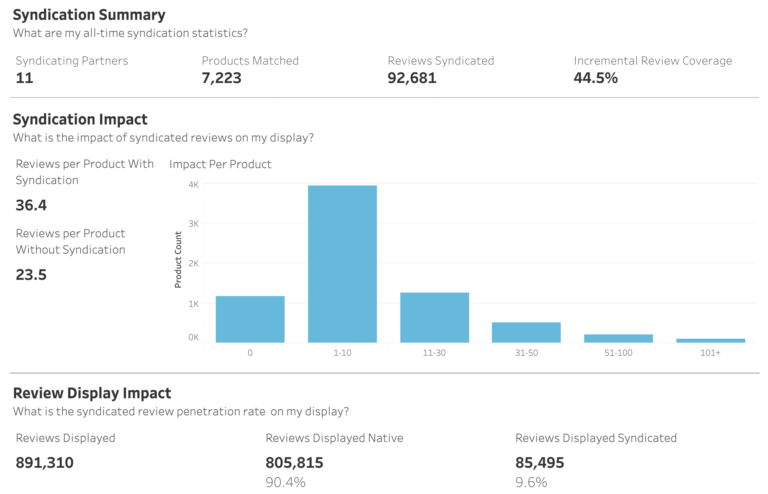
11. Review Your Syndication Analytics
Syndication analytics reveal everything you want to know about your review syndication efforts.
You can see how many brands are syndicating reviews to your website, and the total number of reviews you’ve generated through syndication. You can even compare how many more reviews syndication drives, on average, per product — a great selling point for brands you want to start syndicating to you.
12. Quickly Identify Products That Need a Boost
You can also analyze how your own review collection efforts are working, such as those you generate through post-purchase emails and sampling campaigns. In particular, these reports are extremely valuable for identifying high-opportunity products or categories that could be targeted for review collection.
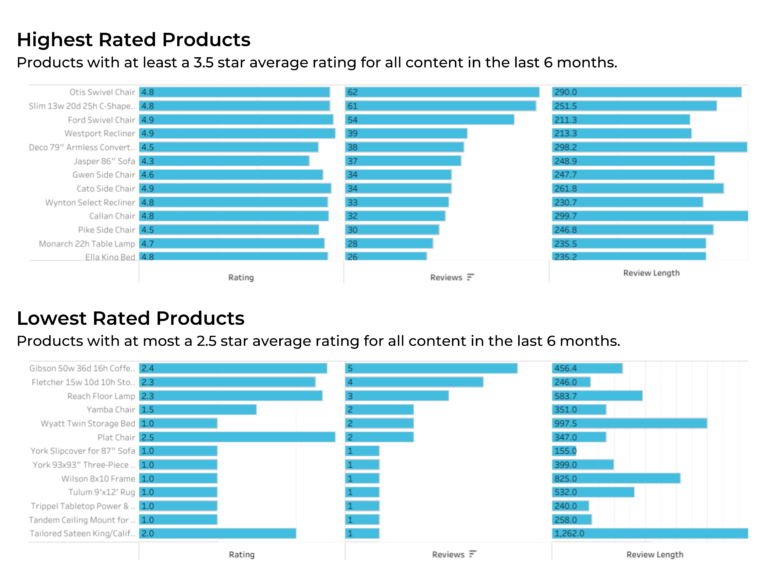
The sooner you can discover a product has low ratings, the sooner you can fix it by sharing feedback with the brand. Once they address the issue, spin up a sampling campaign to generate new reviews and bring up the star rating.
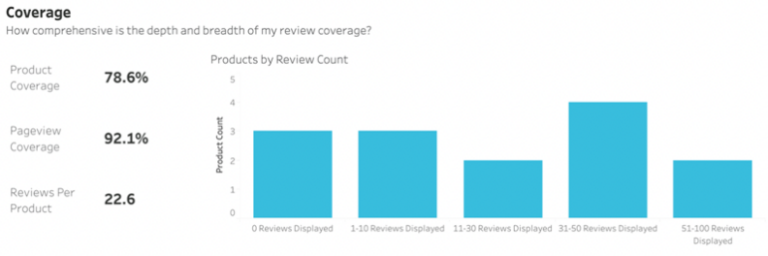
13. Find Products With 0 Reviews
Review coverage is very important to consumers, second only to star rating. In an ideal world, one in four customers say they would love to see more than 500 reviews for a product. And, the more reviews a product has, the better, as this chart clearly illustrates:
With the PowerReviews Coverage report, you can keep an eye on your review volume and quickly prioritize your UGC collection efforts, starting with the products that have 0 reviews first. Connect with your CSM for strategies on encouraging your brands to take ownership and drive more reviews your way.
14. Monitor All Review Content You Capture
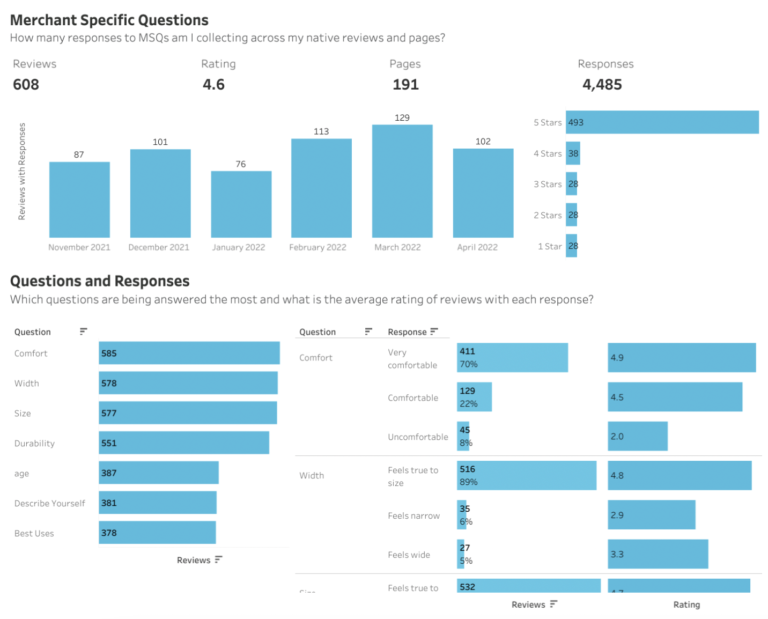
To make their reviews more helpful to customers, many brands and retailers opt to add optional questions to their review form, beyond the standard star rating and blank text box. At PowerReviews, we call these merchant specific questions (MSQs). MSQs can range from questions about size and fit to ideal use cases, pros and cons, and demographic information.
Analyzing how these perform can be super valuable to informing future collection efforts. As a retailer, you can both create your own MSQs, or bring in your brands’ MSQ via syndication.
The MSQ report shows the response and rating breakout for each question as well as a breakout by product, brand or category, revealing which questions resonate most with customers.
Ready to Dive In?
We know we’ve covered a lot, but don’t worry, your AM and CSM are here to help. Connect with them and let them know about any questions or ideas this guide may have sparked. We look forward to hearing from you!
Survey at a Glance:
The Ever-Growing Power of Reviews (2023 edition) is based on a survey of 8,153 U.S. consumers fielded in April 2023. Here’s a high level look at our key findings.
- 99.5% of shoppers research purchases online at least sometimes. Nearly 87% do so regularly or always.
- Amazon is the most common place to start the purchase journey. 50% of consumers search here first when shopping online.
- Aside from Amazon, shoppers turn to many other websites throughout the purchase journey, including Google, brand websites, and retailer websites.
- 77% of shoppers specifically seek out websites with ratings and reviews.
- The most popular places for consumers to read reviews are Amazon (94%), retail websites (91%), search engines (70%), and brand websites (68%).
- 74% of consumers say that ratings and reviews are a key way they learn about products they’ve never purchased before.
- Nine in 10 consumers say they consider reviews when making a purchase decision.
- Again this year, ratings and reviews are the most important factor impacting purchase decisions. 93% of shoppers say this content impacts whether or not they purchase a product.
- 99.75% of online shoppers read reviews at least sometimes; 91% do so always or regularly.
- 98% of shoppers say reviews are an essential resource when making purchase decisions.
- Nearly half (45%) of consumers won’t purchase a product if there are no reviews available for it.
- 78% of consumers say the more expensive the product, the more they read reviews.
- Nearly all (98%) of consumers are more likely to read reviews for a product they’ve never purchased before.
Methodology
There was a time when consumers did nearly all of their shopping within the four walls of a brick-and-mortar store. In those days, marketing tactics like TV commercials and magazine ads had a big influence on consumers’ purchase decisions. As such, brands and retailers invested heavily in those areas.
Those days are long gone.
Today, consumers spend a large (and growing) portion of their budgets online – a trend that accelerated at the onset of the pandemic. And when consumers do opt to shop online, they face nearly endless options across any product or service category.
Many brands and retailers continue to invest significantly in traditional marketing channels in an effort to reach shoppers. But these tactics don’t hold the power they once did.
Consumers are no longer content to be talked “at” by brands. It’s feedback from peers – rather than traditional marketing tactics – that impacts their behavior and decisions most.
Brands and retailers must adapt their strategies accordingly. But how?
The first step is to understand how modern consumers navigate the online shopping journey – and the tools and information they turn to when making purchase decisions.
Recently, we surveyed more than 9,000 consumers in the U.S. to understand:
- Where they’re shopping
- What factors influence them throughout the purchase journey
- The role ratings and reviews play every step of the way
In this report, we’ll share our key findings as well as recommendations for brands and retailers looking to optimize their acquisition strategies and increase ROI.
Who We Surveyed
This report is based on a survey of 8,153 US consumers, fielded in March 2023. Here’s a closer look at who we surveyed.
Generations
(1997-present)

(1981-1996)

(1965-1980)

(1946-1964)

Household Income
Average Overall Monthly Online Spend
Where Modern Consumers Browse & Buy Online
Ecommerce was already growing at a steady clip. The pandemic poured fuel on the fire.
Most Consumers Research Online
Today, the vast majority of consumers – 99.5% – turn to the internet at least sometimes to research purchases. Nearly 87% do so regularly or always.
Of note, younger shoppers tend to conduct online research before making a purchase more frequently than their older counterparts. 55.75% of Gen Z’ers always do so, compared to 34% of Boomers.
Amazon is a Common Starting Point
There are nearly endless options available to online shoppers. Where do they most commonly start the purchase journey?
Amazon tops the list, with half of consumers indicating it’s where they search first when shopping online. Next up is Google (31.5%), followed by brand or retailer websites (14%).
There are some notable differences based on generation. For example, Gen Z’ers are the group least likely to start their search on Amazon. On the other hand, these young shoppers are more likely than older shoppers to start their search on social media.
Consumers Turn to Many Websites Throughout the Purchase Journey
We know Amazon is the most common place to start a product search. But consumers aren’t solely using Amazon to research and purchase products.
Instead, they’re turning to many different websites to browse and buy. And oftentimes, they’re doing so quite frequently.
A couple of trends are clear. The first is that consumers leverage Google more frequently than any other channel. Also of note, younger shoppers use all four channels more often than older consumers.
Reviews Impact Where Consumers Shop
There’s no doubt many factors impact where consumers choose to shop online. But ratings and reviews are certainly high on the list.
This year, over three-quarters (77%) of shoppers specifically seek out websites with ratings and reviews.
Gen Z and Millennials are more likely to seek out websites with reviews than older generations.
Shoppers Read Reviews on Many Websites
We know consumers seek out websites with reviews. But what sites do they most commonly turn to?
Again this year, Amazon (94%) tops the list, followed by retail websites such as Target.com and Walmart.com (91%). Search engines (70%) and brand websites (68%) are also popular destinations for finding and consuming review content.
Key Factors Impacting Purchasing Behavior
In the best of times, consumers do plenty of research before making a purchase. That’s even more true in times of uncertainty.
Nearly three-quarters of consumers are researching purchases more than before due to the current economic climate. This number is even higher – 78% – among Gen Z shoppers.
We explore information sources shoppers look to when making purchase decisions but first let’s explore the critical factors – at a most basic level – that dictate whether consumers will buy a product or not.
Ratings and Reviews a Bigger Influence Than Price
Most strikingly of all, ratings and reviews again are considered by consumers to be more important than other key influences – including price, free shipping and free returns. Fast shipping and brand are considered less important than each of these factors.
How Consumers Research Products
When it comes to deeper research of products, our survey highlighted some key findings. Unsurprisingly, consumers are now more deeply scrutinizing purchases given overriding economic conditions.
With the continual rise of social media and influencer marketing, shoppers are not short on sources to seek information on products they’re considering buying. Again, ratings and reviews come in as the most important resource for consumer product research.
Consumers Weigh Many Factors
Consumers consider many factors when weighing purchase decisions. But customer ratings and reviews rise to the top. Nine in 10 consumers indicate this is something they consider when making purchase decisions.
Customer photos and videos and recommendations from friends and family are tied for second place. 73% of consumers consider each of these factors when making purchase decisions.
Now, let’s take a closer look at how some of these factors impact behavior throughout the purchase journey.
Customer Ratings and Reviews
Ratings and reviews have become the top factor impacting purchase decisions. In fact, consumers have come to rely on this content throughout the purchase journey.
For starters, ratings and reviews are the #1 tool for product discovery. Nearly three-quarters (74%) of consumers use this content to learn about new (or new to them) products.
In addition, ratings and reviews are the factor consumers trust the most. Nine in ten (91%) say they trust ratings and reviews when making purchase decisions.
In fact, 82% of consumers trust ratings and reviews as much as (or more than) they do recommendations from family members or friends. This number is even higher among Gen Z (88%) and Millennial (84%) shoppers.
However, it’s important to note that over half (56%) of consumers don’t trust star ratings alone as much as they do star ratings accompanied by written reviews. Clearly, consumers value and trust knowing the why behind the star rating.
When it comes to making a purchase decision, certain factors carry more weight than others. Again this year, ratings and reviews are the most important factor impacting purchase decisions. 93% of consumers indicate that this content impacts whether or not they decide to purchase a product. In fact, ratings and reviews even outweigh financial factors including product price (93%), free shipping (75%), and free returns or exchanges (63%)
User-Generated Photos and Videos
Brand- or retailer- provided ratings and reviews are important. But increasingly, it’s photos and videos from other consumers that impact shoppers’ behavior.
60% of consumers turn to user-generated imagery to learn about products they’ve never purchased before.
There’s tremendous value in seeing a product being used by a real person in real life. It’s no wonder why 77% of consumers trust user-generated imagery when making purchase decisions.
In fact, the presence (or absence) of user-generated visual content can make or break a sale. Over half (53%) of shoppers say that this content impacts whether or not they decide to purchase a product.
Word of Mouth
Word of mouth has always had a big impact on the purchase journey. That’s still the case. Today, 60% of consumers say that recommendations from their family and friends are a key way they learn about new (or new to them) products.
Furthermore, 79% indicate they trust personal recommendations. However, as mentioned earlier, many consumers trust ratings and reviews as much as – if not more so – than recommendations from family members and friends.
Finally, 59% say a personal recommendation impacts whether they decide to purchase the product in question.
Search Engine Results
As we explored earlier in this report, Google and other search engines are a common starting point for shoppers. It’s not surprising, then, that 63% of consumers use search engine results as a tool to learn about products they’ve never purchased before.
When making purchase decisions, half (50%) of consumers indicate they trust search results on Google or other search engines. One way to boost that trust is to display star ratings alongside search engine results – which is possible if your site is structured according to Schema.org standards.
The Impact of Site Search Results on Shopper Behavior
After landing on a brand or retailer site, many consumers use the site’s search box to identify products that fit their needs. Today, nearly half (47%) of consumers use search results on retail sites to learn about new (to them) products. Furthermore, 49% place their trust in the site’s search results.
We know consumers trust ratings and reviews – and their presence impacts purchase decisions. As such, consider adding star ratings and review counts to your site search results pages. This information will boost shoppers’ trust – and entice them to learn more.
Social Media
Consumers use social media to keep in touch with family and friends. But they also use these channels to discover products. Facebook is the most popular channel for product discovery, with 37% of consumers indicating they use it to learn about new products.
A good number of consumers place their trust in social media, with Facebook topping the list.
Traditional Marketing Channels Don’t Have the Pull They Once Did
In the past, brands and retailers invested most of their marketing dollars in traditional channels like TV commercials and celebrity and influencer endorsements. But today, these channels don’t have the impact they once did.
In addition, few consumers place their trust in these traditional tactics when it comes to making a purchase decision.
To state the obvious, it’s important to invest in marketing the strategies that’ll have the biggest impact. And it’s clear that shoppers value the authenticity of content created by “real-life” users, with trust in this much higher than more obviously brand-curated materials.
That doesn’t mean you should abandon traditional marketing tactics altogether. For one, these techniques serve a different purpose providing value at different stages of the buying journey or funnel.
Given the popularity of user-generated content, however, consider incorporating user-generated content – including ratings, reviews, photos, and video – into your other marketing programs, including email marketing, social media ads, and even print ads. This content can increase shoppers’ trust – and drive more impactful product discovery.
Reliance on Reviews
We know reviews are a top purchase consideration. Now, let’s take a closer look at how consumers have come to depend on this content.
Nearly All Online Shoppers Read Reviews
Today, just about all (99.75%) of online shoppers read reviews at least sometimes. 91% do so always or regularly.
Notably, younger consumers tend to read reviews more frequently than their older counterparts.
What’s also interesting is that consumers with the lowest household incomes are the most likely to say they always read reviews. This is likely because these folks have less disposable income – and thus do more pre-purchase research to ensure they’re making smart purchase decisions.
Reviews are Essential
Reviews aren’t just important for consumers. They’re essential. Nearly all (98%) shoppers indicate they’re an essential resource when making purchase decisions.
Consumers of all ages feel reviews are essential. However, younger consumers are more likely to strongly agree with this sentiment.
A Lack of Reviews Deters Shoppers
It’s clear consumers place a lot of weight on ratings and reviews. In addition, we know that the very presence of reviews increases shopper confidence – and conversion. A recent analysis found that there’s a 108.6% lift in conversion when shoppers interact with ratings and reviews.
But what happens if a shopper looks for reviews and comes up short? Nearly half (45%) simply won’t purchase a product if there are no ratings and reviews available for it. This number is even higher among Gen Z (58%) and Millennial (48%) shoppers.
The bottom line? Brands and retailers can’t afford not to display ratings and reviews.
When Reviews Matter Most
Consumers turn to reviews when shopping for just about anything. But there are certain circumstances when this content is especially important.
Reviews are Important for High-Priced Items
There’s a level of risk associated with purchasing a product sight unseen. As the price increases, so too does the risk.
So, it’s probably not surprising that 78% of consumers say that the more expensive the product, the more they read reviews. This number is even higher among Gen Z (83%) and Millennial (82%) shoppers.
And, as was the case last year, those with higher household incomes are more likely to say they read more reviews for expensive products. A likely explanation is that those with higher incomes are more likely to purchase higher priced products.
Reviews are Important for Unknown Products
A shopper is unlikely to consult reviews when purchasing tried and true products – such as their go-to shampoo or cereal. But when considering a new (or new to them) product, reviews are essential.
Nearly all (98%) of consumers indicate they’re more likely to read reviews for a product they’ve never purchased before. In fact, shoppers across all generations and income brackets are significantly more likely to consult reviews when considering a new product.
A Solid Brand Reputation Boosts Shoppers’ Trust in Products Without Reviews
Ultimately, the goal is to generate reviews across all products in your catalog. However, your brand’s overall reputation can boost shoppers’ trust in the absence of reviews for a specific product. 63% of consumers are more likely to purchase a product without reviews if other products manufactured by the same brand have a high overall rating.
5 Key Takeaways
Consumers have nearly endless options. In order to compete, brands and retailers must first have a clear understanding of what those consumers expect throughout the purchase journey – and how different factors impact their behavior.
Read on for five key takeaways from our latest survey.
Modern consumers trust feedback from their peers over anything else, with reviews regarded as (marginally) more important than price when making purchase decisions.
Similarly, 82% of consumers trust ratings and reviews as much as or more than recommendations from family members or friends.
Brands and retailers must work to preserve these high levels of trust shoppers clearly have in review content. It’s therefore essential to have a moderation process in place that filters out fake or fraudulent content. But never filter out content solely based on the star rating. Negative reviews help shoppers make informed purchase decisions and bolster trust.
In addition, over half (56%) of shoppers don’t feel a star rating alone is as trustworthy as a star rating with an accompanying review. As such, make written commentary a required field in your write-a-review form.
By now, the vast majority of consumers browse and buy online. 99.5% of shoppers research purchases online at least sometimes, and 87% regularly or always do so.
The presence (or absence) of reviews impacts where they choose to shop online. Over three-quarters (77%) specifically seek out websites with ratings and reviews and nearly all (99.5%) read reviews.
It’s essential to collect and display ratings and reviews across your entire product catalog. Doing so is key to attracting shoppers early in the purchase journey.
Today, a staggering 98% of consumers say reviews are an essential resource when making purchase decisions. Ratings and reviews guide shoppers – whether they’re just starting to learn about products or getting ready to make a purchase decision.
Nearly three-quarters (74%) use ratings and reviews to learn about products they’ve never purchased before. And 93% say this content impacts whether or not they purchase a product.
Collecting and displaying reviews is an important way to connect with shoppers, wherever they may be on the purchase journey.
Consumers rely on reviews across myriad product and service categories. However, there are times when reviews are especially important.
One such circumstance is when a shopper is considering a higher priced item. 78% of shoppers say they read more reviews for more expensive items.
In addition, reviews are particularly important when a consumer is considering a new (or new to them) brand or product. 98% of shoppers are more likely to read reviews for a product they’ve never bought before.
The ultimate goal is to generate a high volume of reviews for products across your entire catalog. However, it’s especially important to focus on generating reviews for your higher priced and newer product offerings. The presence of this content will help shoppers overcome the risk involved with purchasing a higher priced or unknown product.
One thing is clear: ratings and reviews have the power to influence behavior throughout the purchase journey. If you’re like most brands and retailers, you understand this and have been collecting and displaying ratings and reviews for some time.
But developing a ratings and reviews strategy shouldn’t be a one-time event. Instead, be sure to measure the performance of your ratings and reviews program to identify areas for improvement. By making data-based optimizations, you can meet shoppers’ expectations – and start seeing a larger impact from your review collection and display efforts.
Consumers across all generations turn to reviews to make informed purchase decisions. Baby Boomers (those born between 1946 and 1964) are no exception. Because Boomers hold a large portion of the disposable income in the US, brands and retailers can’t afford to ignore their unique needs and preferences.
Here’s an overview of how Boomers engage with reviews and how this content impacts their purchase behavior, with data points curated from our own consumer research conducted over the past two years.
Boomers Rely on Ratings and Reviews
Boomers read reviews when shopping online, in-store, or some combination of the two. Brands and retailers looking to connect with Boomers must make it a priority to collect and display plenty of this content.
Boomers Go Beyond Star Ratings
A product’s star rating provides a great overview of how shoppers feel about a product. But Boomers want to dig deeper to understand the reasons behind the ratings.
Review Volume and Recency Matter to Boomers
There are myriad factors Boomers consider when reading ratings and reviews. But recency and volume are particularly important.
Boomers Value User-Generated Visual Content
Brand-provided photos and videos have a role to play. But a growing portion of Boomers specifically seek out imagery provided by fellow shoppers. The presence of this content can positively impacts conversion among Boomers.
Boomers are Concerned with Review Authenticity
Consumers value reviews because of their authenticity. But fraudulent content is a growing concern among Boomers.
Negative Reviews are Valuable to Boomers
Negative reviews are never the goal. But Boomers seek out this content – and its presence helps them make more informed purchase decisions. What’s more, displaying negative reviews bolsters trust.
Reviews Reduce Return Rates Among Boomers
Boomers frequently return products they’ve purchased online. But if they can read ratings and reviews prior to purchase, it can significantly decrease their likelihood of doing so.
Boomers are Review Writers, Too
Many Boomers are willing to share their feedback by writing reviews. While they have many motivations for doing so, a great experience tops the list.

Are You Meeting Boomers’ Expectations?
Boomers depend on reviews to make good purchase decisions. But they engage with reviews in ways that differ from other generations. Brands and retailers looking to attract and convert Boomers must understand their expectations – and then work to meet (and exceed) them.
Category Benchmarks
Wondering how your UGC program stacks up? Here are benchmarks for the Auto category:
Methodology: Analysis of lifetime Ratings and Reviews submitted across 25.4MM+ online product pages on 3,600+ brand and retailer sites as of March 6, 2023
Best Practices
Not quite there yet? Check out some of our best practices to learn about how you can level up your UGC program.