Despite Increasing Importance to Consumers, Average Media Coverage for Most Brands Hovers Around 37%

Key Findings:

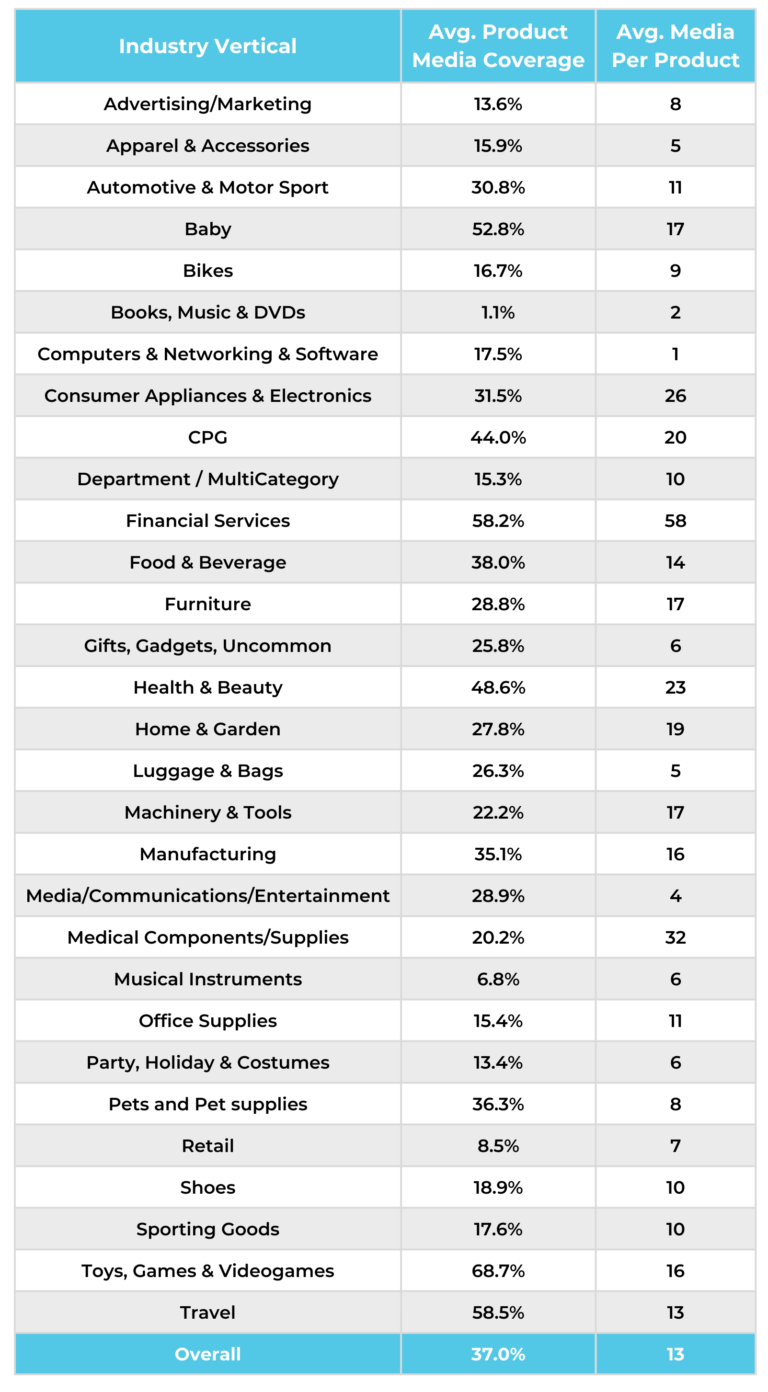
  • Across verticals, products had 12.8 images and/or videos, on average.

  • The verticals with the most media coverage overall were Toys, Games & Video games; Travel; Financial Services*; and Baby.

  • The verticals with the most media per product included Financial Services*; Medical Components/Supplies; Consumer Appliances & Electronics; and Health & Beauty.
Methodology: Analysis of lifetime Ratings and Reviews submitted across 25.4MM+ online product pages on 3,600+ brand and retailer sites (Qualifier: Activity had to be recorded on the page in the previous 12 month period prior to March 7, 2022). Average rating recorded is the average rating at time of data extraction on March 7, 2022.

99% of consumers look for photos and videos submitted from other customers at least sometimes; 77% do so always or regularly. Visual UGC is especially important to younger consumers, with 91% of Gen Z’ers and 84% of Millennials always or regularly seeking it out. Given the high value consumers place on visual UGC, we analyzed media coverage (percentage of products with at least one user-submitted image or video displayed) and average volume of media per product in a given vertical.

The verticals with the most media coverage overall were Toys, Games & Videogames (68.7%), Travel (58.5%), Financial Services (58.2%), and Baby (52.8%). The verticals with the highest average media per product included Financial Services (58.1), Medical Components/Supplies (31.9), Consumer Appliances & Electronics (26.3), and Health & Beauty (23.3).

Across verticals, there is an average of 12.8 images and/or video per product. The average overall media coverage was 37.0%.

From Marketing Validation to Conversion Booster: The Rise of Visual UGC

User-generated visual content has become increasingly important to consumers. Today, 80% of consumers say photos from other customers are more valuable than those provided by brands or retailers. Five years ago, only 44% felt this way.

Visual UGC is not only important to consumers; it increases their likelihood of conversion. More than half of consumers say imagery provided by previous purchasers is a top factor influencing their purchase decision. When people interact with visual UGC, the conversion rate nearly doubles from 3.4% to 6.6% (an increase of 91.4%). For some verticals, such as Apparel and Home & Garden, the conversion lift is even higher — at 119.1% and 149.9%, respectively.

By the same token, a lack of visual UGC can deter purchases. A third of Gen Z shoppers and nearly a quarter (21%) of Millennials won’t purchase a product if there is no visual content from people who previously bought it. Visual media is so important to consumers that 65% of shoppers rate images as the most valuable part of any individual review, even above the review length, title, and aggregated pros and cons lists. 

Visual media has a powerful impact on conversions because it provides context beyond the typical ecommerce product photo carousel. Consumers can see how a shirt looks on the body of someone who isn’t a model, maybe even someone who has a body just like them. They can see how the color looks in different types of lighting. Visual UGC also invites shoppers to visualize using the product in real life. They can see other customers using your milk frother, styling your accessories, or building your desk furniture.

Five Snackable Data-Backed Visual UGC Collection Tips

  1. Incentivize shoppers to provide photo and video: A large swatch of consumers — as many as 85% — need to be incentivized to leave a review. Make it worth their while. Run a product sampling campaign, host a review sweepstakes, or make visual UGC a point-earning activity in your rewards program.

  2. Mine social media for visual UGC: There’s no need to reinvent the wheel. If shoppers have already posted about your products on social media, repost their content to your site, too. Using this strategy, PowerReviews customer Shure Incorporated was able to quickly collect over 1,200 images.

  3. Syndicate images to retailer partners: This can not only help lift conversion rates on partner websites, but can also encourage those customers who you don’t have a direct line of contact with (e.g. email) to add media content to their review. When people see others doing something, they’ll often follow in their footsteps.

  4. Include filters so customers can easily find images and video: Over three-quarters (77%) of shoppers find filtering options useful when browsing review content. The number is even higher among younger consumers. In addition to filters for star rating or “helpful” votes, include one for whether the review includes visual content. 

  5. Make it easy to submit visual UGC: Be clear about what’s required for an upload to be accepted (file format, size, etc.). Ensure your review form and media upload form is mobile-friendly, so customers can upload it on the fly. Allow people to link to photos from Facebook or Instagram as well, increasing the social proof factor. 

*Financial services organizations tend to have an atypical use case for ratings and reviews (e.g. rating of credit card or call center interactions). Specifically, they tend to generate high volumes of reviews on a limited number of products, hence the high volumes of visual media evident here.

More Benchmarks

UGC Benchmarks: Review Influence on Online Traffic to Product Pages

More Reviews and Stronger Average Ratings Increase Product Page Visits

Read More →

Visual UGC Benchmarks: Av. Interactor and Impression Conversion Lift

Modest conversion lift for Visual UGC impressions; but Visual UGC Interactions more than double conversion

Read More →

Q&A: Av. Interactor and Impression Conversion Lift

A Q&A Impression Lifts Conversion by 51%, While a Q&A Interaction Lift Conversion 138%

Read More →
SEO Lamp Search Results with star ratings on PLAs

Ratings & Reviews: Av. Interactor and Impression Conversion Lift

Simply Seeing Reviews Lifts Conversion by 20%, While Interacting With Reviews Lifts Conversion by 128%

Read More →
The Average Review Is Only 218 Characters Long, Far Below the Consumer-Preferred 500+ Minimum

Key Findings:

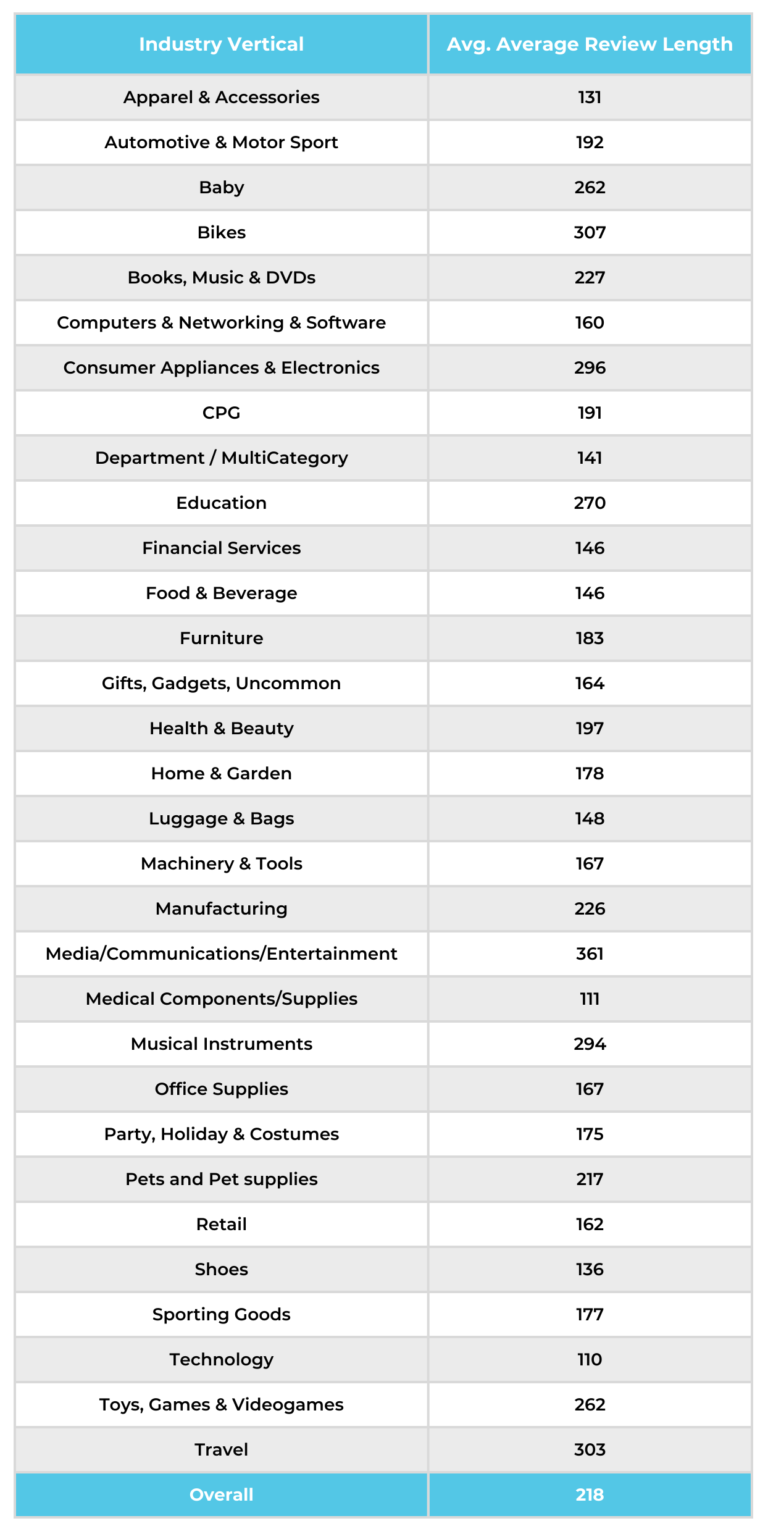
  • Across verticals, the average review is 218 characters long.

  • The verticals with the longest reviews included Media/Communications/Entertainment; Bikes; and Travel. 

  • The verticals with the shortest reviews included Technology; Medical Components/Supplies; and Apparel & Accessories.

Methodology: Analysis of lifetime Ratings and Reviews submitted across 25.4MM+ online product pages on 3,600+ brand and retailer sites (Qualifier: Activity had to be recorded on the page in the previous 12 month period prior to March 7, 2022). Review length aggregates correct at time of data extraction on March 7, 2022.

Review length is an important consideration for consumers, with 68% of consumers always or regularly seeking out longer, more detailed reviews, with nearly all – 97% – doing so on at least an occasional basis. 

88% of consumers regularly or always look beyond the basic summary to read the actual review content. This behavior is even more common among big spenders. 62% of shoppers who spend $2,001+ per month always go beyond basic review information to read the content of reviews, compared to only 41% of those who spend $1-$250 per month.

In our analysis, reviews are 218 characters long, on average. The verticals with the longest reviews included Media/Communications/Entertainment (361 characters), Bikes (307 characters), and Travel (303 characters). The verticals with the shortest reviews included Technology (110 characters), Medical Components/Supplies (111 characters), and Apparel & Accessories (131 characters).

We analyzed review length because longer reviews are not only highly valued by consumers, but they generate more conversions for brands and retailers. How long is long enough?

Reviews of 500+ Characters Drive Largest Conversion Lift & SEO Benefits

Our research shows that reviews of 500 characters or more have the largest impact on conversion rate. Given the averages identified, this should be regarded as a “stretch goal” However, reviews of this length are more than 2 times more likely to be rated as helpful by consumers (people who sort by “Most Helpful Reviews” have the highest conversion rate lift).

Conversion Rate of Visitors that Engaged with Each Feature
Highest Rating
157.8%
Lowest Rating
105%
Images
167.3%
"Most Helpful" Reviews
192.1%
Most Recent Reviews
80.9%
Oldest Reviews
107.3%

Consumers prefer longer reviews because they provide richer detail and more relevant information. They help buyers make more informed decisions, and weigh whether the writer of a review has a use case similar to them. They’re also more likely to contain emotional content about a product that can sway a reader to purchase. 

Longer reviews provide additional SEO benefit to brands. Longer reviews are more likely to contain more descriptive content about a product, including more keywords, which can positively contribute to SEO rankings.

Even the highest average in our analysis – 361 characters – still falls far short of the 500+ character stretch goal. There is a clear and significant opportunity for brands to improve their review content and collect longer reviews.

Five Snackable Data-Backed Review Length Tips

  1. Add a character counter to your review form: These track the length of the review and encourage reviewers to keep writing with positive phrases like “Keep going!” and a green progress bar. Customers can still submit a shorter review if they want, but adding some interactivity to the review form can encourage them to leave longer, more helpful reviews.

  2. Optimize your review submission form for longer content: Expand your form beyond the standard text box and star rating. Add clickable pros and cons, use cases, and more for people to choose from. These prevent review writer’s block by giving the reviewer ideas of what they can write about in the text box later on, while also providing more information for you to include in your review display. PowerReviews customer Room and Board provides a great example.

  3. Reward longer reviews: If you have an existing loyalty or rewards program, give your customers more loyalty points when they write longer reviews vs. simply leaving a star rating or a shorter review. As they accumulate more points, they can receive an award like an exclusive discount or gift.

  4. Let customers know that longer reviews are more helpful: 67% of consumers say that “helping and guiding others” motivates them to leave a review, while 65% are motivated by a “desire to help the brand improve the product.” Explain that the more they can share will not only help others make better, more informed purchases, but can also provide valuable feedback to you as the brand behind the product.

  5. Run a product sampling campaign: Send free samples to your customers and ask them to leave a review. Our research shows that product sampling campaigns – when done right – generate reviews that are 29% longer on average. When PowerReviews customer Vornado ran a sampling campaign, they enjoyed even more success, with 44% longer reviews. Reviews submitted through the campaign had 608 characters on average.
  6.  
  7.  

More Benchmarks

UGC Benchmarks: Review Influence on Online Traffic to Product Pages

More Reviews and Stronger Average Ratings Increase Product Page Visits

Read More →

Visual UGC Benchmarks: Av. Interactor and Impression Conversion Lift

Modest conversion lift for Visual UGC impressions; but Visual UGC Interactions more than double conversion

Read More →

Q&A: Av. Interactor and Impression Conversion Lift

A Q&A Impression Lifts Conversion by 51%, While a Q&A Interaction Lift Conversion 138%

Read More →
SEO Lamp Search Results with star ratings on PLAs

Ratings & Reviews: Av. Interactor and Impression Conversion Lift

Simply Seeing Reviews Lifts Conversion by 20%, While Interacting With Reviews Lifts Conversion by 128%

Read More →
The Average Product Boasts 402 Reviews, But This Is Still Lower Than Consumer Expectations

Key Findings:

  • Overall review coverage across verticals is 80.9%, with 402.1 reviews per product, on average. 

  • The verticals with the highest overall review coverage included Financial Services; CPG; and Health & Beauty.

  • The verticals with the lowest overall review coverage included Party, Holiday & Costumes; Retail; and Machinery & Tools.

Methodology: Analysis of lifetime Ratings and Reviews submitted across 25.4MM+ online product pages on 3,600+ brand and retailer sites (Qualifier: Activity had to be recorded on the page in the previous 12 month period prior to March 7, 2022). Review coverage data correct at time of data extraction on March 7, 2022.

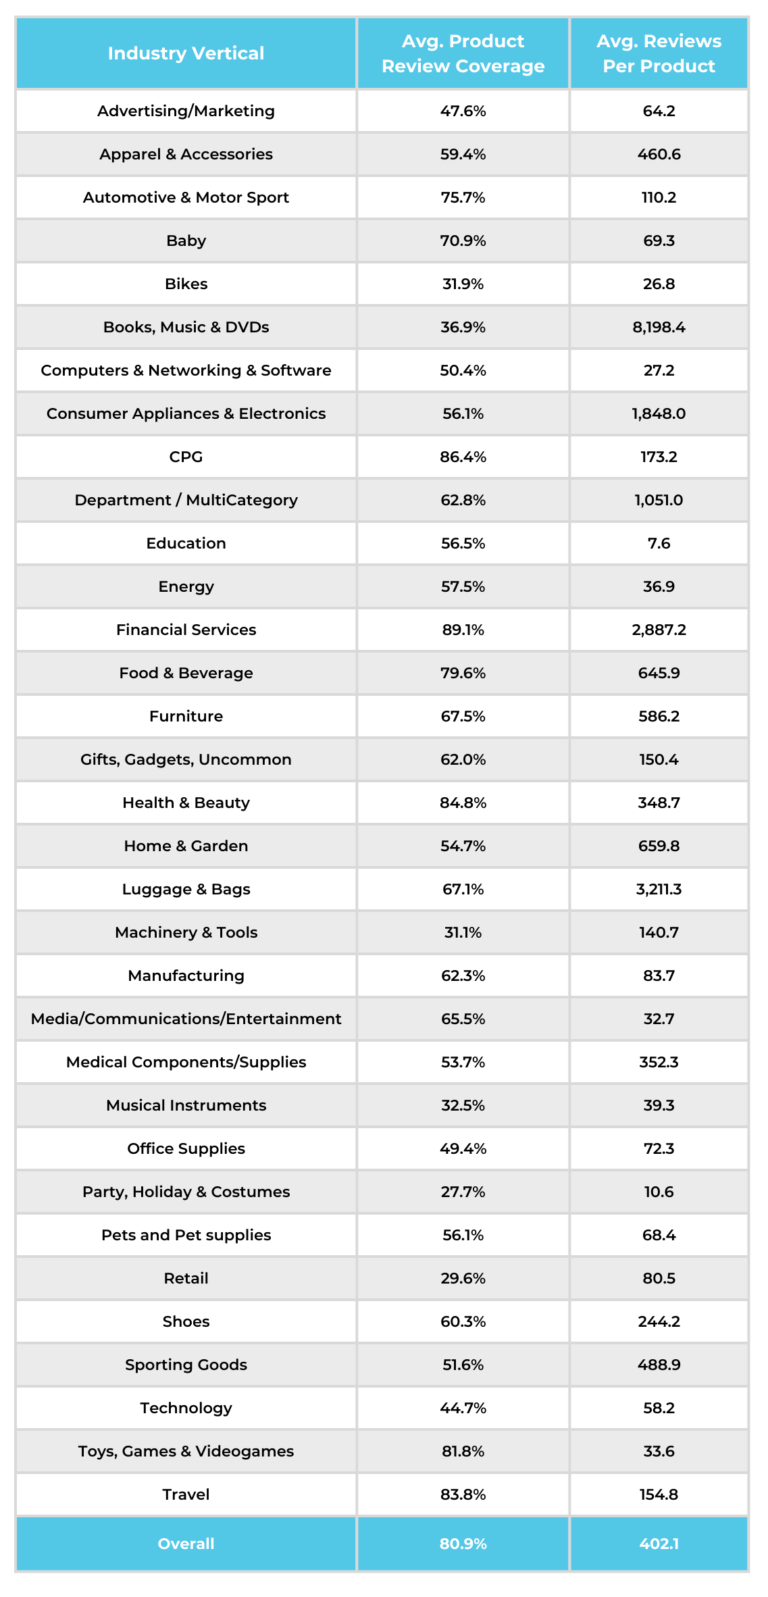
To benchmark review volume, we analyzed overall review coverage (how many products have at least 1 review) and review coverage per product (the average number of reviews per product). The average review coverage across verticals is 80.9%, with 402.1 reviews, on average, for each product.

The three verticals with the highest overall review coverage included Financial Services (89.1%), CPG (86.4%), and Health & Beauty (84.8%). Those with the lowest overall review coverage included Party, Holiday & Costumes (27.7%), Retail (29.6%), and Machinery & Tools (31.1%). 

On a per-product basis, Books, Music & DVDs shined with 8,198.4 reviews per product, on average, followed by Luggage & Bags (3,211.3 reviews per product) and Financial Services (2,887.2 reviews per product). The verticals with the lowest review coverage per product included Education (7.6 reviews per product), Party, Holiday & Costumes (10.6 reviews per product), and Bikes (26.8 reviews per product).

Financial services stands out as a “top performer” but this does come with a caveat: specifically, the financial services use case for a reviews platform tends to be unique (here are some examples). While every deployment is different, typically these organizations tend to collect reviews on fewer products overall – which goes some way to explaining the results here.

While the idea of having 1,000+ reviews per product may sound astronomical, the winners here are not exceeding consumer expectations; rather, they are meeting them.

The Importance of Review Coverage: Consumers Expect High Review Volumes

Review coverage is one of the top factors shoppers consider when reading reviews, second only to star rating. 79% of consumers “always” or “regularly” consider review volume. In late 2021, we surveyed more than 9,000 consumers about their expectations for review coverage. One in four consumers told us that ideally, a product would have more than 500 reviews. In this Benchmark Report, fewer than one-quarter (23%) of the verticals meet this expectation. 

Increasing review coverage is not just about meeting consumer expectations, it also drives tangible benefits for brands: review coverage has an exponential impact on purchasing behavior. 64% of consumers say that they are more likely to buy a product with 1,000 reviews than one that has only 100, assuming they have the same average star rating. This number is even higher among Gen Z shoppers (80%) and Millennials (74%). 

When a product goes from 0 reviews to 1, the conversion rate increases by 52.2%. Collect 51 to 100 reviews, and the conversion rate is 148.7% higher. When you start collecting reviews in the thousands, the conversion rate keeps increasing — illustrating that when it comes to reviews, more is always better. For example, there’s a 296.2% lift in conversion among shoppers who are exposed to 5,000 or more reviews.

Conversion Lift Relative to Number of Reviews Displayed
0 Reviews Displayed
0%
1-100 Reviews Displayed
76.7%
101-250 Reviews Displayed
143.2%
251-500 Reviews Displayed
166.4%
501-1000 Reviews Displayed
172.1%
1001-5000 Reviews Displayed
224.7%
5000+ Reviews Displayed
292.6%

It is easy to understand why a product with 0 reviews has a lower conversion rate. If we change the baseline to 1 to 100 reviews, however, we still see an incredible conversion lift when products begin accumulating over 1,000 reviews. For example, products with 1,001 to 5,000 reviews convert at a rate 83.7% higher than those with 1 to 100 reviews. Reach 5,000 reviews, and the conversion rate increases by 122.1%!

Conversion Lift Relative to Number of Reviews Displayed
1-100 Reviews Displayed
0%
101-250 Reviews Displayed
37.6%
251-500 Reviews Displayed
50.7%
501-1000 Reviews Displayed
54%
1001-5000 Reviews Displayed
83.7%
5000+ Reviews Displayed
122.1%

Review coverage is especially important when customers are purchasing new products or brands, according to 71% of consumers

Consumers consider review coverage to be particularly important for certain verticals, including Consumer Appliances & Electronics, Health & Beauty; Apparel & Accessories; Furniture; and Pet Supplies. However, no matter your vertical, the message is clear: more reviews are always better. The journey to 1,000 reviews starts with these five tips.

Five Snackable Data-Backed Review Volume Tips

  1. Follow up with every customer to leave a review: Our research shows that nearly 80% of all review content comes from an email request. Send an email to every verified purchaser asking them to review their purchase. Follow up after 7 days for seasonal products, 14 days for perishable and soft goods, and 21 days for hard goods.

  2. Prioritize: Review coverage is a big concern for pretty much every brand and retailer. Where possible, look to prioritize collection for products with few (or no) reviews.

  3. Get creative: While email is the most common review collection method, there are others. Asking for reviews via text message and on store receipts are two such examples. Are you maximizing your opportunities to ask for reviews?

  4. Incentivize: When La Colombe Coffee Roasters ran a review sweepstakes, the brand generated over 6,000 reviews across 90% of their products, leading to a 3X conversion lift. The campaign was so successful the brand now runs a quarterly sweepstakes. Similarly, 73% of consumers say they need an incentive to write a review, be it a purchase discount or loyalty points. Make writing a review a point-earning activity in your customer loyalty program. When customers are sent a free product sample, they are also more likely to write a review. This is why product sampling is such a commonly used technique.

  5. Syndicate your reviews to retail partners: By syndicating your reviews, you can drive review coverage across your brand’s website as well as those of your retail partners, such as Amazon, Target, and Walmart. This ensures that consumers are presented with a high volume of reviews to read, no matter where they prefer to buy your products.

More Benchmarks

UGC Benchmarks: Review Influence on Online Traffic to Product Pages

More Reviews and Stronger Average Ratings Increase Product Page Visits

Read More →

Visual UGC Benchmarks: Av. Interactor and Impression Conversion Lift

Modest conversion lift for Visual UGC impressions; but Visual UGC Interactions more than double conversion

Read More →

Q&A: Av. Interactor and Impression Conversion Lift

A Q&A Impression Lifts Conversion by 51%, While a Q&A Interaction Lift Conversion 138%

Read More →
SEO Lamp Search Results with star ratings on PLAs

Ratings & Reviews: Av. Interactor and Impression Conversion Lift

Simply Seeing Reviews Lifts Conversion by 20%, While Interacting With Reviews Lifts Conversion by 128%
Read More →

Ratings & Reviews Benchmarks: Visual UGC

Despite Increasing Importance to Consumers, Average Media Coverage for Most Brands Hovers Around 37%

Read More →

Ratings & Reviews Benchmarks: Review Length

The Average Review Is Only 218 Characters Long, Far Below the Consumer-Preferred 500+ Minimum

Read More →

Ratings & Reviews Benchmarks: Average Av. Rating

Across Verticals, Average eCommerce Product Rating is 4.5 Stars

Read More →

Ratings & Reviews Benchmarks: Average Rating Impact on Conversion

The Sweet Spot for conversion is 4.75-4.99 stars​

Read More →
Across Verticals, Average eCommerce Product Rating is 4.5 Stars

Key Findings:

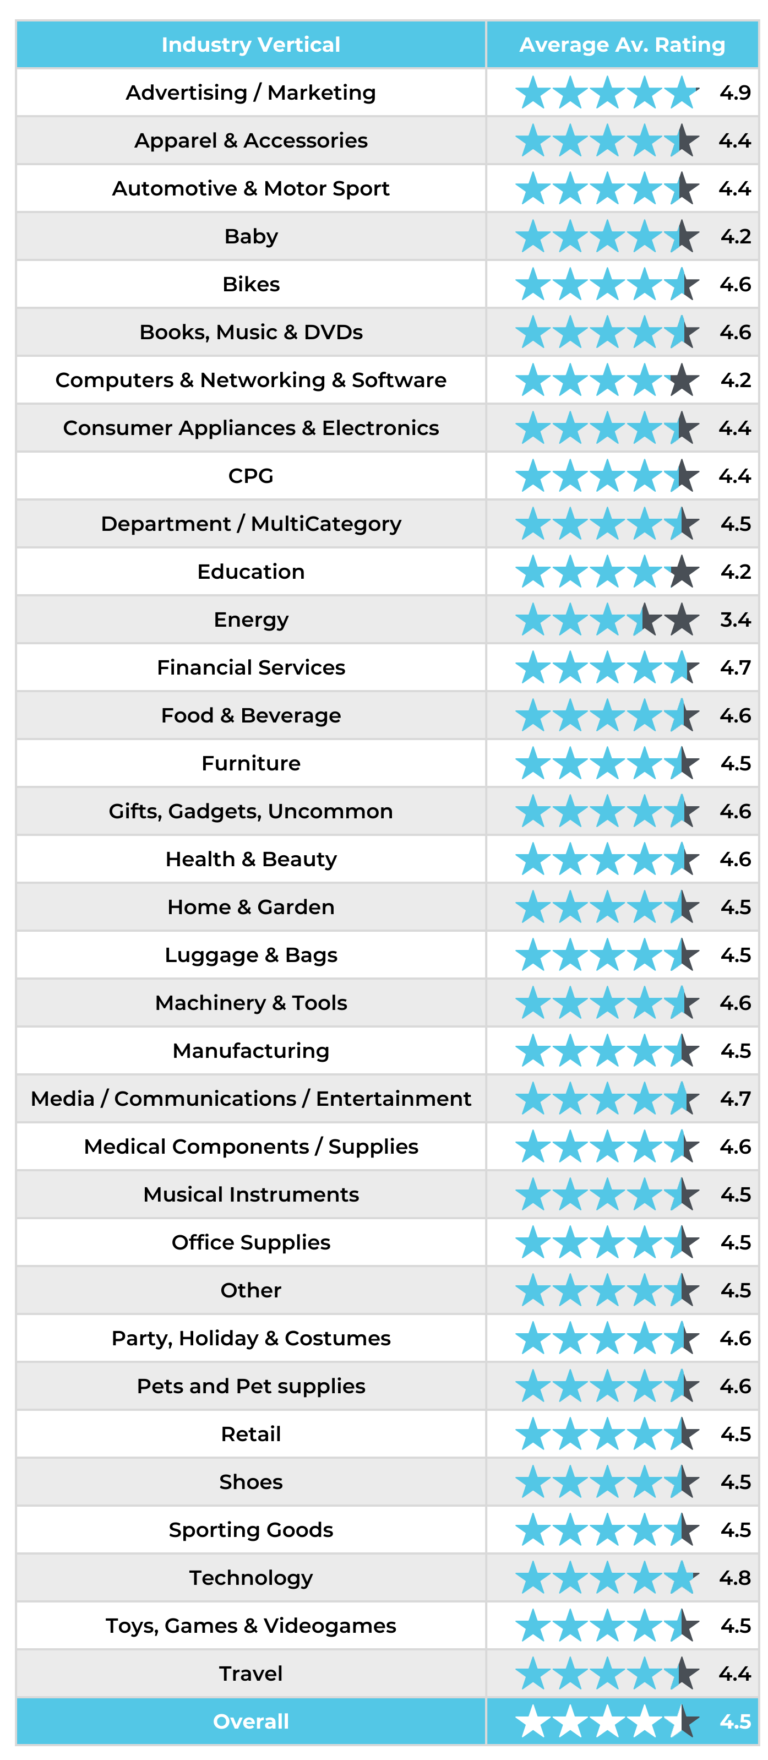
  • Across verticals, our data shows that the average rating for any given product is 4.5 stars out of 5.

  • The verticals with the highest star ratings included Advertising / Marketing (4.9 stars), Technology (4.8 stars), and Financial Services and Media / Communications / Entertainment, both at 4.7 stars.

  • The verticals with the lowest ratings included Energy (3.4 stars), and Baby, Education, and Computers & Networking & Software, all at 4.2 stars.

Methodology: Analysis of lifetime Ratings and Reviews submitted across 25.4MM+ online product pages on 3,600+ brand and retailer sites (Qualifier: Activity had to be recorded on the page in the previous 12 month period prior to March 7, 2022). Average review length recorded is based on review length at time of data extraction on March 7, 2022.

Across verticals, our data shows that the average rating for any given product is 4.5 stars out of 5. This is actually the exact star rating we recommend brands aim for, as a sizable number of consumers are suspicious of perfect 5-star ratings, including 46% of shoppers overall and 53% of Gen Z shoppers

Even the vertical with the highest star rating — Advertising/Marketing — has a 4.9 rating as opposed to a 5. The verticals with the next highest ratings include Technology, at 4.8 stars, and Financial Services and Media / Communications / Entertainment, both at 4.7 stars. 

Previous research we conducted with Northwestern University found that shoppers are most likely to purchase products with an average star rating between 4.2 and 4.5 stars. Our latest benchmarks indicate that the sweet spot has risen slightly since but we continue to see the highest conversion rates in the 4.25 – 4.99 average rating range. Positively, only one vertical — Energy — fell beneath this baseline star rating, with 3.4 stars out of 5.

Ratings and reviews are the single most important factor impacting purchase decisions, ranking above price, free shipping, brand, and recommendations from family and friends. 97% of consumers read ratings and reviews prior to making a purchase. Among them, the star rating is the first thing shoppers notice, with 77% considering the average rating of a product when reading reviews.

Five Snackable Data-Backed Average Rating Tips

  1. Regularly solicit feedback and new reviews: Be willing to ask for reviews more than once. One in three people need to be asked two or three times before they leave a review. Follow up at least two times, and 96% of consumers say they will write a review.

  2. Prominently display star ratings on product detail pages: Include a breakdown of the overall star ratings, so people can see how many shoppers rated 5, 4, 3, 2, or 1 stars. This allows shoppers to click on any of the bars to see only reviews of a certain star rating. Shoppers who click on these filters convert at 111.8% the rate of those who visit the same page and do not.

  3. Don’t be afraid of negative reviews: 62.4% of shoppers actively seek out one-star reviews by clicking on these star breakdowns — and they still convert at a rate that’s 108.8% higher than average. Negative reviews are an important tool shoppers depend on to make informed purchase decisions. One-star reviews can actually help shoppers confirm a product is right for them, if the one-star reviewer had a different use case or pain point. Negative reviews can also help brands reduce returns. 70% of consumers say they would have been less likely to return a product they purchased online if they had consulted the ratings and reviews first.

  4. Read and respond to reviews: Listen to the feedback provided by your customers, and use it to inform new features and product redesigns. When relaunching a new and improved product, share free samples to generate new reviews quickly. Between 85% to 91% of consumers say receiving a product free of charge, or before it’s sold to the general public, would incentivize them to write a review.

  5. Focus on experience: Providing a positive customer experience should always be a brand’s first priority, as that will naturally drive positive ratings and reviews. When asked what motivates them to write a review, 91% of consumers responded with “a positive experience,” while 76% who responded “a negative experience.”
  6.  

More Benchmarks

UGC Benchmarks: Review Influence on Online Traffic to Product Pages

More Reviews and Stronger Average Ratings Increase Product Page Visits

Read More →

Visual UGC Benchmarks: Av. Interactor and Impression Conversion Lift

Modest conversion lift for Visual UGC impressions; but Visual UGC Interactions more than double conversion

Read More →

Q&A: Av. Interactor and Impression Conversion Lift

A Q&A Impression Lifts Conversion by 51%, While a Q&A Interaction Lift Conversion 138%

Read More →
SEO Lamp Search Results with star ratings on PLAs

Ratings & Reviews: Av. Interactor and Impression Conversion Lift

Simply Seeing Reviews Lifts Conversion by 20%, While Interacting With Reviews Lifts Conversion by 128%
Read More →
The Sweet Spot for conversion is 4.75-4.99 stars

Key Findings:

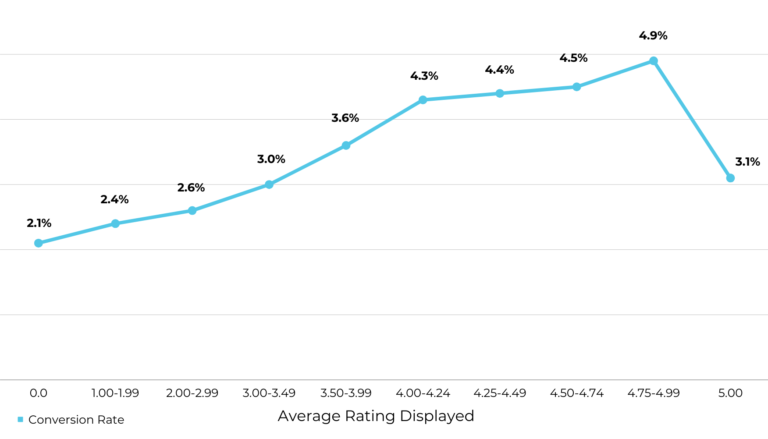
  • 4.75 – 4.99 stars is the optimal product rating for conversion. Products in this band have – on average – the highest conversion rates.

  • The biggest leap in conversion – in percentage terms – between bands is from 3 – 3.49 stars to 3.5 – 3.99 stars (20%), closely followed by 3.5 – 3.99 to 4.0 – 4.24 stars (19%).

  • A 4 star average rating is where the conversion rate rises above 4%, with overall highest conversion rates in the 4.25 – 4.99 range.

  • Products with average ratings of 5 stars have comparable conversion rates to products with 3.0 – 3.49 stars.

Methodology: Analysis of lifetime Ratings and Reviews submitted across 20MM+ online product pages on 1,000+ brand and retailer ecommerce sites (Qualifier: page must have had activity in the full calendar year prior to March 7, 2022). Conversion is defined here as orders (i.e. purchases) as a percentage of page visits. Average rating recorded is the average rating at time of data extraction on March 7, 2022.

The best star rating from a pure conversion rate perspective is in the 4.75 – 4.99 band. However, we see strong conversion performance from products with a 4-star average rating and above (with the exception being an average rating of 5.00 stars, more on that later).

The takeaway here for ecommerce practitioners wondering what targets they should set themselves: anything above 4 stars is good, 4.25 stars better, 4.5 stars better still and 4.75 stars the “North Star” goal.

All the while, you need to underpin any targets you do set yourself with the context of the specifics of your own business (e.g. vertical you operate in and competitors you’re up against, pricepoint of your product, etc). Ultimately, consumer expectations – which are a big part of how shoppers approach submitting ratings and reviews – are dictated by a number of factors that are likely unique to your business.

These results make one thing completely clear: consumers pay attention to the average rating. That might sound obvious in and of itself but remember star ratings are rounded to the nearest half star – in other words, both a 4.75 average rating and a 5.0 average rating will appear as a 5 star on a product page. There is a significant difference between the conversion rates in both of these bands. This means that shoppers clearly look beyond the star visual when deciding whether to purchase a product.

One finding – again – is clear and unmistakable. Consumers don’t trust 5-star average ratings. This supports much of our research: we have found a sizable proportion of consumers are suspicious of perfect 5-star ratings, including 46% of shoppers overall and 53% of Gen Z shoppers

Five Snackable Data-Backed Average Rating Tips

  1. Continually collect ratings and reviews: A Ratings and Reviews program needs constant work (consumers value review recency more than total volume nowadays). A continual focus on collection – in the right way – will also increase your average rating or, if you’re in a good spot already, maintain an existing high rating. We have loads of tips on collecting more review content in our Complete Guide.

  2. Prominently display the average rating AND rating breakdown on product detail pages: Consumers look beyond the star rating visual (99% say they do so at least sometimes), which indicates they are thirsty for deeper information. So make sure you give them it. Highlighting the average rating is a good start but also enables them to see how many shoppers rated the product 5, 4, 3, 2, or 1 stars. This allows shoppers to filter for reviews of a certain star rating (shoppers who click on these filters convert at 111.8% the rate of those who visit the same page and do not).

  3. Embrace negative reviews: The general population has become increasingly suspicious of what they see online in recent years. This has been clear in how shoppers approach Ratings and Reviews, where so-called “fake reviews” have been a big concern. While not manufacturing or faking review content is an obvious first step to fostering authenticity, also embrace negative reviews. 62.4% of shoppers actively seek out one-star reviews by clicking on these star breakdowns — and they still convert at a rate that’s 108.8% higher than those who don’t interact with review content.

  4. Analyze quantitatively and qualitatively: Your review content contains a goldmine of likely untapped product experience feedback. For products you want to improve average ratings, identify some common themes why, and then dig into individual review comments for the specific context. This will provide clear and actionable guidance on how to make improvements.

  5. Build good products and manage consumer expectations: Maybe obvious, but weak products generate poor reviews. Something else that creates poor reviews: unrealistic expectations around how the product will perform. Performance in both these areas will be evident if you analyze your review content (as per recommendation 4). Make sure the messaging on your product pages and throughout your site is accurate and isn’t going to set you up for failure. When asked what motivates them to write a review, 91% of consumers responded with “a positive experience,” while 76% said “a negative experience.”

More Benchmarks

UGC Benchmarks: Review Influence on Online Traffic to Product Pages

More Reviews and Stronger Average Ratings Increase Product Page Visits

Read More →

Visual UGC Benchmarks: Av. Interactor and Impression Conversion Lift

Modest conversion lift for Visual UGC impressions; but Visual UGC Interactions more than double conversion

Read More →

Q&A: Av. Interactor and Impression Conversion Lift

A Q&A Impression Lifts Conversion by 51%, While a Q&A Interaction Lift Conversion 138%

Read More →
SEO Lamp Search Results with star ratings on PLAs

Ratings & Reviews: Av. Interactor and Impression Conversion Lift

Simply Seeing Reviews Lifts Conversion by 20%, While Interacting With Reviews Lifts Conversion by 128%
Read More →

Ratings & Reviews Benchmarks: Visual UGC

Despite Increasing Importance to Consumers, Average Media Coverage for Most Brands Hovers Around 37%

Read More →

Ratings & Reviews Benchmarks: Review Length

The Average Review Is Only 218 Characters Long, Far Below the Consumer-Preferred 500+ Minimum

Read More →

Ratings & Reviews Benchmarks: Review Volume

The Average Product Boasts 402 Reviews, But This Is Still Lower Than Consumer Expectations

Read More →

Ratings & Reviews Benchmarks: Average Av. Rating

Across Verticals, Average eCommerce Product Rating is 4.5 Stars

Read More →

Brands and retailers live and die on the performance and reputation of their product. This is why it’s critical for them to understand how they stack up against their competition.

The PowerReviews Brand Health Index: Coffee & Cereal Edition ranks brands based on insights gleaned from more than 900k individual product reviews pulled from 12K product pages covering 305 brands on three major retailers and marketplaces (Amazon.com, Walmart.com and Target.com)

Check out the ungated report to find out:

(No form fill required!)
USAUK