Benchmarks based on existing Ratings and Reviews data from brands selling on Amazon.com

Amazon claims the top spot for eCommerce sales and traffic by a large margin — but that’s not all. It is also the most common place for people to start their purchase journey.

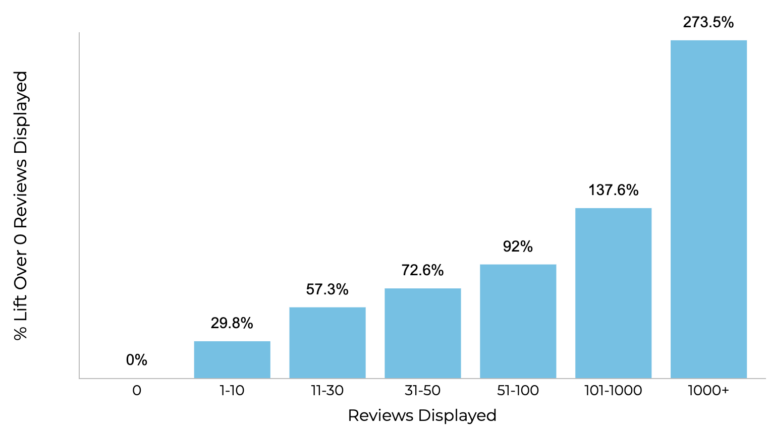
Your review footprint on Amazon.com – therefore – can be the difference between winning and losing. We analyzed more than 12M product reviews from over 31,000+  brands on Amazon.com to outline the specific benchmarks you need to know.

Check out the ungated report to find out:

(No form fill required!)

Benchmarks based on existing Ratings and Reviews data from brands selling on Walmart.com.

Walmart is a commerce giant whichever way you slice it – and Walmart.com is an absolutely critical sales channel for many brands. So standing out when competition is so severe is a huge challenge.

Your review footprint on Walmart.com – therefore – can be the difference between winning and losing. We analyzed more than 1M product reviews from 550+ brands on Walmart.com to outline the specific benchmarks you need to know.

Check out the ungated report to find out:

(No form fill required!)

What You Need to Know in Under 5 Mins

Almost all (98%) of consumers read ratings and reviews at least sometimes when shopping for footwear online. 85% do so regularly or always.

And with a conversion lift of 108.6%, those shoppers who interact with ratings and reviews are more than twice as likely to convert as those who don’t. 

Clearly, ratings and reviews can be a huge driver for success in the shoes category.

Review Benchmarks: Shoes

The following benchmarks come from an analysis of product pages on PowerReviews client sites in the shoes category.

69.7%

Review Coverage

4.5

Average Star Rating

174

Average Review Length

194

Reviews per Product

35.1%

Average Media Coverage

Monitoring the above metrics can help you ensure you’re generating both review quantity and quality — the essential cornerstones of any high-impact UGC strategy. Together, you can think of them as the North Star guiding your UGC strategy.

Review Coverage = 69.7%

69.7% of the shoes we analyzed have at least 1 review, which is a good starting point. However, it’s worth noting that the fewer reviews a shoe has, the more hesitance shoppers have about adding it to their carts — with 5% of shoe shoppers flat-out refusing to buy shoes that have 0 reviews. 

Average Star Rating = 4.5 stars

This is just below the sweet spot we recommend for the optimal conversion lift. Our research shows that products with ratings between 4.75 – 4.99 stars have the highest conversion rates.

Average Review Length = 174 characters

Longer reviews tend to have higher conversion rates, as they provide richer detail and more relevant information for shoppers. We recommend a stretch goal of 500 characters for the maximum uplift.

Reviews Per Product = 194

The average shoe in our analysis has 194 reviews. This is excellent, as 90% of shoe shoppers say they are comfortable purchasing a clothing item as long as it has 100–500 reviews or less. Given consumers’ high demands for review volume in the shoe category, though, brands must be consistently reaching out to customers to collect new reviews.

Average Media Coverage = 35.1%

35.1% of the footwear products we analyzed have at least one user-generated product image or a video. This is a strong start, but consumers expect to see much more user-generated imagery from shoe brands. A majority (71%) of consumers “always” or “regularly” seek out user-generated imagery when shopping for shoes online. And, increasing this percentage can work wonders for your conversion rates, as visitors who interact with user-generated photos and videos are 103.9% more likely to convert.

How Review Volume Impacts Conversion for Footwear Brands

So, if the average footwear product boasts 194 reviews, can you rest easy once each of your shoes has that many reviews?

You can, but you won’t see as many conversions as you would if you kept on pushing for more reviews. 

As you can see from the chart below, there is a direct relationship between review volume and conversion lift. The more reviews a shoe has, the more likely it is to be purchased.

Review Volume and Conversion Impact

This chart shows the lift in conversion when a customer sees a product page with a certain number of reviews displayed vs. a product page with 0 reviews. Shoe brands that aim to gather at least 100 reviews for their products can enjoy big upswings in their conversion rates. But once they reach 1,000 reviews per product, their conversion lift really skyrockets.

What Makes a Great Footwear Review?

Review volume is important, but so is review quality. Let’s take a look at what makes a great review for a product in the footwear category, courtesy of Crocs.

When people are shopping for shoes, they are looking for very specific, in-depth information that only reviews from other customers can provide in a credible and authentic way. For example, shoe shoppers want to know:

  • Is this shoe comfortable?
  • Where, and for what activities, can I wear this shoe? 
  • Is the fit of this shoe in line with other shoes from this brand?
  • What are the real pros and cons of this shoe, regardless of what the brand claims?
  • Is this review from someone like me? (e.g. Do we have the same personal style? Do we like the same kind of shoes?)

These are the kind of questions that can only be answered by a detailed review from another verified customer. Review elements like star rating and review count pique a shopper’s interest, getting them to click through to the product page. But it’s the quality of a review that gets them to actually add that shoe to their cart. In this way, review quality and quantity work together, nudging shoppers down the funnel.

How to Collect Footwear Reviews That Convert Browsers Into Buyers

So, how can shoe brands maximize the quality of their reviews, with an eye towards lifting conversions? It all comes down to how you optimize your review form.

At PowerReviews, we enable brands to add custom questions to their review forms to zoom in on the most relevant information for their customers. Many of the questions we spoke to in the previous question — fit, use case, personal style — are the most impactful review questions for footwear brands. 

The shoe category is one that can be vulnerable to high levels of returns. With 75% of shoppers citing poor fit as a top reason for returns, providing this additional fit information in reviews can do a lot to limit returns. 

You don’t have to just take our word for it. In fact, we surveyed over 9,200 shoppers and 66% of them said that the ability to read ratings and reviews prior to purchase would have made them less likely to return. Slightly more (69%) said that being able to see photos and videos from other consumers first also decreases their likelihood of making a return.

So, add questions to your review form that help shoppers understand more about fit. For example, does the shoe run big or is it true to size? How would a reviewer describe their foot shape or width? Encourage reviewers to add a photo to their review for more context. 

These custom questions are particularly important for the shoe category, even more so than others. After comfort, “fit and sizing” information is the top consideration for shoppers when purchasing footwear, with 89% of shoe shoppers seeking it out when shopping for new shoes. 

Once you have your review form and display optimized for maximum impact, it’s time to go out and collect those reviews! Try:

Bonus Step: Syndicate Your Reviews for Maximum Impact

Let’s look to the future for a moment. Picture it: You’ve got a strong UGC strategy that’s been up and running for months, you’re collecting great reviews, and they’re all on your website for your customers to see.

This would be great if shoppers exclusively purchased their shoes through footwear brands’ websites — but they don’t. Only 38% of shoppers start their purchase journey on a brand’s website. The other 62% start on a retailer’s website, Amazon, or elsewhere.

Here’s where review syndication comes in. In essence, review syndication allows you to push reviews collected on your own D2C website out to the websites of your retail partners. For example, here’s a review collected on Skechers that was syndicated to both Zappos and Shoe Carnival.

From a single review, Skechers was able to create 3 reviews, all on websites where their customers may encounter their shoes. 

Review syndication exponentially increases the value and reach of your review, putting it in front of more eyeballs and increasing your sales volumes at your retail partners. We recommend choosing retailers based on your sales data, as your best-selling retailers are the ones where you’re going to get the biggest uplift from syndication. 

Is your UGC strategy due for a refresh? Contact PowerReviews today to learn more about how UGC can grow your sales.

What You Need to Know in Under 5 Mins

Ratings and reviews can make or break a clothing brand. 86% of apparel shoppers “always” or “regularly” read reviews when shopping for new apparel products. And nearly as many (80%) are less likely to buy an apparel product if it has no reviews, including 89% of Gen Z shoppers.

The fast pace and seasonal nature of the fashion industry makes the apparel category highly competitive. So, building a great Ratings & Reviews program is important. To do that successfully, you need to understand how you stack up against other brands within your category.

Review Benchmarks: Apparel

53.5%

Review Coverage

4.5

Average Star Rating

135

Average Review Length

279

Reviews per Product

16.5%

Average Media Coverage

Monitoring the above metrics can help you ensure you’re generating both review quantity and review quality — the essential cornerstones of any high-impact UGC strategy.

Review Coverage = 53.5%

53.5% of the apparel products we analyzed have at least 1 review, which is much lower than other verticals. One explanation could be that this category has a lot of seasonality to it. Apparel brands are continuously refreshing their product assortment, so you have lots of new products going live without reviews, and fewer products with reviews that are evergreen. Explanations aside, boosting this number is critical to standing out against competitors on the digital shelf.

Average Star Rating = 4.5 stars

This is just below the sweet spot we recommend for the optimal conversion lift. Our research shows that products with ratings between 4.75 – 4.99 stars have the highest conversion rates.

Average Review Length = 135 characters

Longer reviews tend to have higher conversion rates, as they provide richer detail and more relevant information for shoppers. We recommend a stretch goal of 500 characters for the maximum uplift.

Reviews Per Product = 279

The average apparel product in our analysis has 279 reviews. This is excellent, as 90% of apparel shoppers say they are comfortable purchasing a clothing item as long as it has 100–500 reviews or less. Given consumers’ high demands for review volume in the apparel category, brands must be consistently reaching out to customers to collect new reviews.

Average Media Coverage = 16.5%

16.5% of the apparel products we analyzed have at least one user-generated product image or a video. This is a good start, but consumers expect to see much more user-generated imagery from apparel brands. 99% of Gen Z shoppers seek out user-generated imagery at least sometimes when shopping for clothing online. And, increasing this percentage can work wonders for your conversion rates, as visitors who interact with user-generated photos and videos are 103.9% more likely to convert.

How Review Volume Impacts Conversion for Apparel Brands

Now that you know that 279 reviews per product is the baseline for apparel brands, the question becomes, “How many more reviews do you need to stand out?”

If there’s one thing we’ve learned about ratings and reviews, it’s that the needle is always moving. Today, 279 reviews per product is a good baseline to go after, but to really stand out, you need to always be collecting fresh, detailed reviews for your clothing and accessories.

Plus, the more reviews you have, the more likely a shopper is to convert. Just take a look at this chart, which shows the lift in conversion when a customer sees a product page with a certain number of reviews displayed vs. a product page with 0 reviews.

Review Volume and Conversion Impact

As you can see, there is a direct relationship between review volume and conversion lift. The more reviews a product has, the more likely it is to be purchased.

What Makes a Great Apparel Product Review?

Review volume is important, but so is review quality. Let’s take a look at what makes a great review for a product in the apparel and accessories category.

When people are shopping for apparel items, they are looking for lots of very specific information that you only really get once you dig into the review. Apparel shoppers want to understand all the elements that they can’t experience virtually through the online shopping experience. For example:

  • How does the reviewer rate and describe the quality of the material?
  • Was the item a good value for what they paid?
  • What’s the fit like?

These questions can be answered by a detailed, high-quality review — all the more so if the reviewer includes a photo of the item itself! (Did we mention that shoppers who interact with user-generated imagery convert at a rate 103.9% higher?) The more information that you capture, the more likely you are to drive conversions.

How to Collect Apparel Reviews That Convert Browsers Into Buyers

So, how can apparel brands maximize the quality of their reviews, with an eye towards lifting conversions? It all comes down to how you optimize your review form.

At PowerReviews, we enable brands to add custom questions to their review forms to zoom in on the most relevant information for their customers. For apparel brands, these questions often speak to the quality, fit, and size of a product. It’s also important to ask questions about the reviewer’s body shape, so that future customers can seek out reviews from people like them. 

Your goal is to maximize the information you capture from a review, without overwhelming the reviewer so that they give up.  We find that 8 questions is the sweet spot and once a form becomes much longer than that, you tend to see a higher rate of abandonment. So, be selective!

These specific questions are particularly important for the Apparel category, even more so than others. Nearly all (92%) of consumers pay attention to sizing and fit information when shopping for clothing, and 94% find it helpful to see measurement information (height, weight, etc.) from reviews for apparel. 

Once you have your review form and display optimized for maximum impact, it’s time to go out and collect those reviews! Try:

Bonus Step: Syndicate Your Reviews for Maximum Impact

Collecting reviews for your website is an important first step. To really extend the reach of your reviews — and boost conversions in the process — you’ll want to generate high review volumes for your top-priority retail partners, too. 

Fortunately, there’s a super-easy way to do that, and it’s called Review Syndication. Here’s how it works: You collect a review through your website, and then – through the power of UGC Syndication by PowerReviews – that review gets pushed to your retailer partners who sell that same product. 

Here’s an example from The North Face, who turned a single review on their website into 4 reviews for their retail partners.

Review syndication exponentially increases the value and reach of your review, putting it in front of more eyeballs and increasing your sales volumes at your retail partners. We recommend choosing retailers based on your sales data, as your best-selling retailers are the ones where you’re going to get the biggest uplift from syndication. 

Does your UGC strategy deserve a fashion makeover? Contact PowerReviews today to learn more about how UGC can grow your sales.

What You Need to Know in Under 5 Mins

A major challenge for CPG brands is determining how to stand out among their competitors on the digital shelf. Understanding what it takes in your category is a critical element to success. 

With ratings and reviews being the single-most important factor impacting purchase decisions, user-generated content can be the key to unlocking ecommerce success — particularly in a crowded category like CPG.

Got 5 minutes? Perfect. Watch the video below or read on to learn what you need to know about ratings and reviews for the CPG category.

Review Benchmarks: CPG

The following benchmarks come from an analysis of product pages on PowerReviews client sites in the CPG category. We chose these benchmarks because they speak to both review quantity and quality – the two things brands should focus on to deliver a high impact UGC strategy. 

80.8%

Review Coverage

4.6

Average Star Rating

201

Average Review Length

235

Reviews per Product

30.3%

Average Media Coverage

Review Coverage = 80.8%

80.8% of the CPG products we analyzed have at least 1 review. This positions CPG brands ahead of many other verticals, but given the conversion lift of having just 1 review (see the next section), it is critical that brands strive to collect reviews for all the products on their site.

Average Star Rating = 4.6 stars

This is just below the sweet spot we recommend for the optimal conversion lift. Our research shows that products with ratings between 4.75 – 4.99 stars have the highest conversion rates.

Average Review Length = 201 characters

Longer reviews tend to have higher conversion rates, as they provide richer detail and more relevant information for shoppers. For the maximum uplift, we recommend a stretch goal of 500 characters per review (around the length of this and the previous bullet combined).

Reviews Per Product = 235

The average CPG product in our analysis has 235 reviews. This is wonderful, as nearly half (43%) of consumers want to see more than 100 reviews per product. Having said that, there is a linear relationship between review volume and conversion rates (again, see the next section), so more reviews is always better.

Average Media Coverage = 30.3%

30.3% of the CPG products we analyzed have at least one user-generated image or a video. Increasing this percentage can work wonders for your conversion rates, as visitors who interact with user-generated photos and videos are 103.9% more likely to convert.

These benchmarks are pretty high in comparison to what we typically see for other categories. But when you consider what makes the CPG category unique, it makes sense. The CPG category carries a lot of replenishment purchases. These are the products that people are buying again and over again, so it’s entirely possible that there’s a larger customer base from which to draw reviews. 

For brands with a solid UGC strategy, that can be an advantage: with more people to ask for reviews, the more reviews they can consistently generate to persuade others to purchase — leading to more online traffic and dollars. For brands without a UGC strategy, however, it only makes the category that much more competitive.

How Review Volume Impacts Conversion for CPG Brands

While the average CPG product in our analysis has 235 reviews, we hinted in the above section that more is always better. Here’s why.

The chart below shows the lift in conversion when a customer sees a product page with a certain number of reviews displayed vs. a product page with 0 reviews. You can see there is a direct relationship between review volume and conversion lift.

Review Volume and Conversion Impact

As you can see, more is more when it comes to reviews. There is a significant uplift in conversion when a product goes from having fewer than 1,000 reviews to more than 1,000. At the same time, 1 review is better than none, so don’t be afraid to just get started!

What Makes a Great CPG Product Review?

It’s important to have a lot of reviews, but those reviews also need a certain depth to them in order to help buyers make buying decisions. When shoppers arrive on your product page, they’re right at the end of the purchase funnel. They are looking for information that is a bit deeper in level of detail to nudge them toward clicking that “Add to Cart” button. That’s where review quality comes in.

So, what makes a quality review for a CPG product? Let’s take a look at this example from La Colombe Coffee Roasters.

Not only does this review make a bold statement that is persuasive on its own (“Only a Fool Would Not Buy This Product”), but it contains a lot of personality and information about who bought this product and who is enjoying it. 

The review display also highlights a lot of key information outside of the block of text, such as the reviewer’s coffee preferences (e.g. “Preferred Roast Level”), a “Verified Buyer” badge to build trust, and the bottom line on whether they would purchase this product again (in this case, a resounding yes).

How to Collect CPG Reviews That Convert Browsers Into Buyers

To succeed at UGC, you need to capture reviews that are deep and rich in detail. How do you do that? It’s all about asking the right questions.

In addition to the standard review box, we recommend adding custom questions to your review forms to maximize the actionability of the information you collect. At PowerReviews, we call these Merchant Specific Questions, or MSQs. By adding MSQs, you can squeeze additional information out of reviewers that future shoppers will find useful, such as the best use case for a product, pros and cons, or taste preferences. Plus, by making these MSQs clickable options, as opposed to an open-text field, they are less burdensome on the reviewer to answer.

Avoid adding too many MSQs, though. We find that 8 questions is the sweet spot and once a form becomes much longer than that, we see a higher rate of abandonment. So, choose wisely, and be intentional about what kind of data you want to include on your product display pages to provide your customers with all of the information they need to make an informed purchase. 

For MSQ inspiration, take a look at this review form from La Colombe Coffee Roasters.

La Colombe obviously knows their customer, and they know the types of things their customers look for, so they’re looking to elevate that information in the data they capture and display on their product pages.

Once you have optimized your review form, it’s time to go out and collect those reviews! Try asking for reviews via your:

Bonus Step: Syndicate Your Reviews for Maximum Impact

Soon you’ll be collecting lots of detail-rich reviews on your website, and in high volumes, too. Congratulations! But the work’s not quite over just yet. To truly maximize the value of those reviews, you need to ensure that those reviews are showing up in all the same places your shoppers are. 

For CPG brands, that often includes retailers like Albertsons, Walmart, Target, and Amazon. Enter: UGC Syndication by PowerReviews. When you set up review syndication, your customers only have to write a review once. Then that review gets posted not only to your website, but to your biggest retail partners as well!

When setting up review syndication, the key is to focus on the biggest traffic websites that will have the biggest upside for you. You can find these using your sales data. You’ll likely ultimately get a bigger boost in revenue by maximizing your review footprint on one of these higher-traffic websites than a less-trafficked, lower-impact website. 

Ready to beat your competition and help more consumers discover your CPG products?

Contact PowerReviews to learn more about how UGC can grow your business.

What You Need to Know in Under 5 Mins

When you’re managing marketing for a toy brand, you need to know where you stand among the competition. Enter: ratings and reviews, a treasure trove of customer insights regarding your toys and those of your competitors. 

Reviews are also a powerful tool for driving more traffic to product pages and then converting that traffic at a higher rate — if you know how to use them to stand out from the competition. 

Got 5 minutes? Perfect. Watch the video below or read on to learn what you need to know about ratings and reviews for the toys category.

Review Benchmarks: Toys

The following benchmarks come from an analysis of Toy product pages.

71.6%

Review Coverage

4.7

Average Star Rating

112

Average Review Length

59

Reviews per Product

42.7%

Average Media Coverage

Monitoring the above metrics can help you ensure you’re generating both review quantity and review quality — the essential cornerstones of any high-impact UGC strategy.

Review Coverage = 71.6%

71.6% of the toy products we analyzed have at least 1 review. This is a great starting point, but given the conversion lift of having just 1 review (see the next section), it is critical that brands strive to collect reviews for all the products on their site.

Average Star Rating = 4.7 stars

This is just below the sweet spot we recommend for the optimal conversion lift. Our research shows that products with ratings between 4.75 – 4.99 stars have the highest conversion rates.

Average Review Length = 112 characters

Longer reviews tend to have higher conversion rates, as they provide richer detail and more relevant information for shoppers. We recommend a stretch goal of 500 characters for the maximum uplift.

Reviews Per Product = 59

The average toy in our analysis has 59 reviews. Consumers are split on the ideal number of reviews per product, with 57% being okay with a product having a review count in this range. But, 43% want to see more than 100 reviews per product. The bottom line? Consumers are always looking for more reviews.

Average Media Coverage = 42.7%

42.7% of the toys we analyzed have at least one user-generated product image or a video. It’s wonderful to see shoppers sharing their child playing with your toys! Increasing this percentage can work wonders for your conversion rates, as visitors who interact with user-generated photos and videos are 103.9% more likely to convert.

How Review Volume Impacts Conversion for Toy Brands

Brands always ask us, “How many reviews does a brand really need on all of their products?”

The short answer is, “As many as possible.” And it’s for one simple (but powerful reason): the more reviews a product has, the more likely it is to be purchased. 

Take a look at this chart, which shows the lift in conversion when a customer sees a product page with a certain number of reviews displayed vs. a product page with 0 reviews.

Review Volume and Conversion Impact

As you can see, there is a direct relationship between review volume and conversion lift. 59 reviews per product is the benchmark for the Toy category and a great number to work towards. 

But, once you reach 59 reviews, you’ll want to keep on going. There’s a big lift once you pass 100 reviews. And once you pass 1,000 reviews, the conversion lift skyrockets. So, take a cue from Buzz Lightyear and shoot for infinity and beyond!

What Makes a Great Toy Product Review?

Review volume is important, but so is review quality. Let’s take a look at what makes a great review for a toy. 

This review answers a lot of questions potential customers may have, including:

  • What does this toy do?
  • What are the pros and cons of this toy?
  • Does it work with other toys? 
  • Who is the reviewer, and who did they purchase the product for?

That last question touches on one of the major trends we see in the toy category: gift buying. The toy category is unique in that, often, the reviewer is not the end user of the product. Many of the people who are purchasing your toys may not be at all familiar with your product, or even your brand, so they’re looking for guidance on what to buy. 

This is precisely why review quality is so important for the toy category. Reviews can educate your customers on how a toy works, what kinds of children will like playing with it, and more. The depth of a review — both in featured information like the “Pros” and “Best For” elements as well as the review itself — is hugely important for toy shoppers.

How to Collect Toy Reviews That Convert Browsers Into Buyers

Now that you know the kind of feature-rich reviews you want for your toys, the question is, how do you go about collecting them? 

At PowerReviews, we recommend including custom questions on your review forms to maximize the actionability and relevancy of the type of information collected. We call these Merchant-Specific Questions, or MSQs. We’ve found that questions like “Who did you purchase this for?” and “What occasion did you purchase this for?” can be particularly helpful for the toy category and all the parents, grandparents, aunts, uncles, family friends, and more who are buying toys for the little ones in their lives.

When designing your review collection form, be thoughtful and intentional about what kind of data you want to include so your customers can access all of the information they need to make an informed purchase. Be careful not to make the forms too long, though. We find that 8 questions is the sweet spot. Once a form becomes much longer than that, we see a higher rate of abandonment. 

Next, think about how you can display this information to help shoppers who are reading the review. For example, you might elevate the pros/cons list higher up on your product page, in order to give people a quick glance and invite them to read more of your reviews. 

Don’t forget to add a character counter to cheer people on toward leaving longer, more detail-rich reviews!

Once you have your review form and display optimized for maximum impact, it’s time to go out and collect those reviews!

Try:

Bonus Step: Syndicate Your Reviews for Maximum Impact

Let’s say you’ve collected loads of great reviews, and they’re all on your website. That’s great if you’re a strictly D2C toy merchant. 

But, if you sell through more channels than just your website, then you need to make sure your reviews show up in all the places your customers are shopping, from Amazon to Target. 

This is where review syndication comes in. Your customers write a review once, and then — through the magic of UGC Syndication by PowerReviews — your review appears on multiple retail websites.

With syndication, one product review can easily turn into two, three, four, or more! When setting up review syndication, think about the retailers that are going to have the biggest impact for you — e.g. the highest traffic sites where you tend to make the most sales — as those are the ones where you’re going to enjoy the biggest returns.

Think about it this way: there is a huge amount of traffic on your biggest retailer sites – potentially many times more than your lower impact retailers. So it follows that you should focus on optimizing your presence there – both from a review volume and a review quality perspective – to ensure you stand out in an environment where competition is likely fierce.

Ready to have fun with reviews? Help consumers discover your toys with the power of ratings and reviews. Contact PowerReviews to learn more about how UGC can grow your business.

Historically, alcohol was an in-store purchase. Then the COVID-19 pandemic happened and online alcohol sales skyrocketed. 

Now, industry experts predict alcohol ecommerce will grow by 66% over the next few years, reaching $42 billion by 2025.

In ecommerce, more than 99% of customers rely on Ratings and Reviews to guide their purchase decisions. Therefore, understanding how you stack up against the competition in this respect is  critical.

In this report, we rank 90+ brands based on Ratings and Reviews footprint across wine, beer and spirits categories while highlighting key benchmarks. 

Check out the ungated report to find out:

(No form fill required!)

Benchmarks based on existing Ratings and Reviews data from brands selling on Walmart.com.

Walmart is a commerce giant whichever way you slice it – and Walmart.com is an absolutely critical sales channel for many brands. So standing out when competition is so severe is a huge challenge.

Your review footprint on Walmart.com – therefore – can be the difference between winning and losing. We analyzed more than 1M product reviews from 550+ brands on Walmart.com to outline the specific benchmarks you need to know.

Check out the ungated report to find out:

(No form fill required!)
More Reviews and Stronger Average Ratings Increase Product Page Visits

Key Findings:

  • Basic review information – typically review count and average rating – is usually displayed at earlier discovery-focused stages of the digital shopping journey to create interest and ultimately drive traffic to specific product pages.

  • This article explores the relationship between review information and resulting page views by examining shopper activity across a representative sample of 8.8 million product pages.

  • A higher volume of reviews and favorable average product ratings clearly drive more traffic to product pages.

When it comes to conversions on product pages and reviews, the evidence is very clear: a strong reviews footprint (i.e. average ratings of more than 4 stars and high review volumes) leads to more conversions.

But how much of an impact does review footprint have on attracting shoppers to product pages in the first place? We analyzed shopper interaction data from more than 8.8 million product pages to find out.

Understanding the Digital Shopper Journey

Average rating and review volume are displayed prominently throughout most digital shopping journeys, being prioritized by most sites at the early stages of the funnel.

Typically, this information is published alongside a product image, price (including any discount) and shipping specifics on Product Listing Pages (PLPs), search result pages and even – in some cases – home pages.

Review Volume Impact on Traffic - All Ecommerce Sites

The below two charts are an analysis of all time site behavior across an illustrative sample of more than 8.8 million Product Display Pages (PDPs) from brand and retailer sites – which accounts for more than 27.7 billion page visits in total.

The chart highlights the percentage of total PDPs that exist of those we analyzed with the corresponding review volumes at the time the data was pulled.

Once a page has reviews displayed, it outperforms in terms of % of visitors going to that page relative to the % of total product pages it represents.
Analysis based on an illustrative sample of 8,841,414 Product Display Pages (PDPs) - which accounts for 27,702,856,033 page visits in total. Review volume data correct as at August 11, 2022.
Bottom line: having any reviews on your product pages drives more traffic to those pages.

Across all the product pages we analyzed, the overwhelming majority (60.2%) don’t have any reviews. However, these PDPs only accounted for 11.6% of all page visits. This firstly demonstrates the huge opportunity for brands and retailers with review-less product pages.

Beyond that, this analysis clearly illustrates how the presence of reviews leads to significantly higher volumes of traffic to product pages.

The obvious next question to ask is how many reviews do I need to experience the benefits? This is never an easy question to answer as there is so much nuance and individual circumstance involved.

In the above, for example, around a quarter of all page visits occur on pages with between one and ten reviews. But this also accounts for a similar proportion of pages analyzed.

There are simply fewer pages with higher review volumes, and that’s because collecting reviews is hard. This means that that dataset is smaller.

However, we start to see the biggest increments in traffic for products with 11 reviews or more. And the numbers for pages with more than 100 reviews clearly standout.

Overall, these account for 2% of pages but 31% of traffic (both totals are rounded to the nearest whole number). So we can say with confidence that this should be the aspiration for all brands and retailers looking to get more eyeballs on their product pages and their products.

Review Volume Impact on Traffic - Retailer Sites

Brands selling their products on retail sites are of course preoccupied with standing out on and maximizing returns from those channels. So, drivers of traffic to PDPs is something they should be thinking about – assuming they are not already.

In this section, we therefore restrict the analysis to the retailer websites included in the above sample – examining the relationship between product page visits and review volumes on those product pages.

Distribution of Page Visits by Review Volume on Retailer Sites
Analysis based on an illustrative sample of more than 8,105,477 Product Display Pages (PDPs) - which accounts for 19,838,070,215 page visits in total. Review volume data correct as at August 11, 2022.

While the numbers deviate a little, the main trends are similar to the combined brand and retailer analysis. 

For brands looking to stand out on retail channel websites, there are three key takeaways: while the majority of product pages (61%) do not have reviews, those that do attract significantly more traffic and – for the most part – the more reviews, the bigger the page view gains.

In other words: ensuring that you have the maximum volume of reviews on your product pages on retailer sites is a critical retail channel marketing strategy.

Average Rating Impact on Traffic - All Ecommerce Sites

Typically, an average rating is displayed alongside a review count at any time it is highlighted in the buyer journey. The chart directly below – a different methodology from the above analysis – highlights the lift in traffic volumes over the average rating band with the lowest review volume (1.0 – 1.9 average rating).

For full transparency, we also wanted to highlight the average review volumes of products in each of the average rating bands. This is the total volume of reviews for products in that average rating band divided by the total volume of products in that average rating band. 

As identified in the above section, review volume clearly has a factor on traffic and – as indicated here – is correlated to the average rating of the product.

Impact of Average Star Rating on Page Traffic
Analysis based on an illustrative sample of 8,841,414 Product Display Pages (PDPs) - which accounts for 27,702,856,033 page visits in total. Review volume data correct as at August 11, 2022.

In line with our conversion-based analysis on the impact of average ratings, the largest gains in Product Display Page (PDP) views occur above the 4.0 star mark. So this should be the aspiration for all brands and retailers running a ratings and reviews program.

Products in the 4.5 – 4.99 average rating range attract the most traffic and highest review volumes, making this the absolute sweet spot.

Consumers are skeptical of 5.0 average star ratings. They typically follow the mantra: if something looks to be good to be true, it invariably is.

Average Rating Impact on Traffic - Retailer Sites Only

But what impact does average rating have specifically on retail sites for brands that use these as key sales channels?

In this section, we again restrict our analysis to the retailer websites included in our sample – examining the relationship between product page visits and average rating on those product pages.

Impact of Average Star Rating on Page Traffic for Retailer Sites
Analysis based on an illustrative sample of more than 8,105,477 Product Display Pages (PDPs) - which accounts for 19,838,070,215 page visits in total. Review volume data correct as at August 11, 2022.

As with the brand and retailer analysis, the retailer only segmentation demonstrates the same themes: that more than four stars should be the goal and that 4.5 – 4.99 average rating range is the absolute sweet spot for traffic (and review volume).

However, the specific numbers do differ slightly. For example, 4.5 – 4.74 average rating products experience lower traffic lifts in the retailer only analysis (12,829% vs 16,671% for brands AND retailers).

But – really – this is splitting hairs. The overall impact of a strong average rating on product page traffic is immense whichever way you slice it.

Key Takeaways

  1. Your ratings and reviews footprint and presence has a significant impact on your ability to capture interest earlier in the customer journey and pull shoppers into your funnel.

  2. You should aim for a minimum average rating of 4.0 stars across a minimum of 11 reviews for each product in order to drive traffic to your product pages.

  3. However, any improvement on either of these baselines will create meaningful performance improvements.

Note: We use the terms Product Display Page (PDP) and Product Page interchangeably above. They have the same meaning in the context of this article.