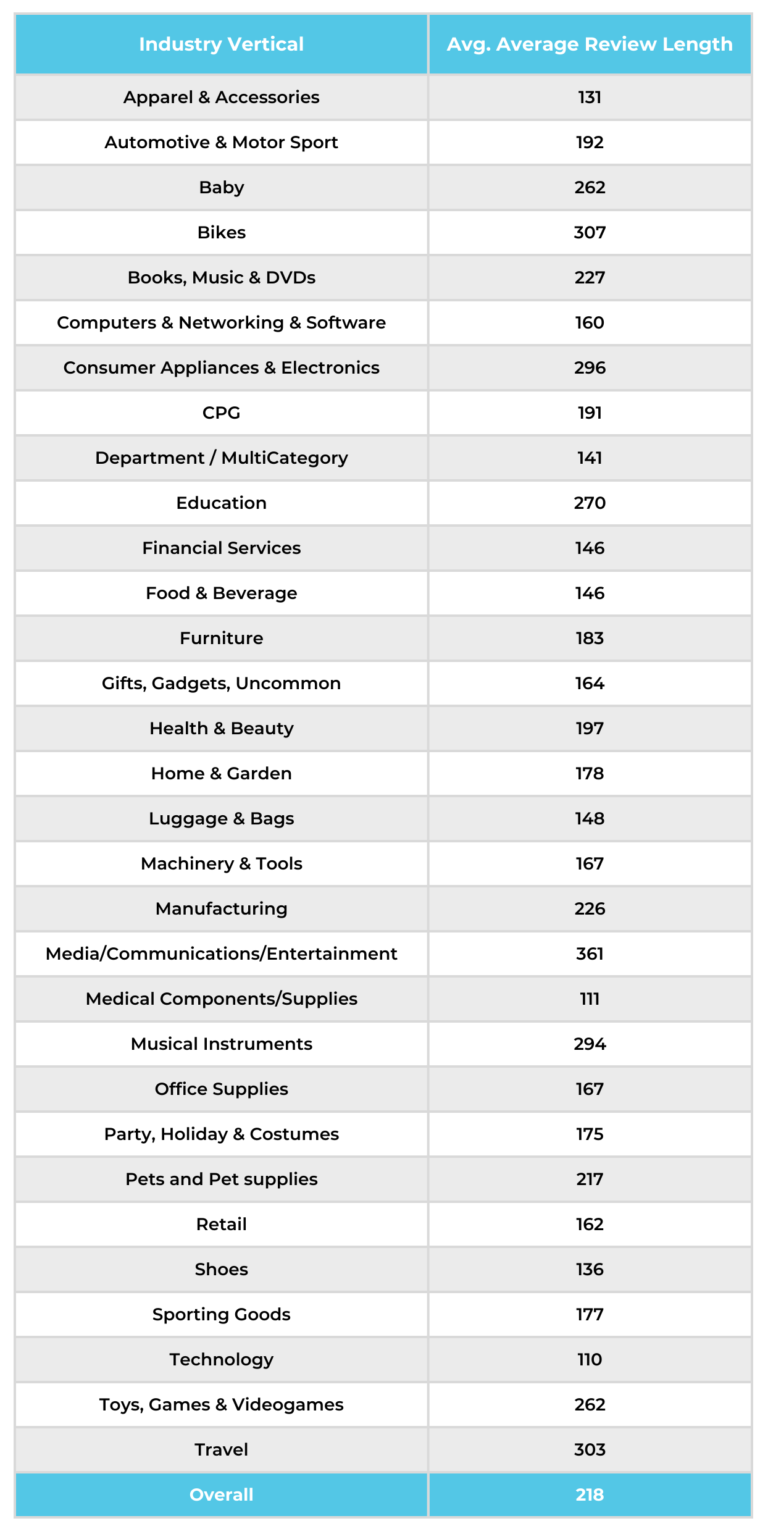


Ratings & Reviews Benchmarks: Review Length
The Average Review Is Only 218 Characters Long, Far Below the Consumer-Preferred 500+ Minimum

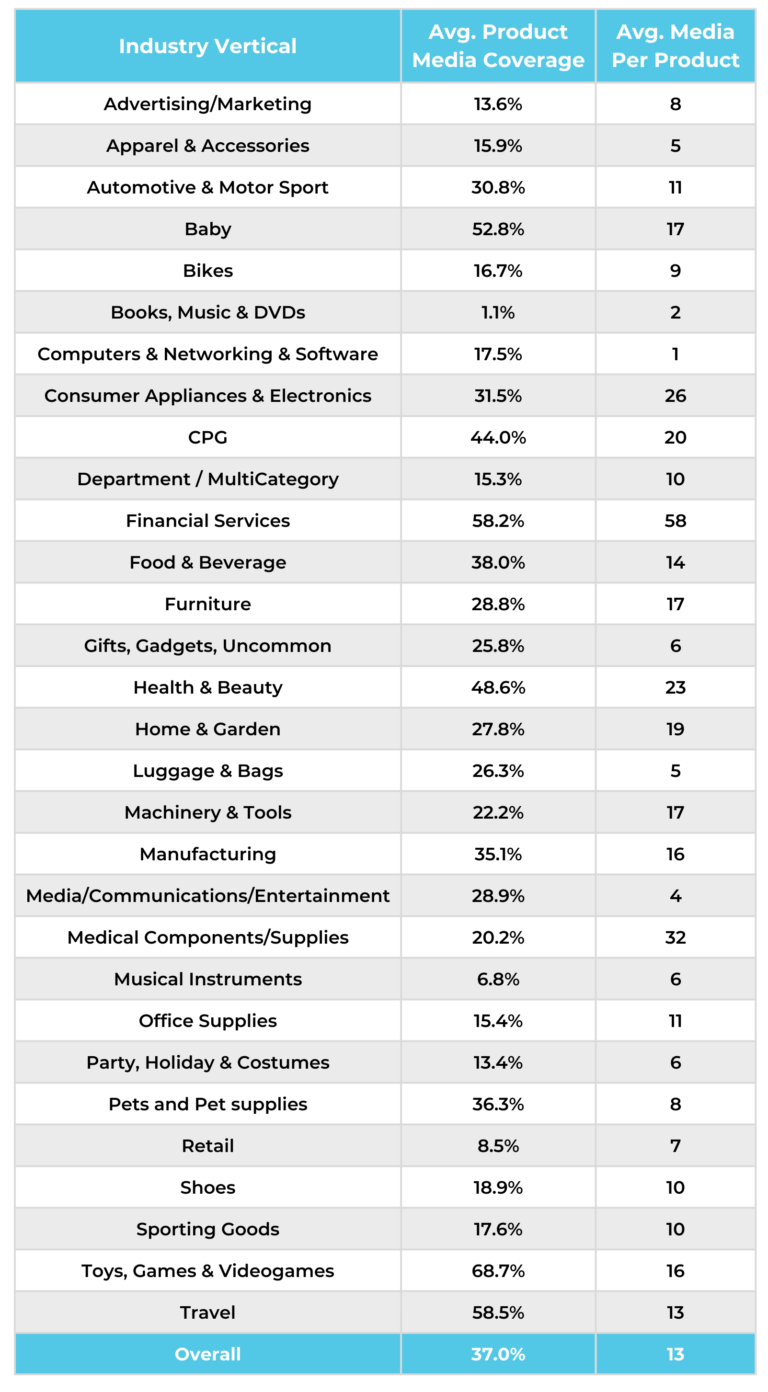
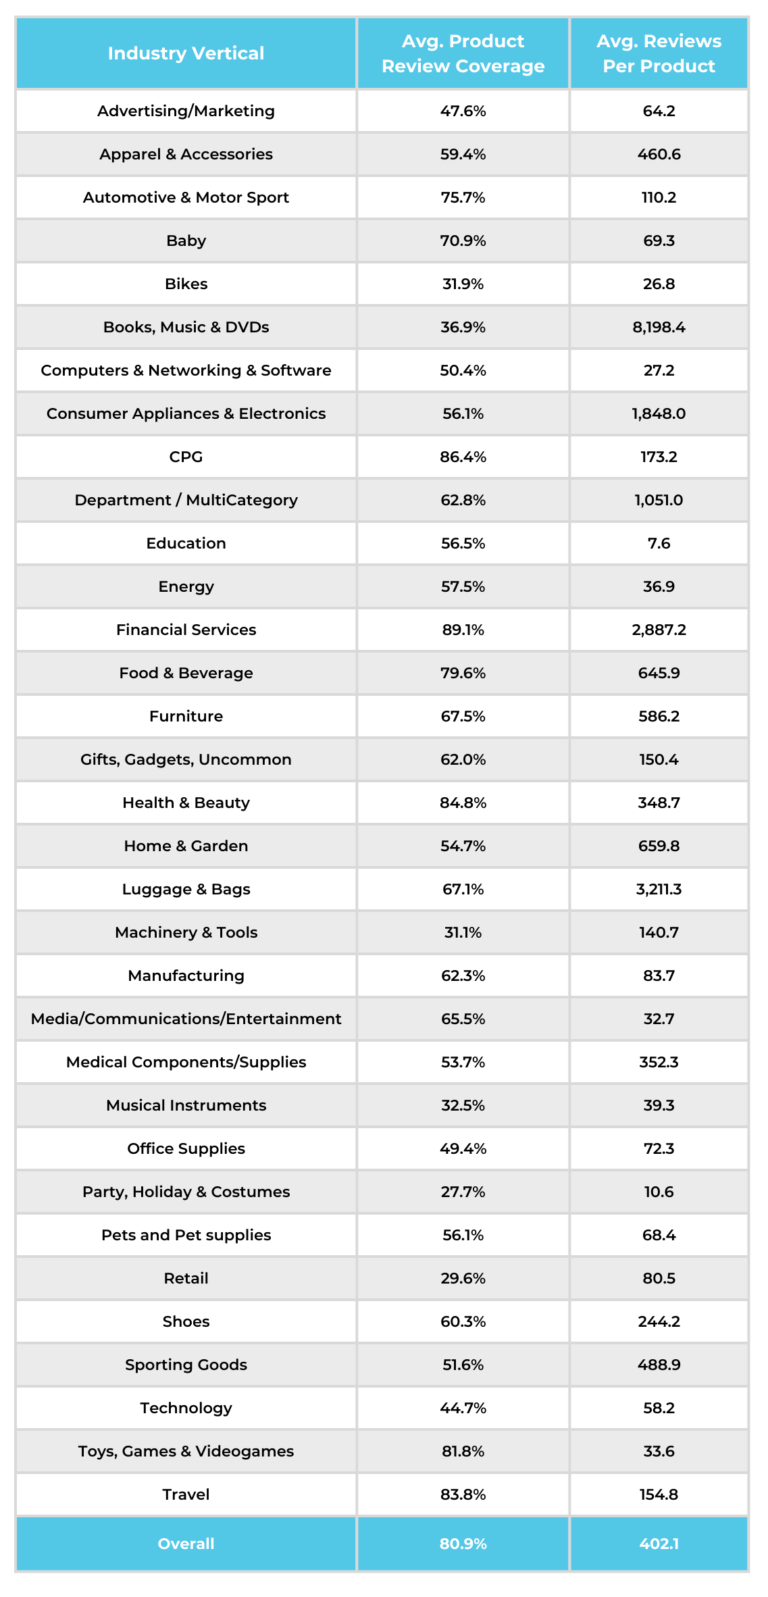
Ratings & Reviews Benchmarks: Review Volume
The Average Product Boasts 402 Reviews, But This Is Still Lower Than Consumer Expectations

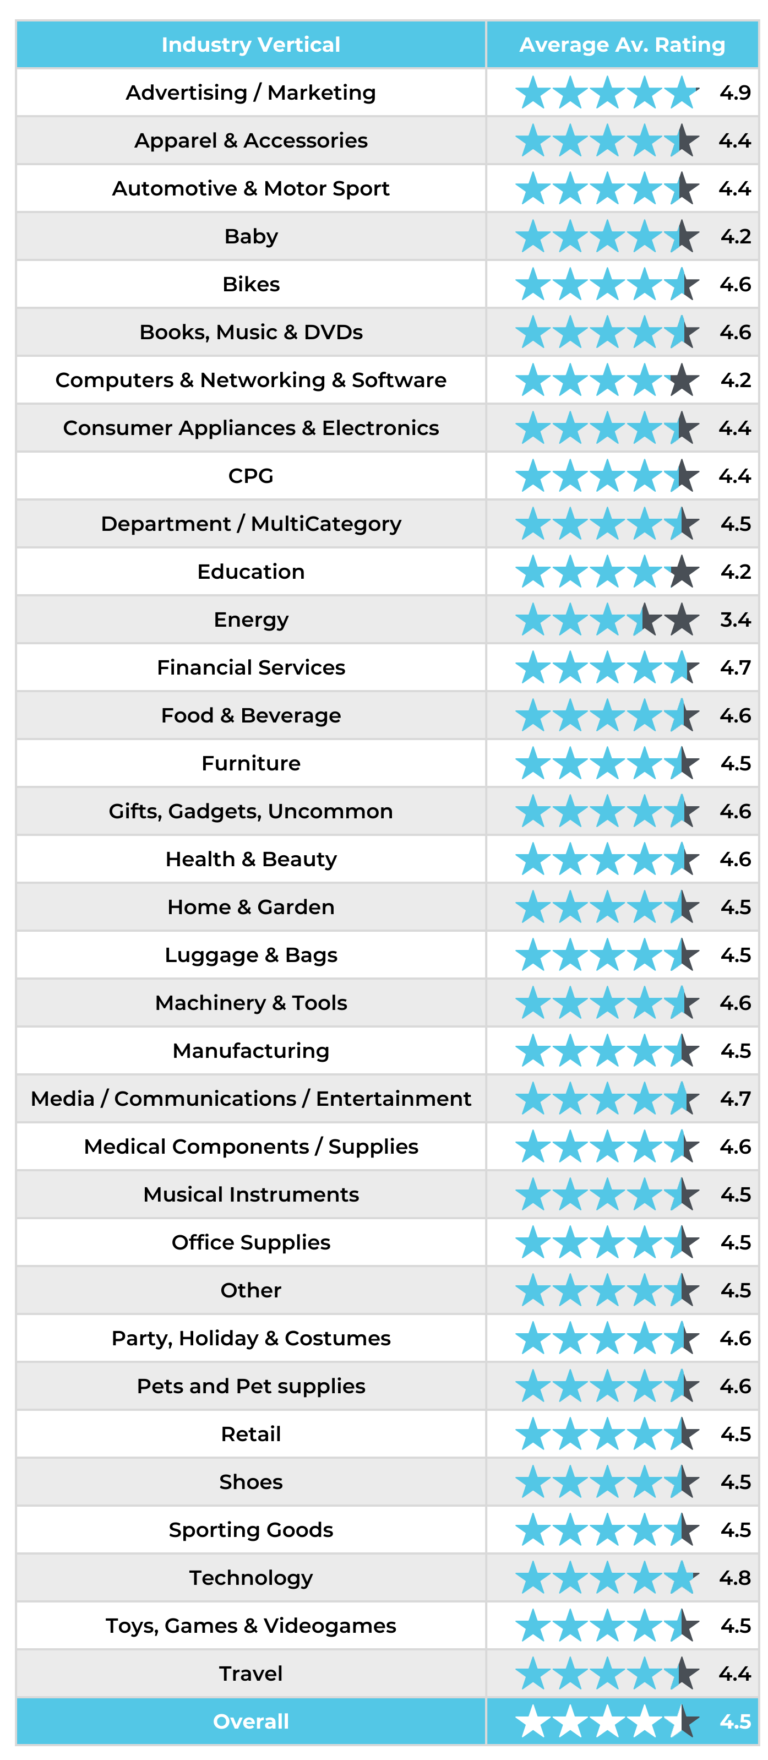
Ratings & Reviews Benchmarks: Average Av. Rating
Across Verticals, Average eCommerce Product Rating is 4.5 Stars

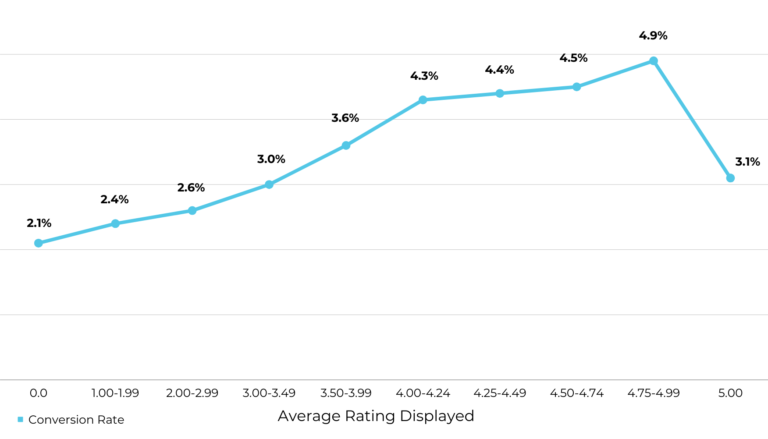
Ratings & Reviews Benchmarks: Average Rating Impact on Conversion
The Sweet Spot for conversion is 4.75-4.99 stars