Study of 7,528 consumers reveals how online shoppers rely heavily on Q&A content when making buying decisions

AUGUST 24, 2021—CHICAGO—Question & Answer (Q&A) content on website product pages eliminates uncertainty, boosts ecommerce sales, and positively impacts purchase behavior, and not having Q&A can be a costly misstep for brands, according to a new survey of more than 7,528 consumers across the US conducted by PowerReviews.

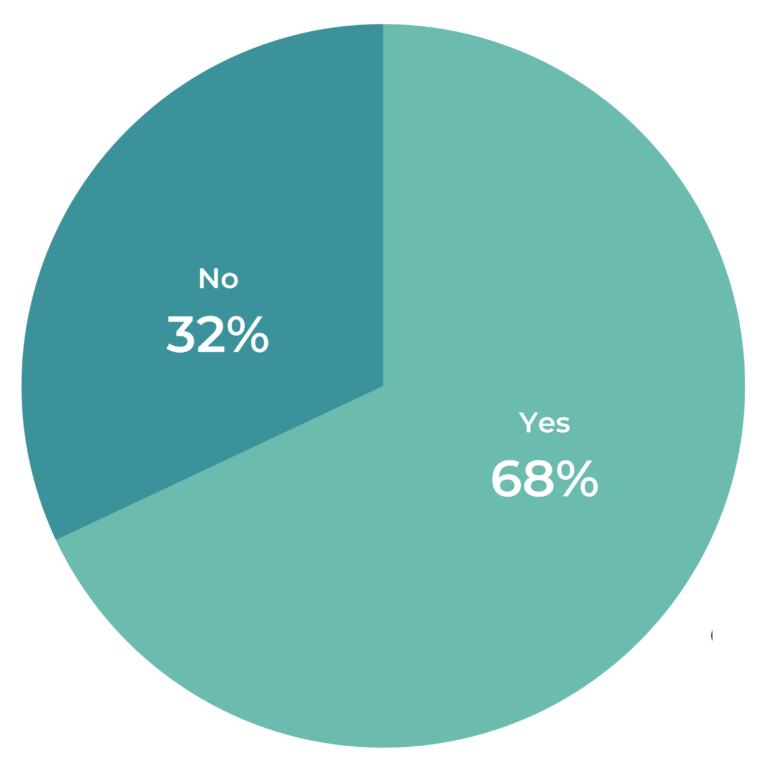
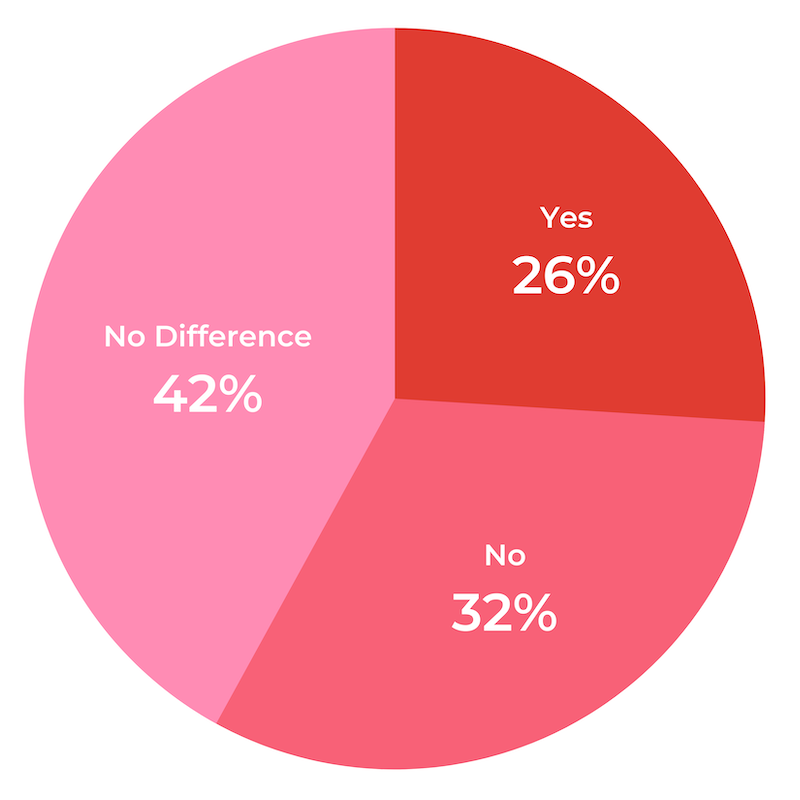
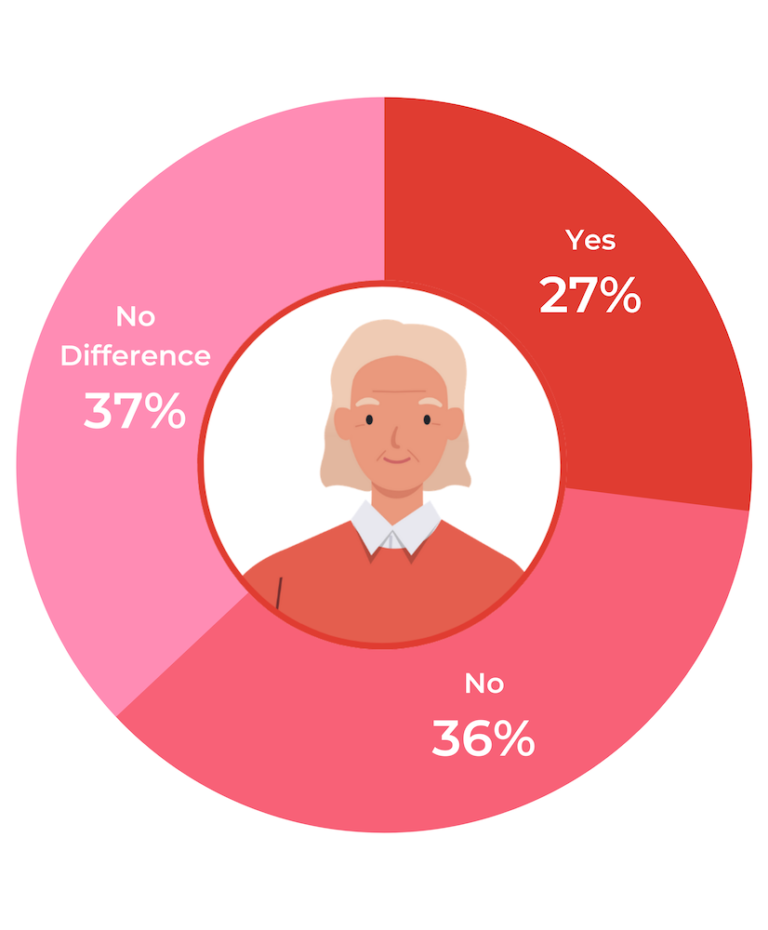
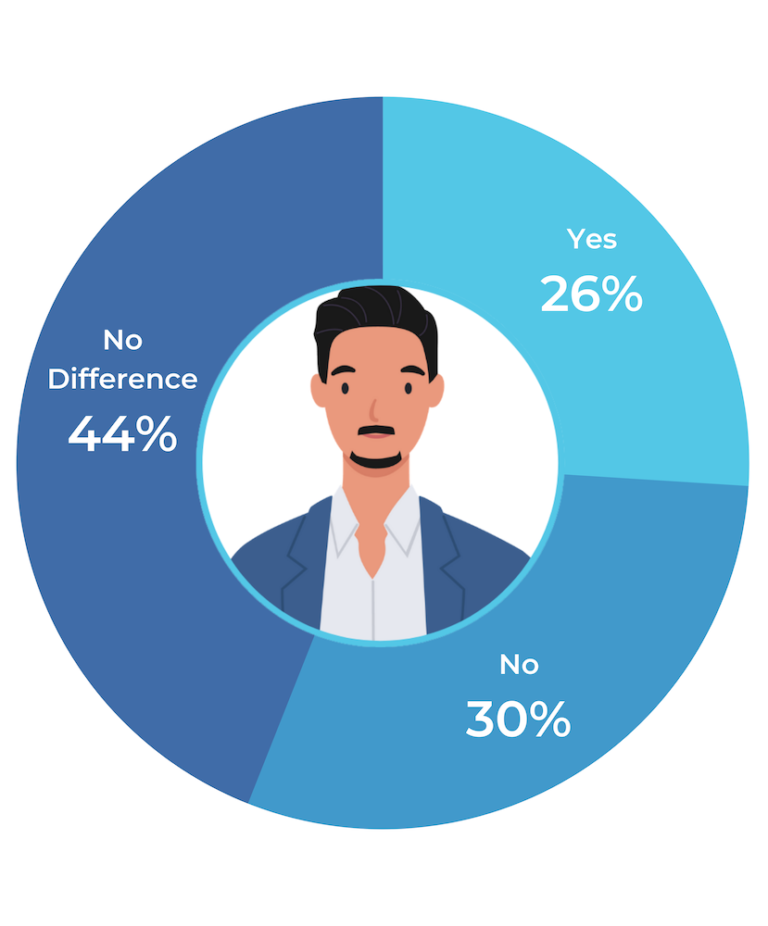
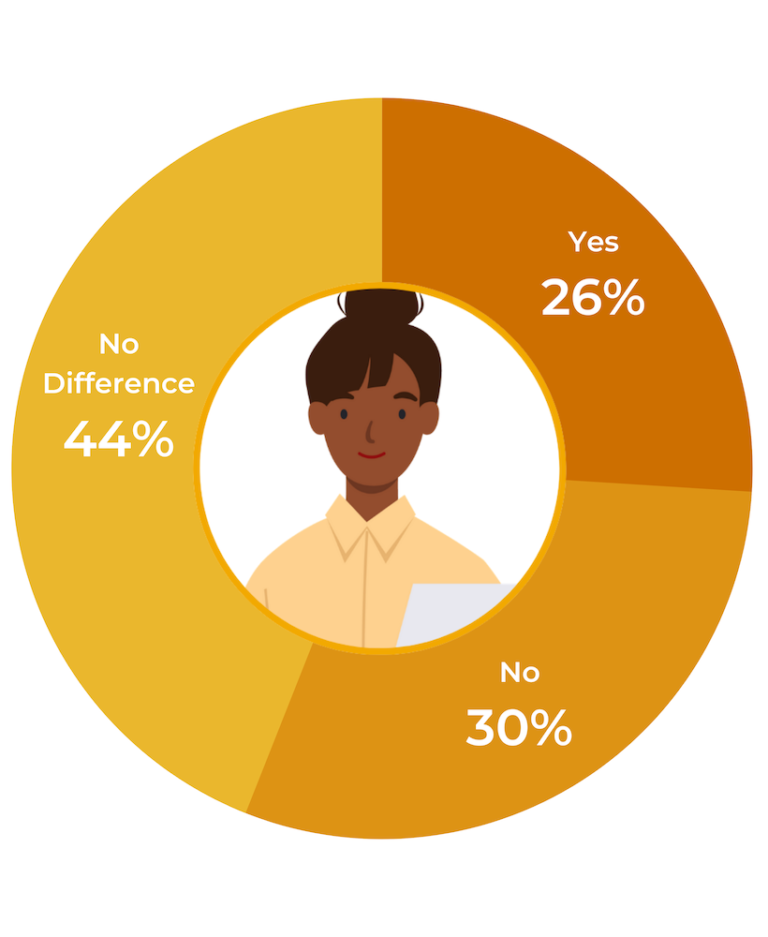
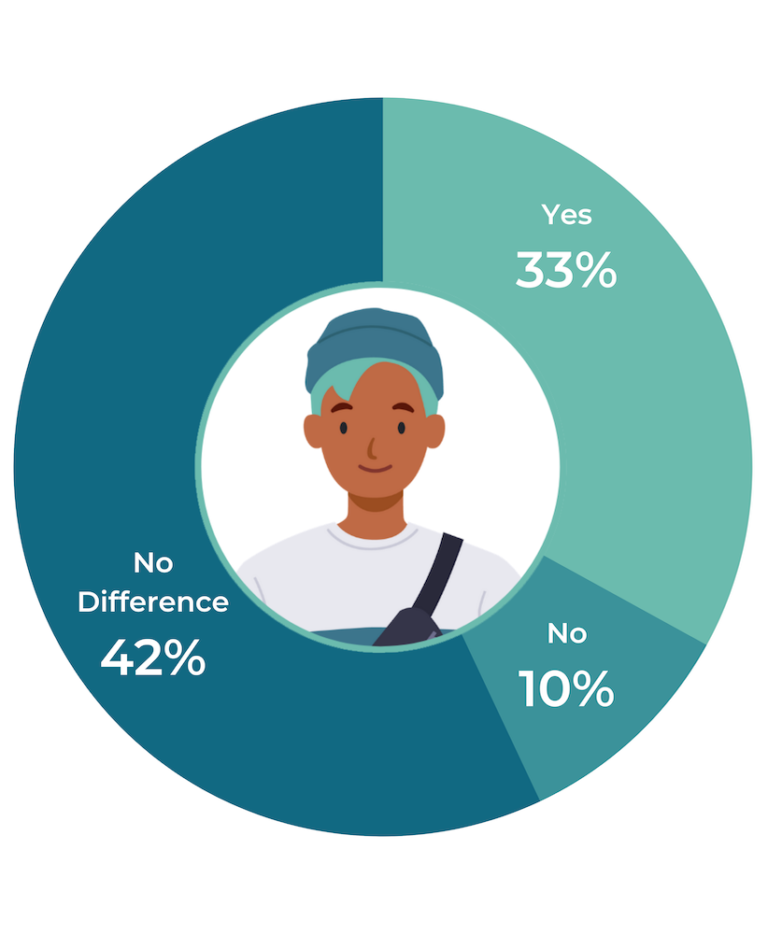
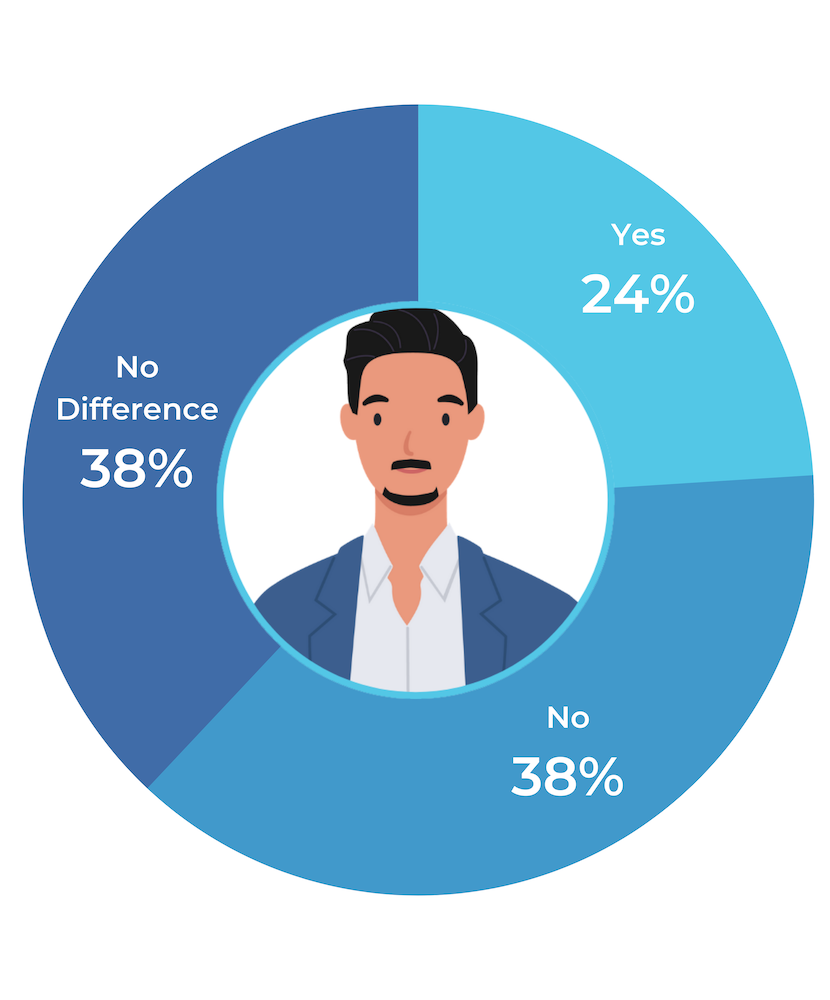
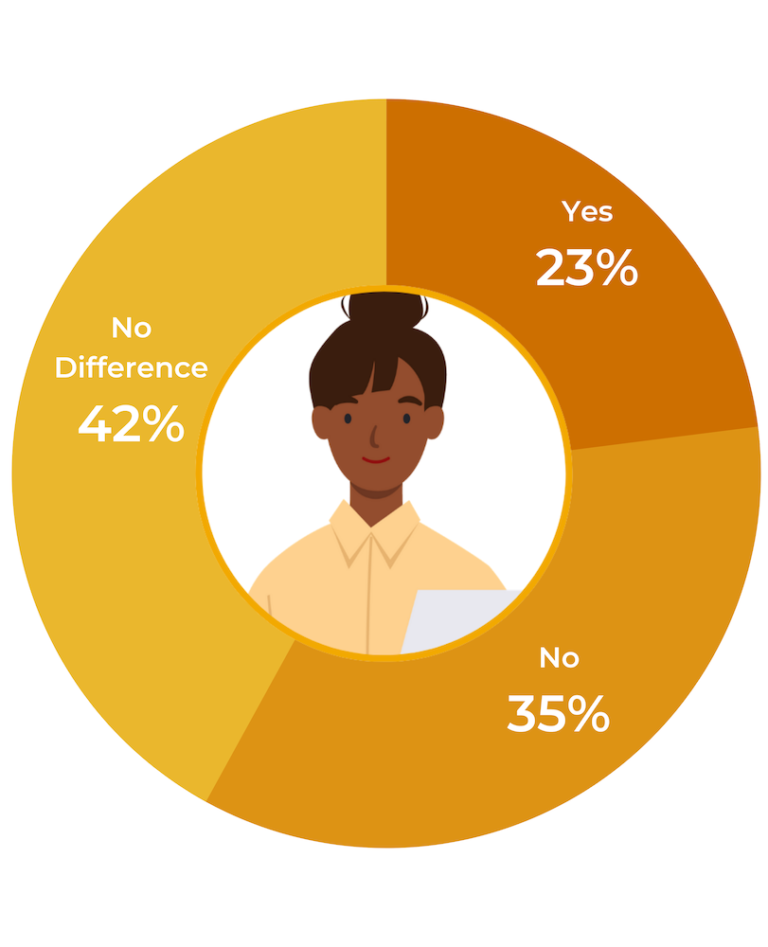
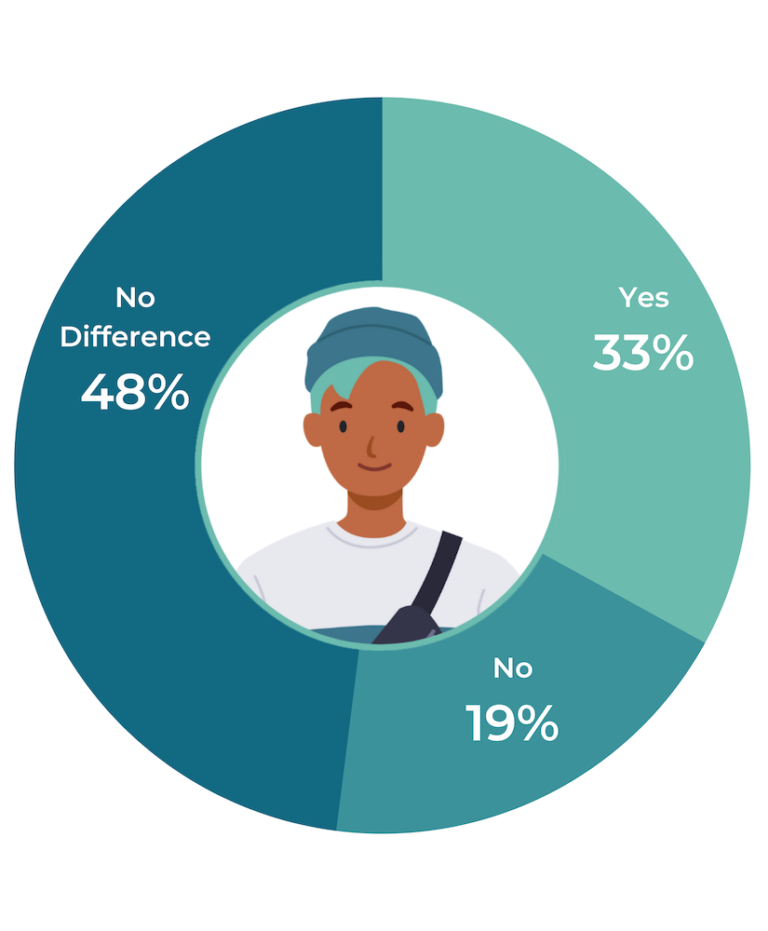
One in four (26%) of shoppers say they are more suspicious about product or brand quality if a product page doesn’t have a Q&A section, and 33% of Gen Z shoppers say they’re less likely to purchase without a Q&A section on the product page. This aligns with research from Forrester, which indicates 55% of shoppers will abandon an online purchase if they can’t find quick answers to their questions.

PowerReviews has long studied the impact of user-generated content on website conversion; a recent complementary analysis found a 157.1% lift in conversion when visitors interact with Q&A, but this is the first time the company has studied the negative sales impact for brands forgoing this content.  

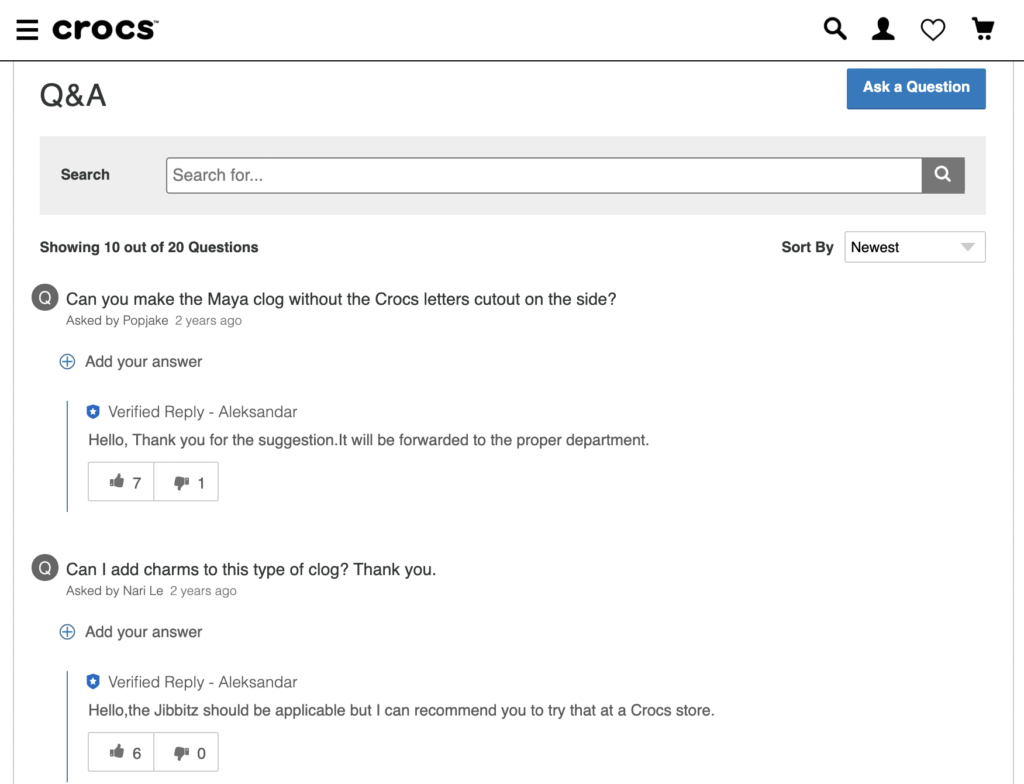
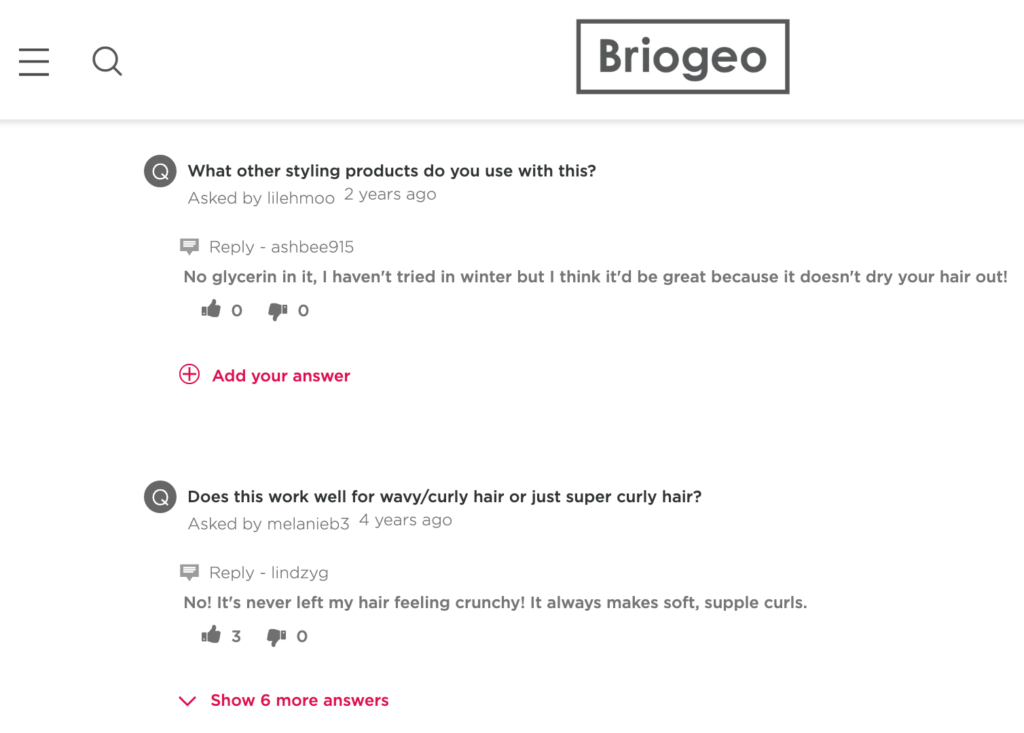
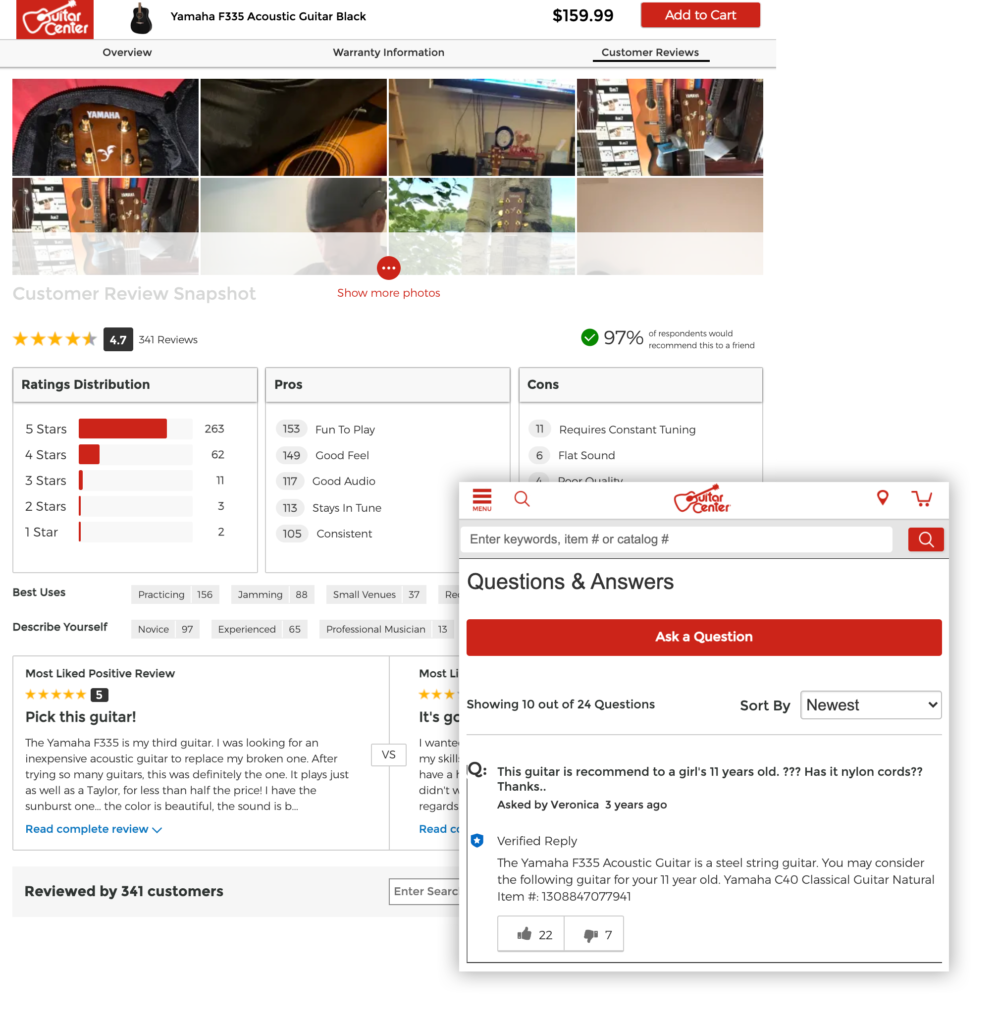
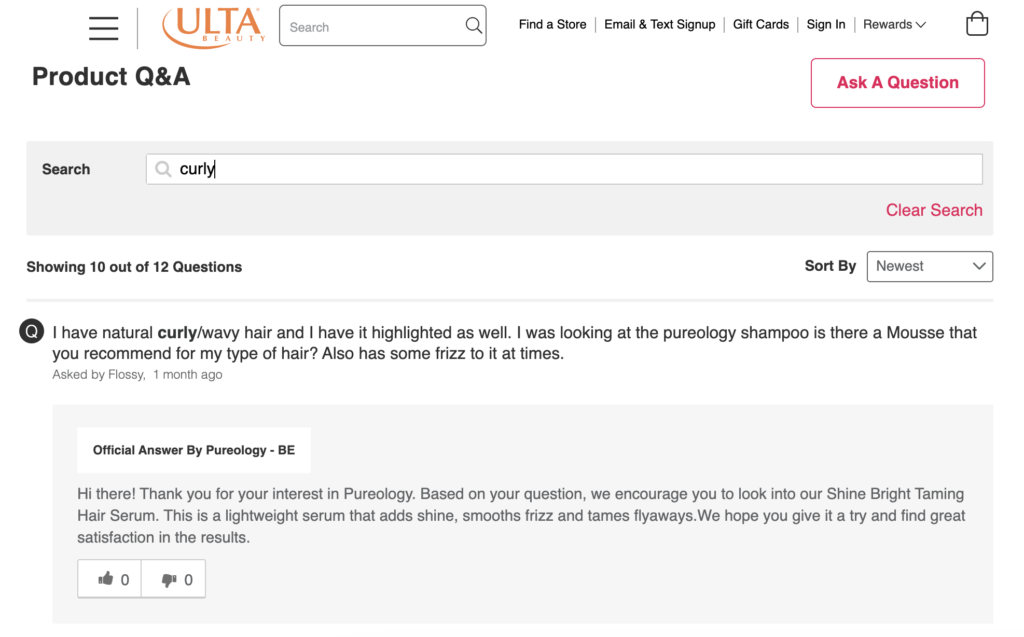
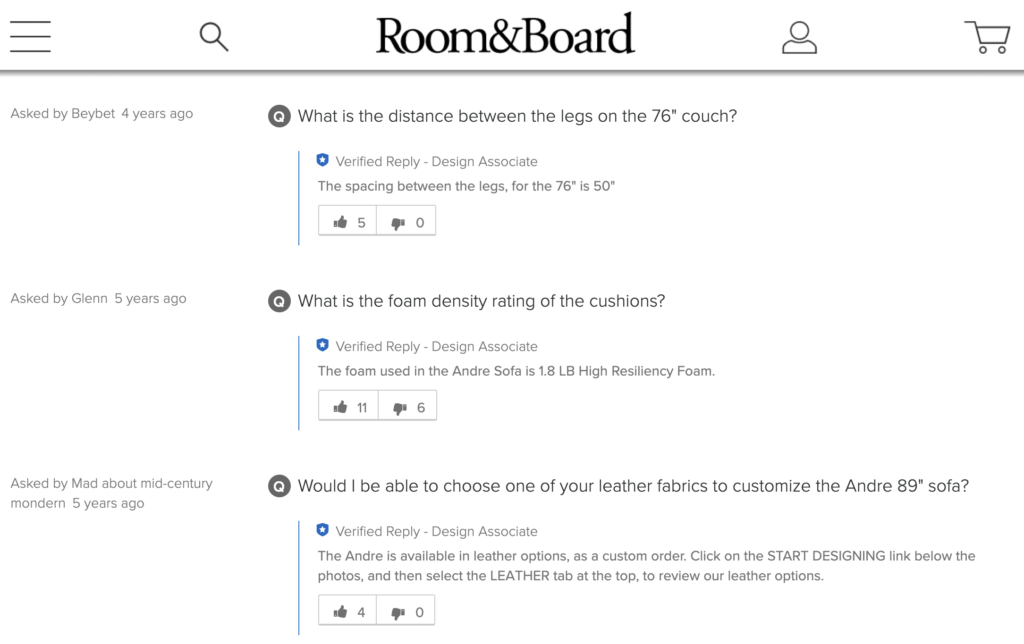
Q&A – the capability for consumers to ask questions on product pages of websites – is a critical tool for brands and retailers in the post-pandemic era, when ecommerce volume is exploding. When shopping in a brick-and-mortar store, consumer questions can be answered simply by seeing and touching the product live. And if they still have questions, they can seek out a sales associate to get answers. When consumers shop online, they rely heavily on Q&A in lieu of physical and in-person due diligence.

Additional findings from the PowerReviews “How Q&A Eliminates Uncertainty” survey include:

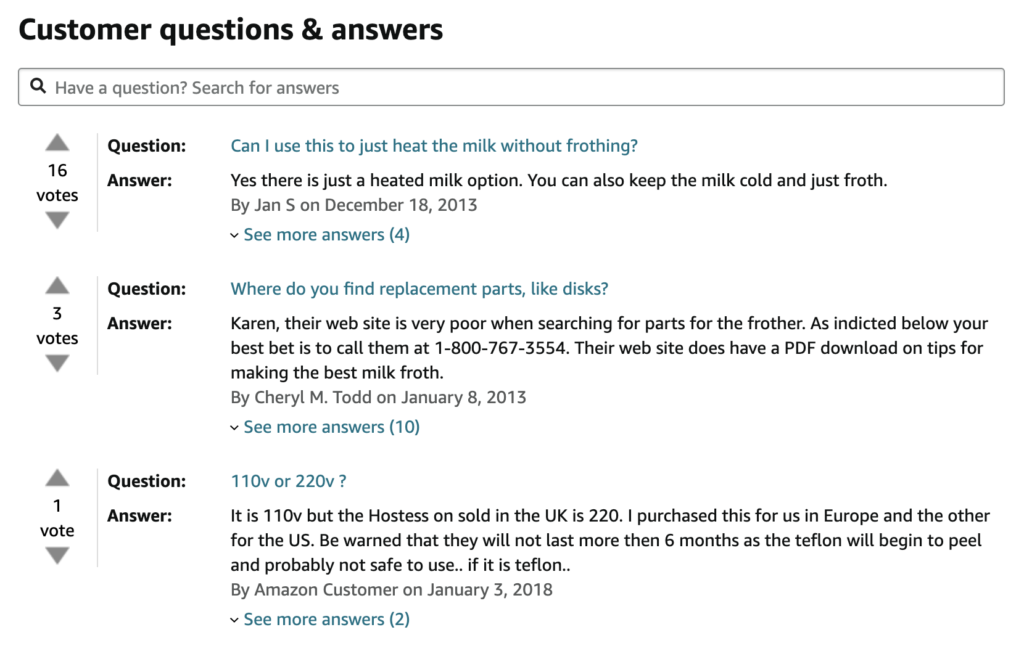
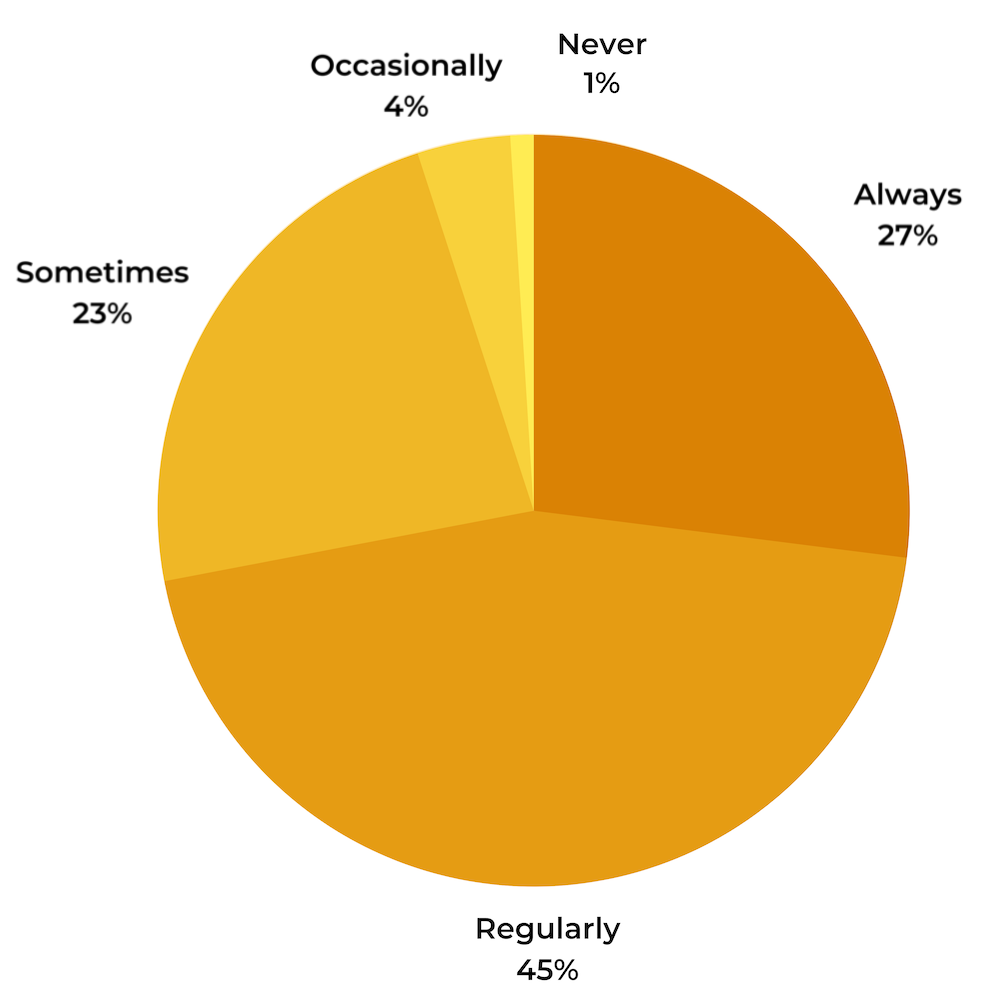
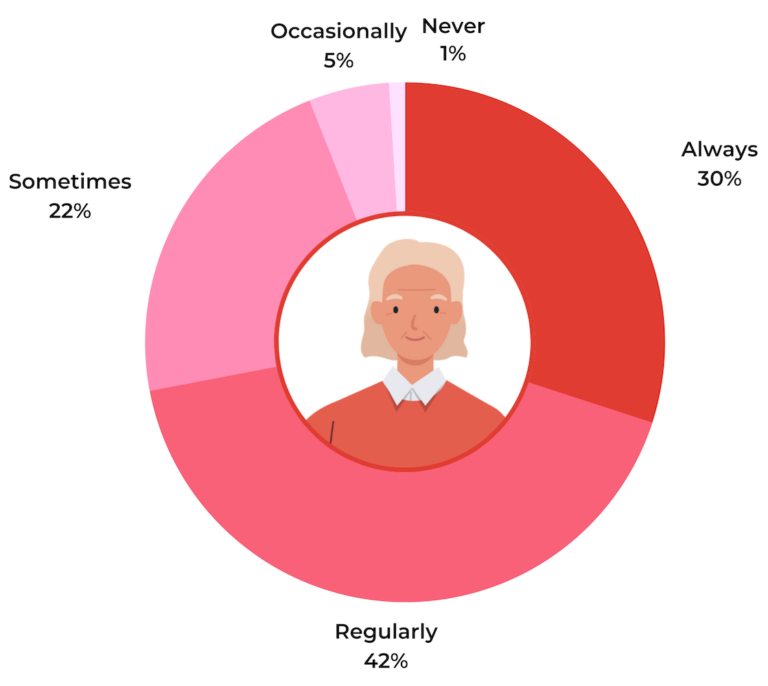
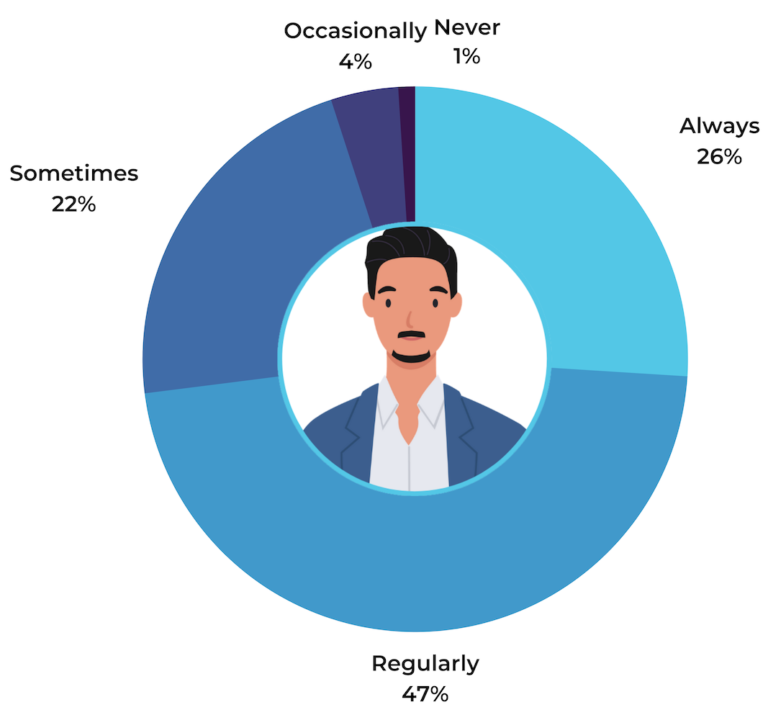
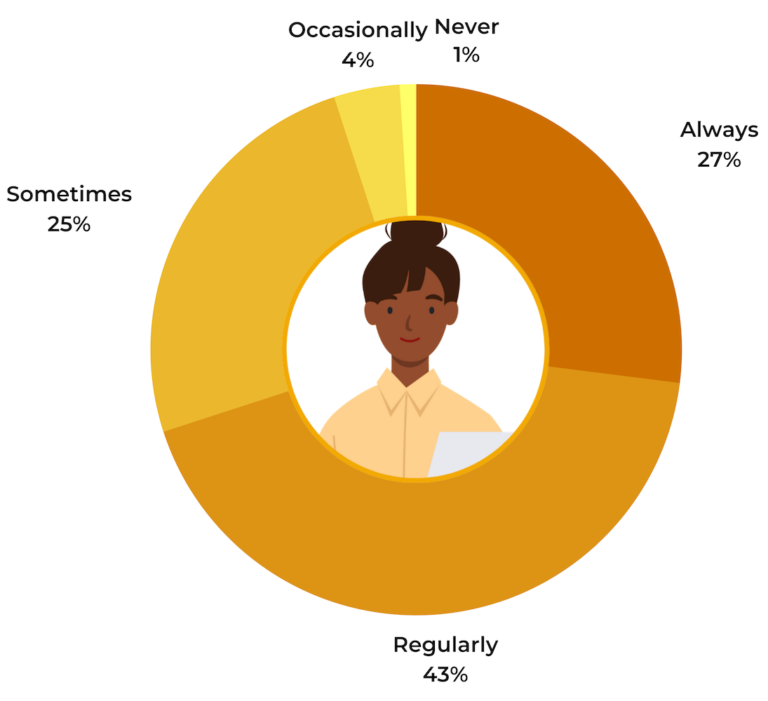
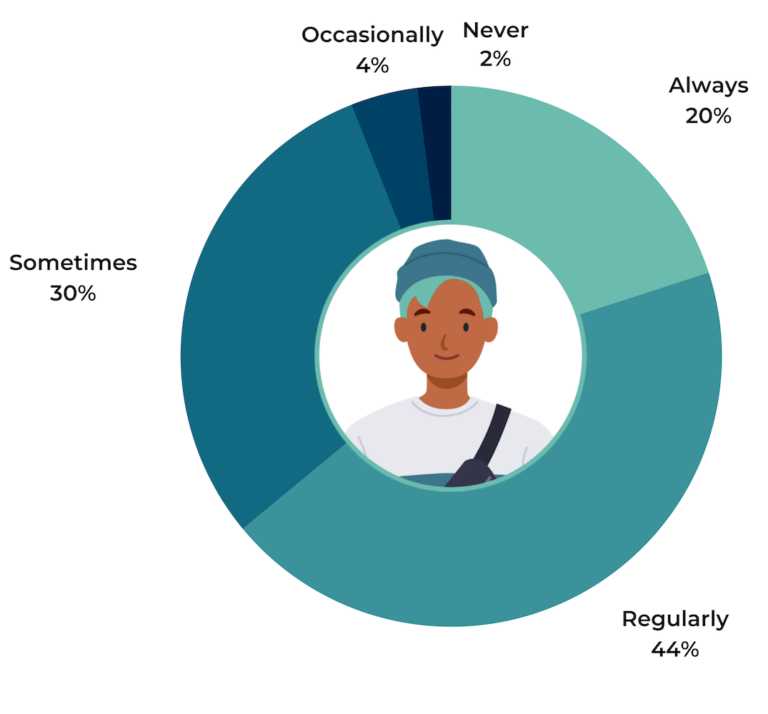
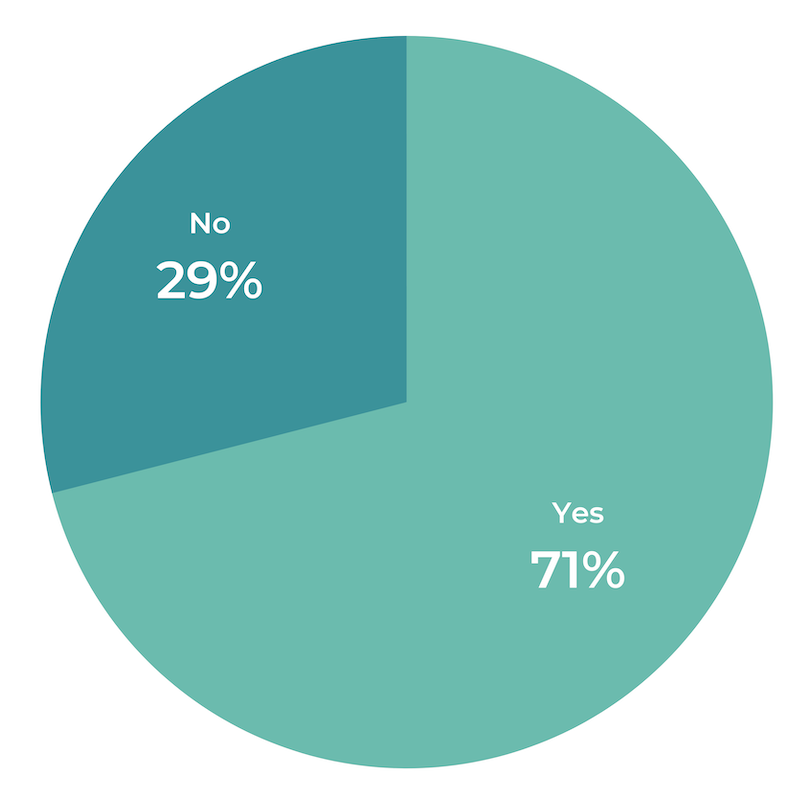
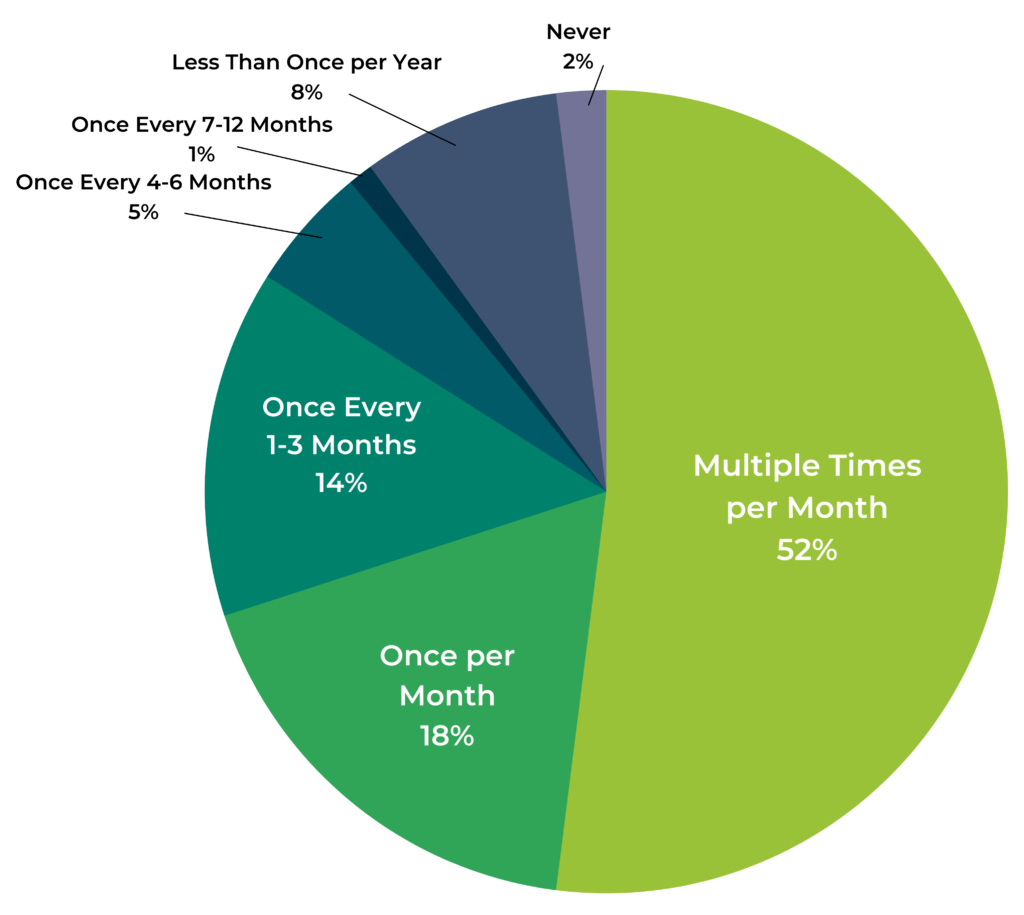
  • Key research material: 99% of consumers read Q&A at least occasionally; nearly three-quarters (72%) read Q&A always or regularly. 
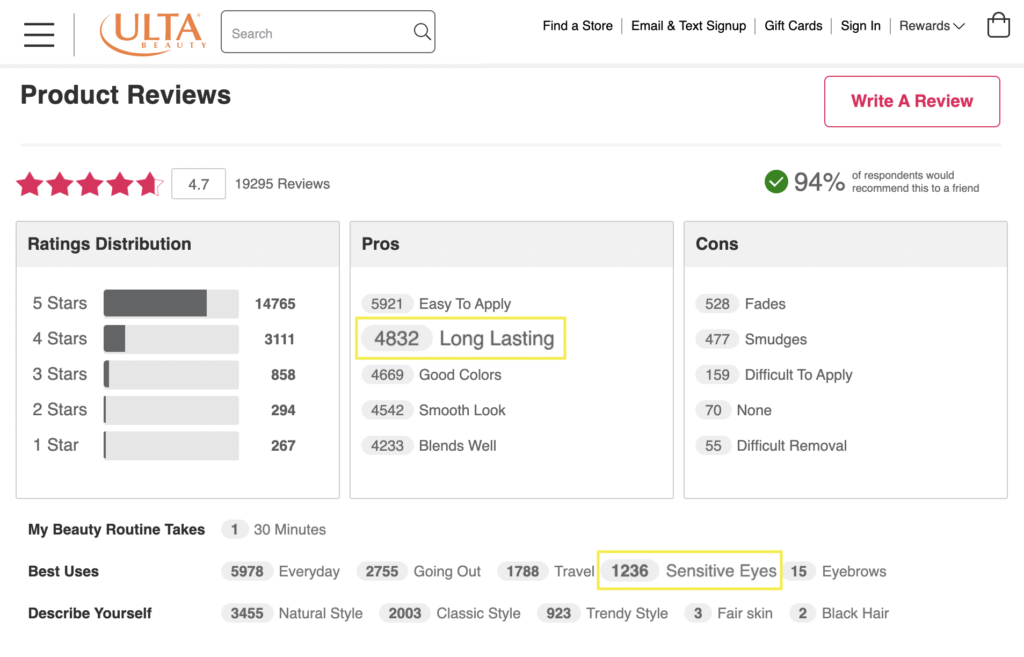
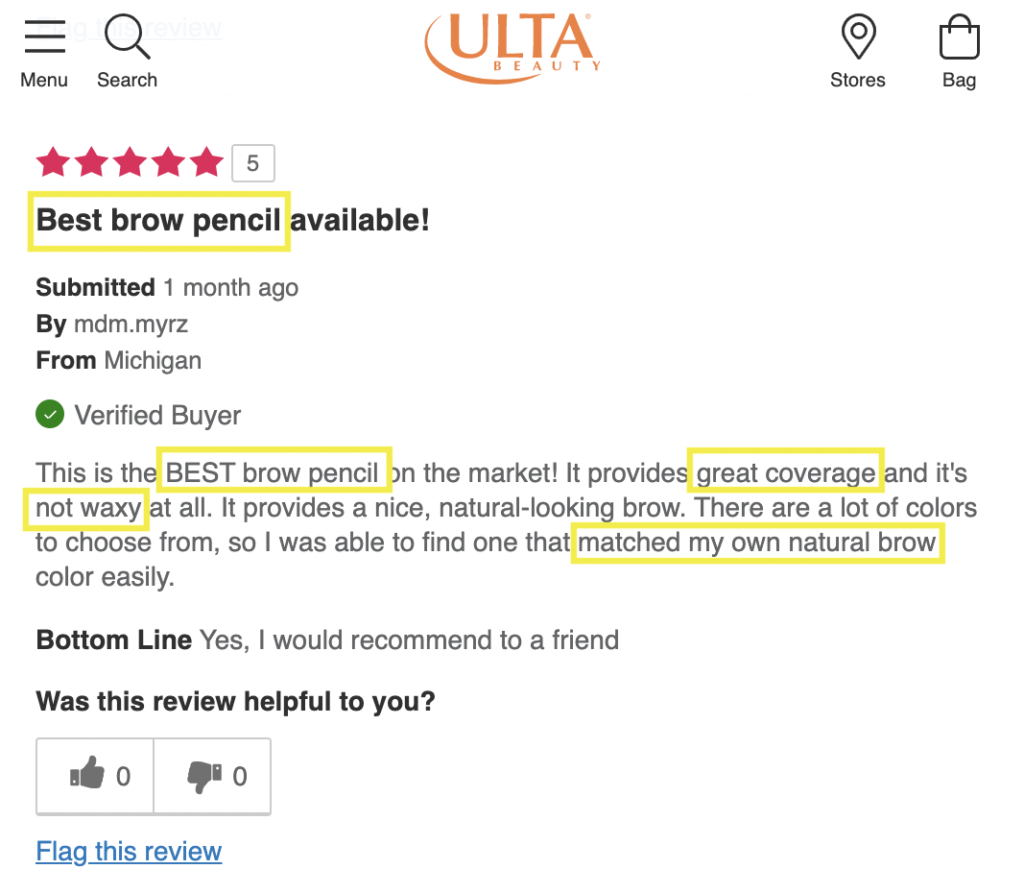
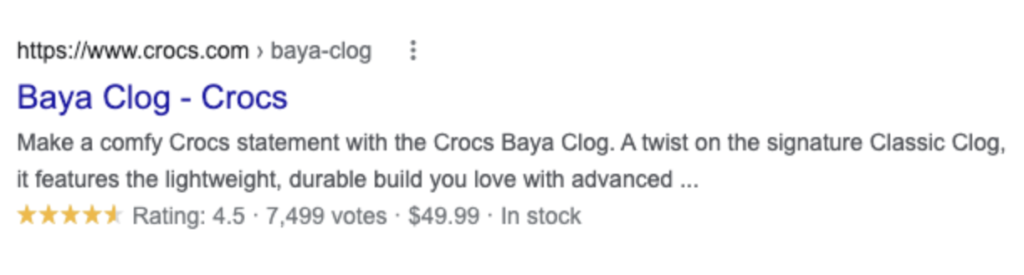
  • Q&A content complements ratings and reviews: Of consumers who read Q&A, 98% do so in conjunction with reading reviews.
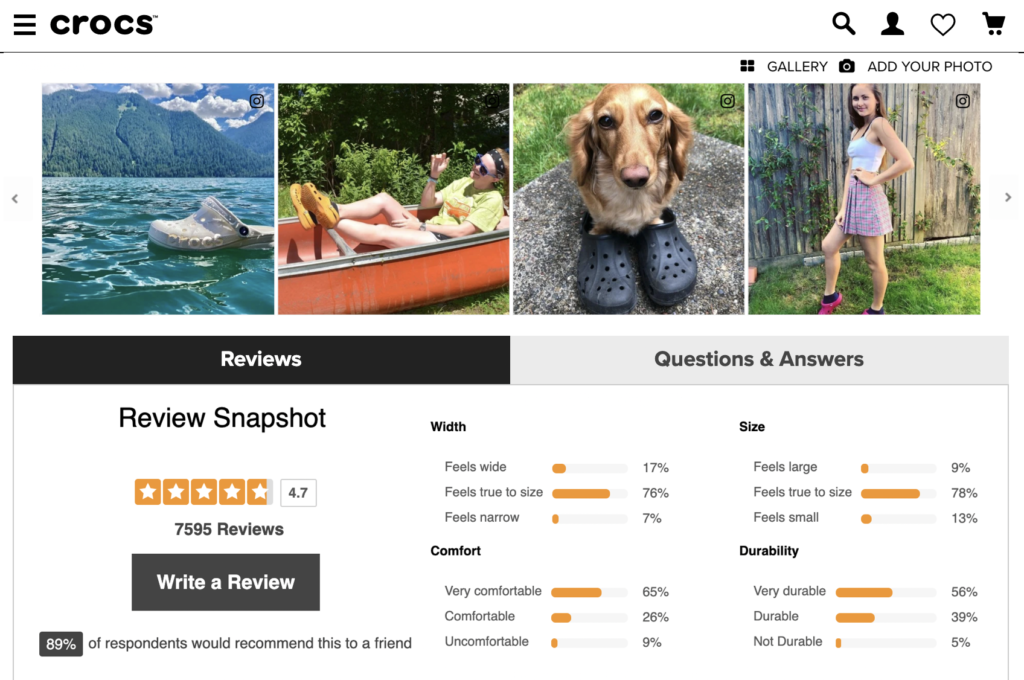
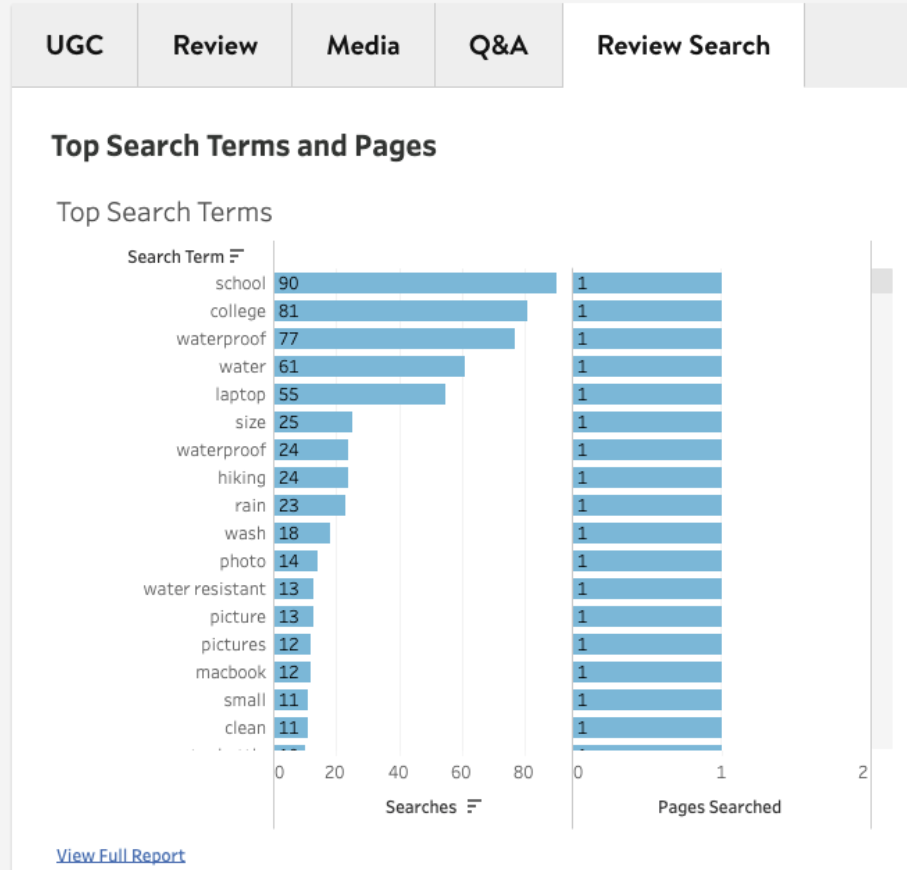
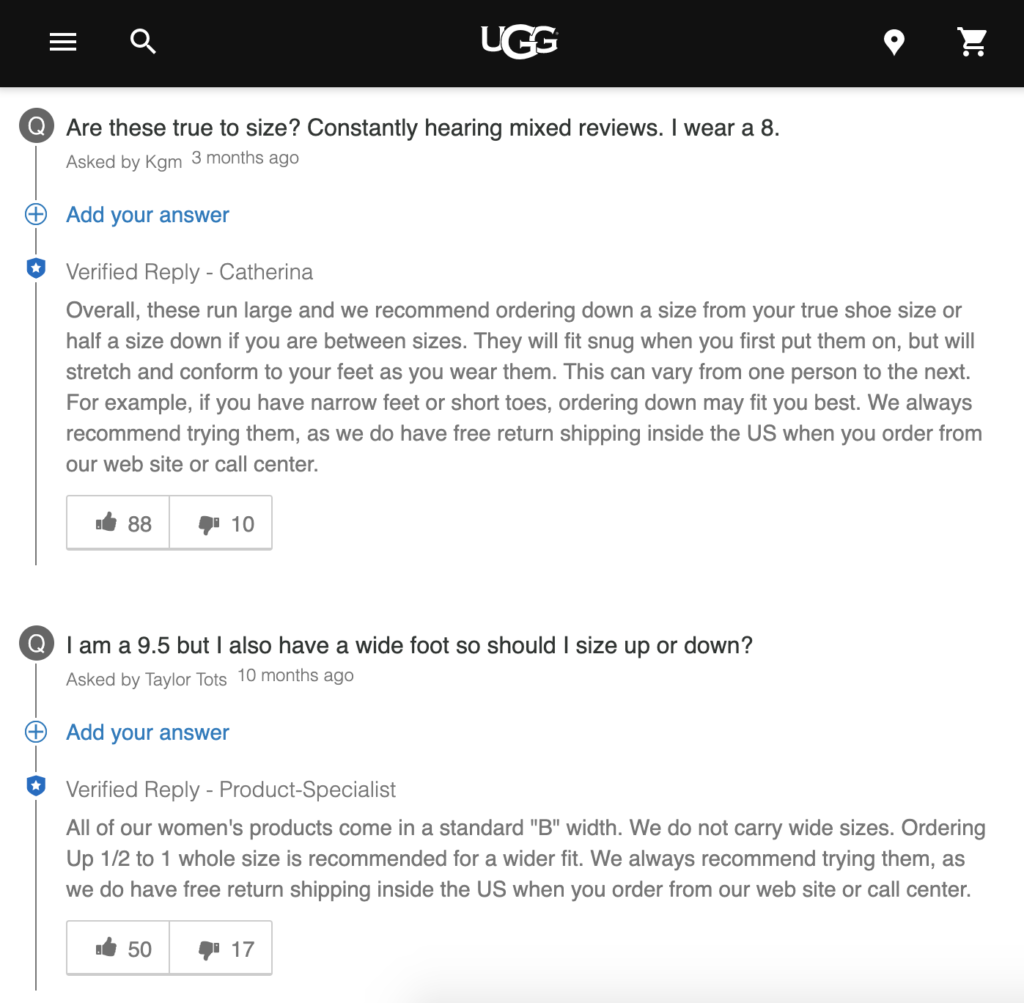
  • Q&A addresses many needs: 58% consult Q&A to get a better sense of size/sizing – this is particularly relevant for apparel/footwear purchases. Many rely on Q&A to understand other shoppers’ experiences with product aspects including product warranty (28%) and shipping (23%). 
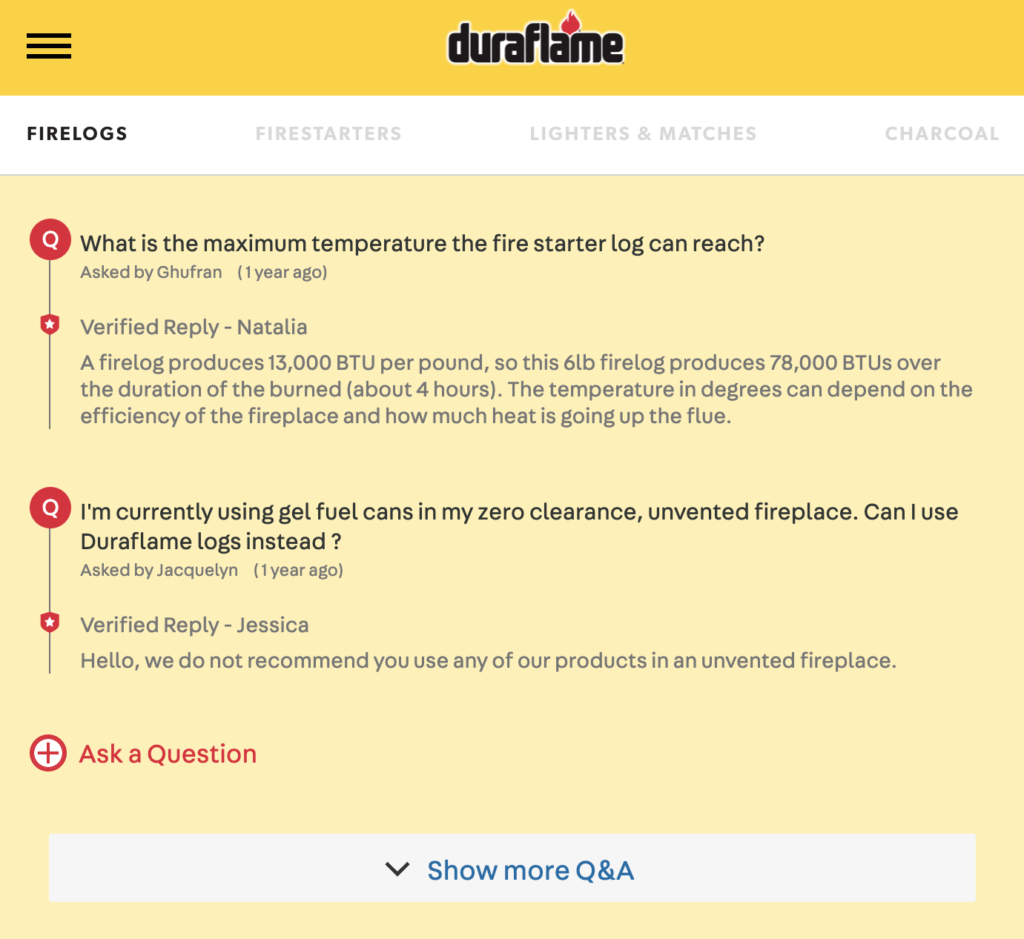
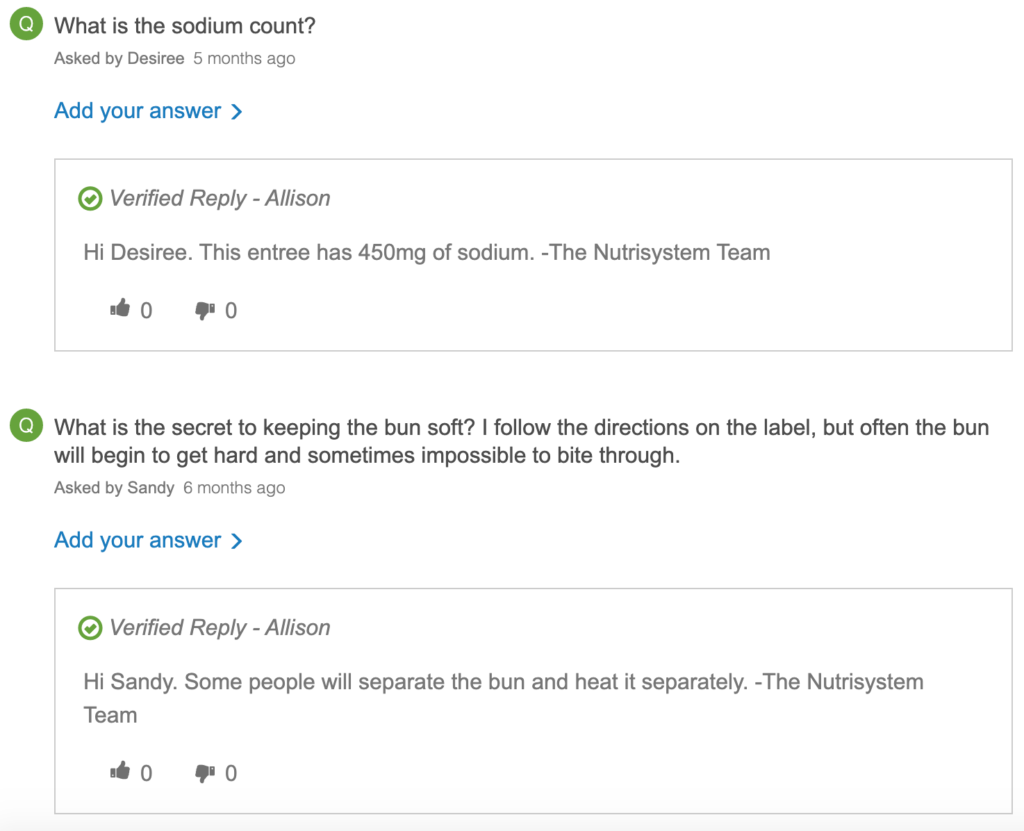
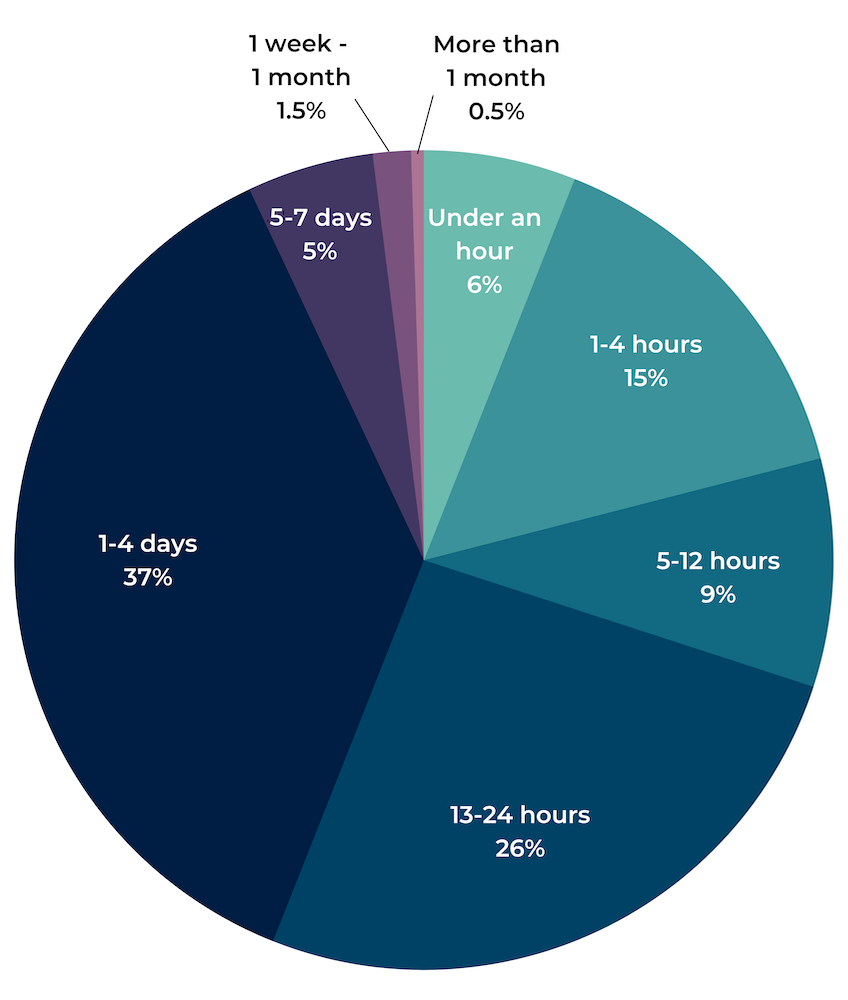
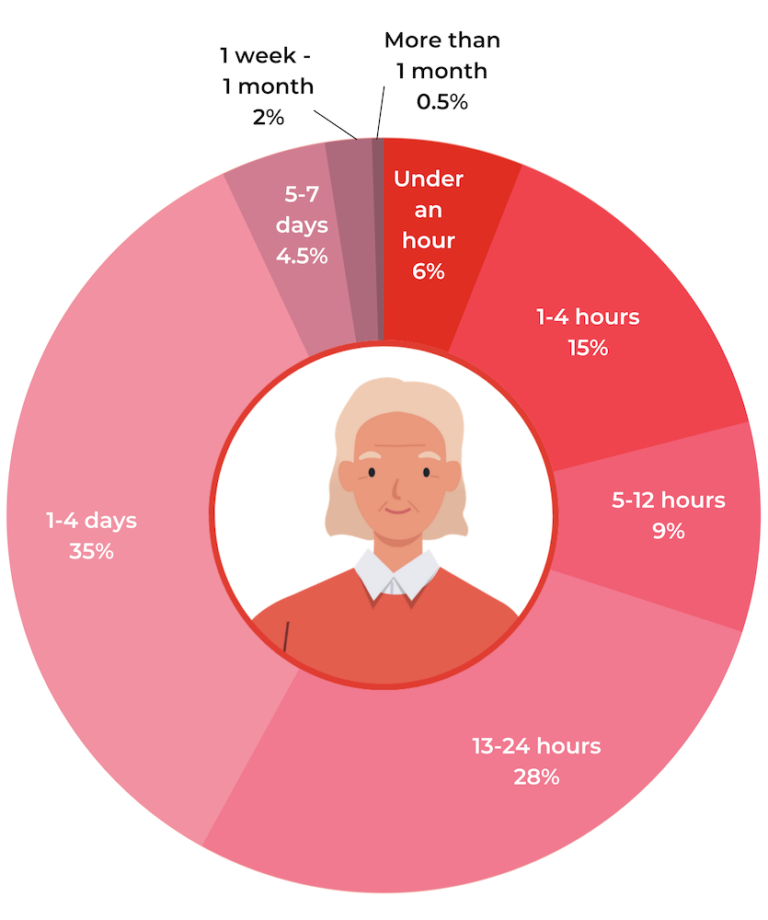
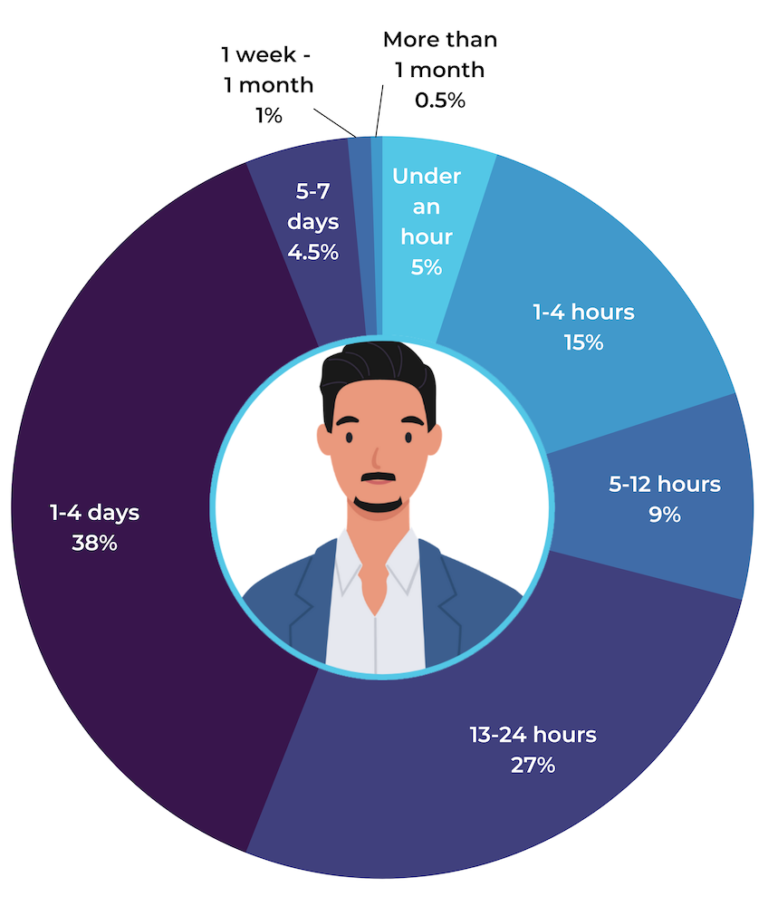
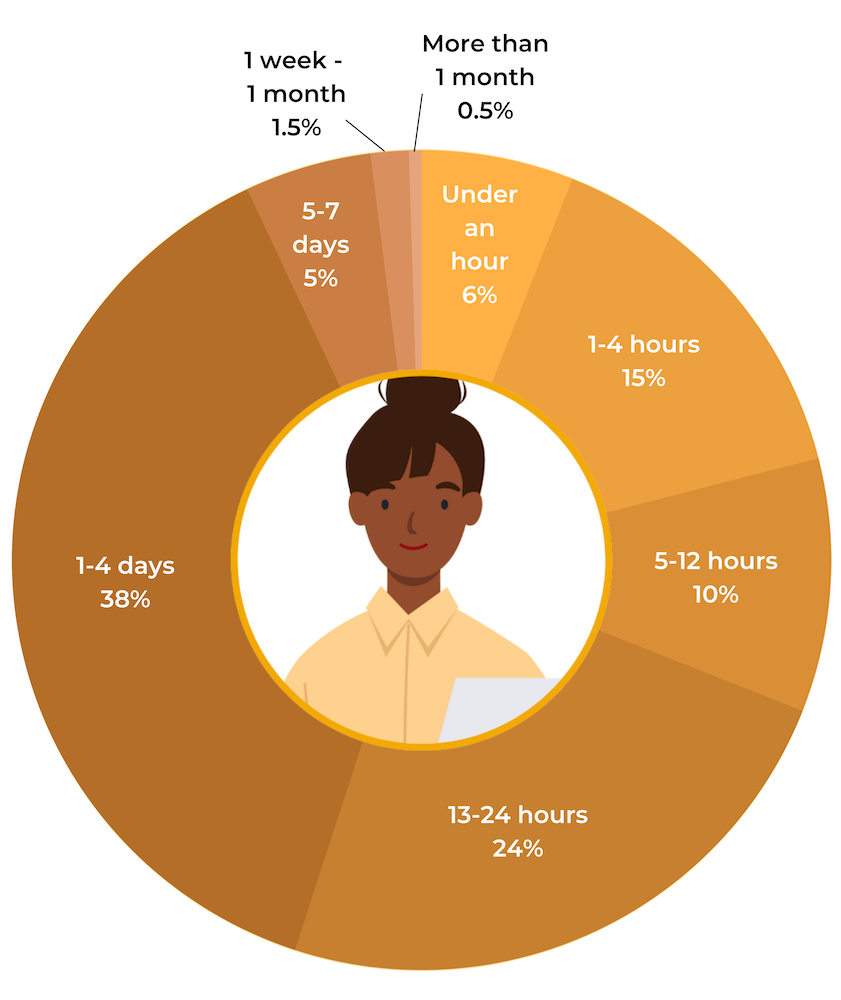
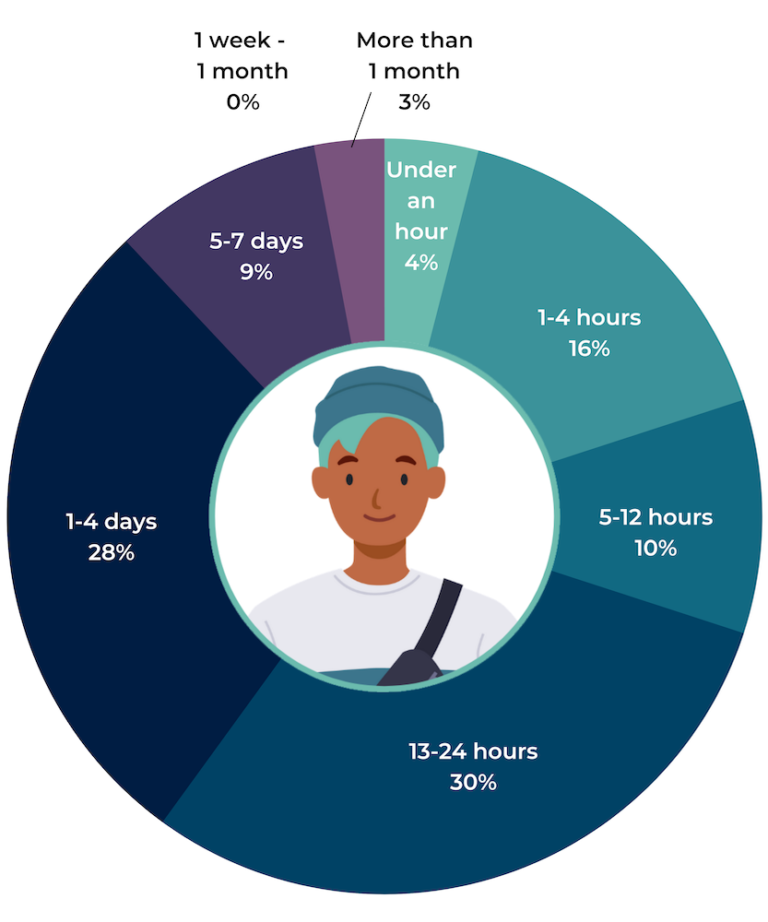
  • Consumers expect fast responses to their questions: 56% expect to get an answer within 24 hours, and 21% expect an answer in four hours or less.
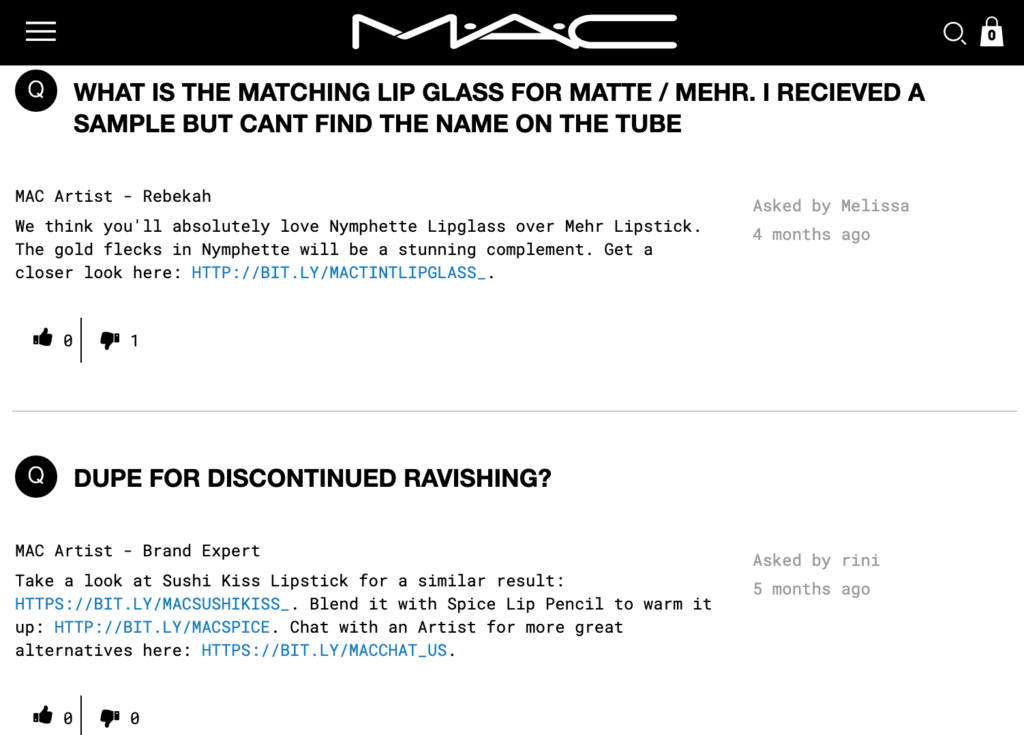
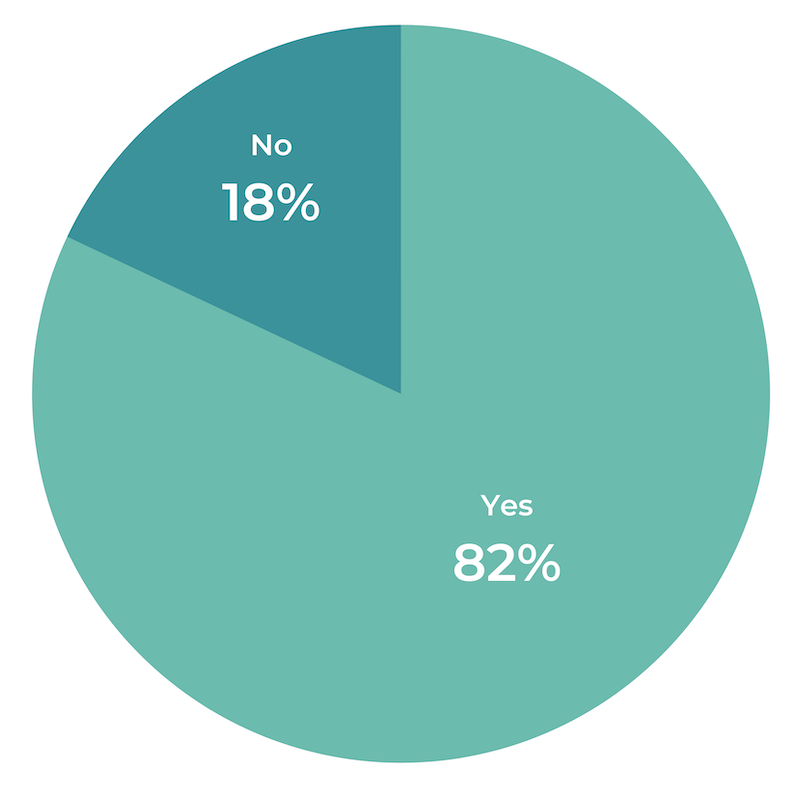
  • The answerer matters: When browsing Q&A content on product pages, 82% say they pay attention to the small print detailing who provided the answer response.

Andrew Smith – VP, Marketing at PowerReviews, says:

“Many brands and retailers fail to prioritize Q&A and – based on our survey data – that is a massive mistake. No matter how comprehensive your product pages are, there’s no way to anticipate each and every question customers will have. It’s imperative to provide shoppers with a mechanism for getting any additional information they seek.

“Engagement with Q&A is a strong signal of purchase intent. If shoppers are compelled to ask a question, they have a high interest in the product, so it’s not surprising that consumers interacting with this content are so likely to convert.

“Outside of the online conversion benefits, product Q&A is a fantastic resource of consumer sentiment. Analyze this content to better understand how to position the product or how to develop it to match customer need, while gaining an oversight of new and emerging trends in the marketplace.”

Research Methodology

The PowerReviews How Q&A Eliminates Uncertainty consumer survey draws on responses from 7,528 shoppers across the United States who have opted into offers and discounts from retailers. The survey took place in June 2021. Throughout the survey, we defined Boomers as born in the years 1946 to 1964 (aged 56-74 on Dec 31, 2020), Gen X as born in the years 1965 to 1980 (aged 40-55 on Dec 31, 2020), Millennials as born between 1981-1996 (aged 23-38 on Dec 31, 2020) and Gen Zers born in or after 1997 (ages 22 and younger on Dec 31, 2020).

ABOUT POWERREVIEWS

PowerReviews (PowerReviews.com) is a conversion-first UGC vendor obsessed with helping brands and retailers grow their businesses. PowerReviews enables these organizations to generate better quality customer product ratings and reviews in larger volumes and then analyze and benchmark all this data to optimize their UGC programs for conversion while improving product quality and customer experience.

PowerReviews is headquartered in Chicago, IL, USA.

Media Contact

Erin Lutz 
Lutz Public Relations & Marketing (for PowerReviews)
erin@lutzpr.com
949.293.1055

Paige Thulin

Power Points:
  • Fresh UGC is essential to SEO. From reviews and Q&A to user-submitted images and video, UGC provides Google with a steady stream of fresh, keyword-rich content

  • Keywords are the foundation of product page SEO. If you want to improve your product’s rank, you need to include keywords in your title tag, meta description, H1 tag, and product description.

  • Additional product page SEO best practices include marking up images with alt text, using a clear URL structure, and implementing schema markup. 

As any marketer will tell you, there’s an art to crafting the perfect product page. You need to design with all the best practice acronyms in mind — CRO (conversion rate optimization), UX (user experience), and SEO (search engine optimization) — and then you need to account for the unique needs of your users and your brand.

Today, we’re focusing on the third of those acronyms: SEO (search engine optimization). 

Here are the 5 essential SEO elements to include on your product pages for improved rankings, traffic, and conversions.

1. UGC is good for SEO

First off, we’re a Ratings and Reviews company and we know all about the importance of UGC from an SEO perspective.

The top search results always feature product pages with lots of reviews and a good rating. That’s because Google knows people are looking for the best product, and reviews and ratings help Google determine that.

But reviews are just one aspect of user-generated content, or UGC. There’s also Q&A and user-submitted images and videos. Together, all three forms of UGC are essential to product SEO for a few key reasons:

  1. UGC provides additional content for the search engines to gobble up. The more content Google has, the better their understanding of your site.

  2. That content is often keyword-rich. Customers include all sorts of key phrases in their reviews, more than you could ever include in a snappy product description.

  3. The content is being generated on a regular basis, signaling to Google that your page is still relevant to people searching for these keywords.

Plus, people WANT to see UGC. 88% of shoppers specifically look for images and videos provided by other consumers before making a purchase, and after interacting with UGC, they become twice as likely to convert.

The takeaway? Give the shoppers what they want! 

Crocs features all three UGC elements on their product pages, with an interactive photo gallery, and a searchable Q&A and Reviews section.

Crocs product pages feature interactive image galleries and searchable reviews, along with specific ratings related to key words
Crocs product pages feature searchable Q&A sections for customers needing additional info

Ulta Beauty’s Reviews section includes clickable filters that make it easy for shoppers to hone in on reviews from people like them.These filters also highlight keywords that are relevant to Google, helping Google connect the dots that this product is good for someone with “sensitive eyes” or anyone looking for a “long lasting” eyebrow pencil.

Ulta reviews use filters to help customers find long lasting brow pencils or options for people with sensitive eyes

If you dig into the reviews, you’ll notice plenty more keywords. Take a look at how many we highlighted in this one: 

Reviews are a great source for keywords that help boost your product's SEO

It’s no wonder a recent study found that having keywords in your reviews is one of the top ranking factors for product pages! 

2. Use keywords in all the right places

Keywords are the foundation of SEO. Whether it’s “waterproof hiking jacket” or “color safe shampoo,” keywords are the words people use during discovery and it’s important to use them when describing your products.

If you want to increase your visibility in search engines, you’ve got to include keywords in all the key places (see what we did there?) on your product page. Your customers will already take care of keywords for you in your product reviews. Where else can you include them?

  • Your title tag
  • Your meta description
  • Your H1 
  • Product description

Title tag

Your title tag appears alongside your Google search result in Google. It lives in your site code, so you’ll never see it unless you go to Google. You can fit about 55-60 characters of text in your title tag.

Many retailers simply copy and paste their product name, but this is a chance to speak directly to what searchers are looking for. iRobot does it best, with a combination of their product name, and the keyword “best robot mop”:

google search for best robot mops shows irobot product based on title tags
Including keywords in your title tag is a great way to boost your listing in search results.

Meta description

Your meta description is the two lines of text that appear beneath your title tag in the Google search results. Like your title tag, it lives in your site code, not on the front-end of your product page.

Together, these two elements serve as a virtual billboard — advertising your product to people in the search results. Will your billboard encourage people to click, or to scroll on by? Add keywords, and they’re more likely to click. 

It’s common for Google to auto-generate their own meta description using text on the page. Still, it’s a best practice to write your own so you have more control over how your brand appears in the search results. You can include up to 160 characters. 

Vistaprint knows that people use a variety of keywords to describe their products, from “custom address stickers” to “return address labels.” They include them all in their title tag and meta description:

Google search where the meta description for a Vistaprint listing includes address lables
Writing your own meta descriptions gives you more control over how your brand appears in search results. Vistaprint takes full advantage of this.

H1 tag

On the page itself, you probably have a big bold heading that puts your product name in bold. This is your h1 tag, and it’s one more area where you can incorporate a keyword. 

For example, by adding the word “golf,” Bonobos is able to help Google differentiate between this performance polo and their other performance polos when people are searching for golf polo shirts.

Bonobos includes golf as a use case in the h1 text for this polo shirt

Product description

Finally, you can include keywords in the biggest piece of text on your product page: the product description. When writing your product descriptions, keep in mind the pain points people are looking for your product to solve. They may be searching for those very same things in Google! 

In their product description, Canyon Bakehouse makes sure to include important keywords a person on a gluten-free diet may be looking for, like “certified gluten-free” and “100% whole grains,” or a bread they can use to make “toast” or “sandwiches.”

Finding Keywords in Google Search Console
  1. Open up Google Search Console, and navigate to the Performance report. By default, the report is set to “Queries” at the bottom. 
  2. Toggle over to the Pages tab, and click on an individual page. 
  3. Then, you can toggle back to Queries to view the specific keywords that page is ranking for.
navigating the google search console to find the keywords your rank in for free

Of course, the Google Search Console report only tells you the keywords you’re currently ranking for. To discover keywords before they start trending in Google, you can look to your review analytics!

All PowerReviews customers using our Ratings & Reviews product with the Review Search feature enabled,now have access to Review Search Reporting. With this tool, you can see the specific keywords customers are entering in when they search through your reviews. 

For the clothing retailer below, it’s clear that their customers seriously want to know whether this product is waterproof. Search terms like “waterproof,” “water,” “rain,” and “water resistant” dominate the top search results:

PowerReviews UGC Analytics reports show what your customers are searching for in your content
Knowing what your customers are searching for in your review content can help you write better product descriptions.

The fact that customers are typing these words into the review search box may indicate that they’re not adequately addressed in the rest of the product page. Thanks to these insights, the retailer can now take action to incorporate waterproof-related keywords into the product page for a SEO boost. 

3. Mark up your images

Images speak louder than words. Nowhere is that statement more true than in the world of eCommerce. In fact, according to our recent study 80% of consumers find photos from other customers more valuable than photos from brands or retailers. Shoppers want to see photos of your product from all angles, in action, and in a lifestyle setting. 

Now, search engines like Google can’t “see” images (yet), but you can tell them what’s in your image, via a little thing called alt text. Like your title tag and meta description, alt text lives in your site code, where search engines can read it to gather more context. (People who are visually impaired also rely on alt text, as their screen readers read it aloud to describe what’s in an image.)

It’s easy to copy and paste the product name or SKU into the alt text field. It’s also a serious waste of a SEO opportunity. By adding descriptive alt text, you not only make your site more accessible to more people, but you also increase your chances of ranking for the right keywords — and for showing up in Google image search!

PowerReviews customers using our UGC Analytics solution can see the tops words and phrases customers use in their reviews.

Where can you find the keywords to add to your image alt text? Look at your reviews! Your customers do a fantastic job describing your products using the words other customers use. What phrases come up again and again? Things like “desk chair for kitchen office” or “favorite hot yoga shorts” would be perfect additions for your alt text. PowerReviews customers using our UGC Analytics solution can see the tops words and phrases customers use in their reviews.

Search engines read captions, too. If it makes sense, consider adding them to your images like  Room & Board does:

Room & Board uses image captions to boost SEO
Both shoppers and search engines skim your image captions, so it's a great place to put additional information or reiterate details.

Remember to markup other images on your page beyond the product gallery. For example, The North Face has alt text for the two icons on their product page: “our most sustainable product” and “recycled content.” Adding alt text to these images may encourage Google to show their product when people are searching for sustainable clothing.

4. Use a clear URL structure

There’s one more thing that shows up in the search results: your URL. 

URL structure is an afterthought for many brands, with the developers left to do whatever feels most logical to them. However, a clean, clear URL structure can make the difference between Google crawling your web pages with ease… or getting lost somewhere along the way. 

You want to avoid URLs that look like this:

  • www.yourbrand.com/us/shop/products/123/product-catalog/xty-1222

Whew, that’s stressful Looking at that URL, I have no idea what the page is offering. I can tell that it’s an ecommerce site, but that’s about it.

SEO-friendly URL structures, on the other hand, look something like this:

  • www.yourbrand.com/products/category-name

  • www.yourbrand.com/products/category-name/sub-category-name

  • www.yourbrand.com/products/category-name/sub-category-name/product-name

As you can see, there’s a clear hierarchy to this hypothetical website. These URLs say, “Hey, Google. We are a retailer and we list products on our website. You can find them via these category, sub-category, or individual product pages.”

Depending on the size of your catalog, you may not need multiple levels to your URL structure. For example, Clif Bar has one level. Look at these simple, keyword-rich URLs:

When you have a large product catalog, though, it becomes really helpful to have the different levels, as you can see in this example from Ace Hardware:

When you have a clear URL structure like this, Google will often display breadcrumbs with your search result. In the Ace Hardware example, that’s the “hard-sided-coolers” above the title tag. That breadcrumb information confirms to potential customers that they a) have the type of cooler they’re looking for and b) have enough of a selection for it to warrant its own category. That’s the kind of information that encourages more clicks and better SEO!

Beyond having a clear structure, you can boost your product page SEO with a SEO-first internal linking strategy. Link to your bestsellers in blog posts, and link to related items or product categories in carousels on your product pages. This improves the discoverability of these products, and gives Google additional semantic meaning about the relationship between these products.

For example, on the product page for their Advanced Night Repair Serum, Estee Lauder links to related products that speak to the same pain points, like their Advanced Night Repair Eye cream.

products related to estee lauder Advanced Night Repair Eye cream

Also keep an eye out for what other products customers mention in their reviews. For example, let’s say you’re an outdoor clothing retailer. Do reviewers regularly mention one of your jackets in their reviews of your hiking boots or hiking pants? Feature that jacket in your Related Products carousel. 

5. Implement schema markup

Think back to the last time you were shopping online. Have you ever noticed how the search results for products look different than normal results? For example, they often display star ratings, price, and in-stock information.

Once you start to look for them, you’ll notice these stars show up all over Google:

Crocs uses Google review schema to display star ratings in search results

This extra information, especially the stars, is called rich snippets. Rich snippets stand out to shoppers browsing the Google search results. Rich snippets also expand the size of your search result. Either way, searchers are more likely to click through when they see them. 

To enable rich snippets, you need to add schema markup to your website. Schema is code that speaks the search engine’s language and tells them key information about your product, like its price, availability, ratings, and more. To improve your product page SEO, consider adding these schemas to your product pages:

If you’re a PowerReviews customer, good news! We already take care of this for you. Our Review Display comes with schema markup built in.

Psst… Speaking of our Review Display, we just released our 4.1 update which is packed with even more SEO goodness. Display 4.1 boasts a smaller JavaScript bundle size and faster load times. With Google’s recent Page Experience update and continued focus on site speed, these improvements will make our Review Display load even zippier than before. Google will love it, and your users will, too. 

From SEO to sales

If you want more conversions, you need more traffic — and that’s where SEO becomes critical. Implement the five best practices above, and see what it does for your rankings, your traffic, and your sales! 

Alyson Fischer

Alyson Fischer is our Product Marketing Manager, obsessed with using data-driven storytelling to deliver a best-in-class customer experience and inspire dynamic engagement across channels. When she’s not agonizing over writing this bio, you can find her exploring Chicago with her furry sidekick or watching a true crime documentary on Netflix.

The role of Q&A on PDPs and how this content impacts purchase behavior, based on insights from more than 7,500 U.S. consumers.

Survey at a Glance:

How Q&A Eliminates Uncertainty and Boosts Ecommerce Sales is based on survey responses from 7,528 consumers across the United States. Key findings include:

Most consumers read Q&A to make more informed purchase decisions.
  • 99% of consumers read Q&A at least occasionally; Nearly three-quarters (72%) read Q&A always or regularly.  

  • Q&A and ratings and reviews both have roles to play. Of consumers who read Q&A, 98% do so in addition to reading reviews. 

  • Consumers read Q&A for various reasons, including to get a better understanding of product performance (83%), to see if the product fits their personal needs (70%) and to get a better sense of size or sizing (58%).
Many consumers ask and answer questions via Q&A -- and they have high expectations when it comes to getting answers.
  • 68% of those surveyed indicate they’ve left a question in the Q&A section of a product page. 

  • Consumers expect fast responses to their questions. 56% expect to get an answer within 24 hours, and 21% expect an answer in four hours or less.

  • 71% of shoppers have answered questions submitted by other shoppers via Q&A.
Consumers pay attention to the source of responses on Q&A -- and they place the highest value on answers from other shoppers.
  • 82% of consumers take note of the small print detailing who provided a Q&A response.  

  • 94% of shoppers value answers from verified buyers who have already purchased the product in question. 

  • 45% value answers from the brand or retailer selling the product.

  • A mere 18% value answers from other consumers that aren’t verified as having purchased the product in question.
The absence of Q&A content can deter shoppers.
  • A recent analysis found that there’s a 157.1% lift in conversion when visitors interact with Q&A.
  • 26% of shoppers are more suspicious about the quality of a product or brand if the product page doesn’t have a questions and answers section. 33% of Gen Z shoppers say this is the case. 
  • 24% of consumers are less likely to purchase a product if there isn’t a Q&A section on the product page. This number is even higher — 33% — among Gen Z shoppers. 

Introduction

Modern Consumers do Their Research

The modern consumer wants to find out all they can about a product before commiting to a purchase. But even the most comprehensive product detail page won’t address every possible question and scenario that crosses a consumer’s mind.

Oftentimes, Online Shoppers Struggle to Get Answers to Purchase-Blocking Questions

When a consumer is shopping in a brick-and-mortar store, many of their outstanding questions can be answered simply by seeing and touching the product in person. And if they still have questions, they can seek out a sales associate to get answers. 

However, when consumers shop online, they don’t have the same opportunities to overcome their hesitations. And if they can’t get an answer to a question, they’re likely to go elsewhere. In fact, according to research from Forrester, 55% of shoppers will abandon an online purchase if they can’t find quick answers to their questions.

55% of shoppers will abandon an online purchase if they can’t find quick answers to their questions.

Q&A is Proven to Positively Impact Purchase Behavior

It’s essential to provide website visitors with a means to ask questions standing in the way of a purchase — and answer questions from fellow shoppers. A growing number of brands and retailers do this by adding a questions and answers (Q&A) section to their product pages, typically alongside product ratings and reviews.

And those that do see a large, positive impact on purchase behavior.  In fact, our recent analysis found that there’s a 157.1% lift in conversion when visitors interact with Q&A.

This makes it the most impactful type of user-generated content (UGC) on purchase behavior. It’s like the number one digital body language equivalent indicator that a customer is going to buy.

Start Leveraging Q&A to Drive Greater Consumer Engagement and Sales

Clearly, Q&A can drive powerful bottom line results. However, in order to effectively leverage this content, it’s important to understand how modern shoppers engage with Q&A — and what their expectations are when it comes to this content. 

PowerReviews surveyed more than 7,000 consumers to understand the role of Q&A in online shopping and how it influences purchase decisions. This report explores the key findings from this survey, as well as six recommendations for brands and retailers seeking to leverage Q&A to the fullest to attract and convert more shoppers.

Who We Surveyed

Generations

Gen Z
(1997-present)
1%
Millennials
(1981-1996)
50%
Gen X
(1965-1980)
36%
Baby Boomers
(1946-1964)
13%

Household Income

How Often Consumers Consult Q&A

In-store shoppers have the opportunity to see, touch and experience products prior to making a purchase. And if they have outstanding questions, they can seek out a sales associate for assistance. This isn’t the case for online shoppers. 

We know from previous research that the majority of shoppers turn to ratings and reviews and user-submitted visual content to bridge the gap when shopping online. Another type of user-generated content — Q&A — also plays an important role.

The Vast Majority of Shoppers Consult Q&A

A growing number of brands and retailers display Q&A alongside ratings and reviews on product pages. When this content is available, 99% of consumers read it at least occasionally. And nearly three-quarters (72%) read Q&A always or regularly.  

How Often Consumers Read Q&A

Of note, younger consumers are actually less likely to read Q&A content than older generations. 64% of Gen Z shoppers read Q&A always or regularly, compared to 72% of Boomers, 73% of Gen X’ers and 70% of Millennials.

How Often Consumers Read Q&A
Boomers
Gen X
Millennials
Gen Z

Consumers Consult Q&A in Addition to Ratings and Reviews

When it comes to ratings and reviews and Q&A, it’s not a matter of either/or. Instead, each of these types of user-generated content has an important role to play. Of consumers who read Q&A, 98% do so in addition to ratings and reviews. Just 2% read Q&A instead of ratings and reviews. 

Q&A and Ratings and Reviews Both Play Important Roles
Do you read Q&A in addition to or instead of ratings and reviews?
In addition to:
98%
Instead of:
2% 2%

Consumers value both ratings and reviews and Q&A; one doesn’t replace the other. Brands and retailers must provide both types of content in order to meet the expectations of modern shoppers. 

Why Consumers Read Q&A

Today, nearly all shoppers read the Q&A section of product pages. But what are their motives for doing so?

Consumers Seek Out Additional Product Information by Reading Q&A

Shoppers read Q&A to get product information that goes beyond what’s available in the product description. But what topics do they want to learn more about? 

84% read Q&A to get more information about product quality, and nearly three-quarters (73%) do so to learn more about product experience. 66% seek out information about overall service and experience when buying the product. Other popular topics include product warranty (28%) and shipping (23%).

Most Important Information Included in Q&A
When reading Q&A on a product page, which of the following topics have you been seeking more information on?
Product quality
84%
Product experience
73%
Overall service/experience when buying the product
66%
Product warranty
28%
Shipping
23%

Consumers Seek Out Additional Product Information by Reading Q&A

We know that consumers turn to Q&A to get more information about products. But why do they value this content as much as they do?  

The most popular reason why consumers read Q&A is that it helps them understand product performance; 83% say this is the case. 70% of consumers indicate that Q&A helps them determine if a product fits their own personal need, and over half (58%) say this content helps them get a better sense of size or sizing. 

Other top reasons consumers read Q&A is that it’s more specific than a typical customer review (56%), it’s more authentic and real than standard brand-created information (51%), and it creates trust in the brand or product (34%).

Why Consumers Read Q&A Content
Better understand product performance
83%
To see if the product fits a personal need
70%
Get a better sense of size/sizing
58%
It’s more specific than a typical customer review
56%
It’s more authentic and real than standard brand-created information
51%
It creates trust in the brand/product
34%

Consumers read Q&A for a wide variety of reasons and use this content to gain information on many topics. It’s essential to display Q&A on product pages to address shoppers’ purchase-blocking concerns — and ultimately, drive more sales.

How Consumers Interact with Q&A - and Their Expectations When They Do So

We know that 99% of consumers read Q&A at least occasionally, with many doing so much more often. Consumers also interact with Q&A by posing their own questions — and answering the questions of fellow shoppers. 

Consumers Use Q&A to Submit Their Own Purchase-Blocking Questions

Most shoppers read through existing Q&A to get more information about products. But if they still have a question standing in the way of making a purchase, many won’t hesitate to submit it. 

68% of the consumers we surveyed said they’ve left a question in the Q&A section on a product page.

Many Consumers Post Questions Via Q&A
Have you ever left a question in the Q&A portion of a product page?

Of note, older consumers are more likely to submit questions than their younger counterparts. 70% of Boomers have left a question in the Q&A portion of a product page, compared to 55% of Gen Z shoppers. 

Consumers of All Generations Pose Questions Via Q&A
Percentage of consumers who have posted questions
Boomers
70%
Gen X
69%
Millennials
67%
Gen Z
55%

Shoppers Expect Fast Answers

Most consumers submit questions via the Q&A section of product pages. And when they do, they expect to get answers — quickly.

Over half (56%) expect to get an answer to a question within 24 hours. And nearly a quarter (21%) expect an answer in four hours or less.

Consumers Have High Expectations for Quick Answers
If you ask a question through Q&A on a product page, how long would you expect to wait for an answer?

Gen Z shoppers have slightly higher expectations than other age groups. 60% of Gen Z’ers expect a response from a question within 24 hours, compared to 55% of Millennials, 56% of Gen X consumers and 58% of Boomers. 

Regardless of age, shoppers expect speedy answers to the questions they pose via Q&A. Make it a priority to provide timely answers. If you don’t, your shoppers may lose interest and seek out a more responsive brand.

Consumers Have High Expectations for Quick Answers
If you ask a question through Q&A on a product page, how long would you expect to wait for an answer?
Boomers
Gen X
Millennials
Gen Z

Consumers Recognize that the Answers in Q&A Come from Various Sources

On some brand and retailer websites, questions are solely answered by the business itself. But on other sites (including Amazon), shoppers can post answers to questions from other shoppers. 

For the most part, consumers seem to understand that answers come from various sources. The vast majority (86%) believe answers to questions in the Q&A section of a product page are created by verified buyers who already bought the product in question, and 63% recognize that answers come from the brand or retailer selling the product. Just over a third (35%) think answers come from other consumers that haven’t been verified as having bought the product in question.

Consumers Recognize That There are Multiple Answer Sources
Who do you think creates the answers to questions in the Q&A section on product pages?
Verified buyers who already bought the product
86%
The brand or retailer that is selling the product
63%
Other consumers not verified as having bought the product
35%

Shoppers Take Note of Who Responds to Q&A

Many brands and retailers display a badge or some text detailing who provides each answer in the Q&A section of a product page. And customers browsing Q&A take note. 82% of consumers say they pay attention to the small print detailing who provided the answer response.

Consumers Take Note of Who Provides Q&A Answers
When browsing Q&A content on product pages, do you pay attention to the small print detailing who provided the answer response?

Interestingly, Boomers are the generation most attuned to who responds to the questions in the Q&A portion of product pages. 85% of Boomers pay attention to the small print detailing who provided the answer response, compared to 72% of Gen Z shoppers.

Older Consumers Pay More Attention to the Source of Q&A Responses
Percentage of consumers who pay attention to the source of Q&A responses
Boomers
85%
Gen X
82%
Millennials
81%
Gen Z
72%

Make it easy for shoppers to determine who provided each answer in the Q&A section of your product pages. Your prospective customers are paying attention!

Consumers Value Answers from Others Like Them

Shoppers recognize that the answers to questions posed via Q&A come from a variety of sources. But do they value one source over another?

Absolutely.

Nearly all shoppers (94%) value answers from verified buyers who have already purchased the product in question. Just under half (45%) think that answers from the brand or retailer selling the product are valuable. And a mere 18% value answers from other consumers that aren’t proven to have purchased the product.

Consumers Place High Value on Answers from Other Consumers
Which of the following groups who provide answers to questions in Q&A sections on product pages do you value?
Verified buyers who already bought the product
94%
The brand or retailer that is selling the product
45%
Other consumers (not verified as having bought the product)
18%

Clearly, consumers value answers from others like them. And this isn’t terribly surprising. After all, the perceived beauty of user-generated content is that it’s provided by a consumer without an agenda (other than providing accurate information for others).

So if you’re not already, start allowing your customers to answer questions about the products they’ve purchased in the past. It’s a great way to build trust and convert more shoppers. 

Many Consumers Answer Questions Via Q&A

Consumers don’t hesitate to pose their late stage buying consideration questions via the Q&A section of product pages. And as it turns out, many are also willing to share their own experiences with fellow shoppers by answering questions submitted via Q&A. 

In fact, nearly three-quarters (71%) of consumers have answered questions from other shoppers via Q&A. Interestingly, more consumers answer questions than submit their own.

Most Consumers Have Answered Questions from Other Shoppers via Q&A
Have you ever left an answer in the Q&A section of a product page?

Of note, Gen Z shoppers are the group least likely to have answered fellow shopper questions via Q&A. Less than half (48%) have done so, compared to 71% of Boomers and Gen X shoppers and 70% of Millennials. 

Consumers of all Ages Answer Questions from Shoppers via Q&A
Percentage who have left an answer in the Q&A section of a product page
Boomers
71%
Gen X
71%
Millennials
70%
Gen Z
48%

How Q&A Impacts Shopper Trust and Purchase Behavior

Nearly all shoppers interact with Q&A content when it’s available. What’s more, it’s presence (or absence) has the power to significantly impact purchase behavior. 

Consumers Who Interact with Q&A are More Likely to Convert

Reading Q&A can help shoppers overcome their hesitations and purchase a product. In fact, Q&A is proven to increase the likelihood of purchase. 

As we highlighted above, our previous analysis of 1.5MM online product pages from more than 1,200 brand and retailer sites throughout the course of 2020 found that there’s a 157.1% conversion lift when shoppers interact with the Q&A portion of a product page.

Impact of Q&A on Conversion
Overall Conversion
3.4%
Conversion for those who interact with Q&A
8.8%
157.1% lift in conversion

The Absence of Q&A Can Impact Trust

On the flip side, the absence of Q&A can negatively impact consumer trust and purchase behavior. 

Just over a quarter (26%) of consumers are more suspicious about the quality of a product or brand if the product page doesn’t have a questions and answers section.

The Absence of Q&A Increases Suspicious for Some Shoppers
If a product page doesn’t have a Q&A section, does this make you any more suspicious about the quality of the product or brand concerned?

Notably, Gen Z shoppers are the group most likely to be suspicious of product pages lacking a Q&A section. A third (33%) of Gen Z shoppers say the absence of Q&A makes them more suspicious of the quality of the product or brand, compared to 27% of Boomers and 26% of both Gen X’ers and Millennials. 

Generational Comparison: The Absence of Q&A Increases Suspicion for Some Shoppers
If a product page doesn’t have a Q&A section, does this make you any more suspicious about the quality of the product or brand concerned?
Boomers
Gen X
Millennials
Gen Z

The Absence of Q&A Can Decrease Purchase Likelihood

The presence of Q&A can increase purchase likelihood. What’s more, the absence of Q&A can decrease purchase likelihood. 

If a product page lacks a Q&A section, it makes nearly a quarter (24%) of consumers less likely to buy the product.

The Absence of Q&A Decreases Purchase Likelihood for Some Consumers
If a product page doesn’t have a Q&A section, does this make you less likely to buy the product concerned?

Gen Z shoppers are the group most likely to be deterred by a lack of Q&A on a product page. A third (33%) indicate that they’re less likely to buy an item if the product page doesn’t have a Q&A section. In comparison, 25% of Boomers, 24% of Gen X’ers and 23% of Millennials say this is the case.

Generational Comparison: How a Lack of Q&A Impacts Purchase Likelihood
If a product page doesn’t have a Q&A section, does this make you less likely to buy the product concerned?
Boomers
Gen X
Millennials
Gen Z

It’s true that a lack of Q&A isn’t enough to deter the majority of shoppers. However, those who interact with this content convert at higher levels than those who don’t. 

Add Q&A software to your product pages so shoppers can browse questions posed by other consumers — and submit their own. If you don’t, you’re leaving money on the table, as Q&A is proven to significantly boost conversion rates.

6 Tips for Leveraging Q&A to Boost Consumer Engagement and Sales

No matter how comprehensive your product pages, there’s no way to anticipate each and every question customers will have. It’s imperative to provide shoppers with a mechanism for getting further information in order to maximize sales likelihood. Q&A is a highly effective tool to do just that. 

Brands and retailers that leverage Q&A to the fullest are able to more effectively eliminate customer hesitations — and boost sales. Read on for 6 ways to leverage Q&A to increase consumer engagement and sales, based on the key findings of this report.

1
Display Q&A Alongside Reviews

Nearly all (99%) of consumers read Q&A on product pages, and those who engage with it are more likely to convert than those who don’t. On the flip side, nearly a quarter of consumers are less likely to buy a product if there isn’t a Q&A section on the product page. 

So be sure to add a Q&A section to your product pages that allows shoppers to browse questions that have already been asked, submit their own, and answer questions posed by fellow shoppers. A best practice is to display this content alongside your ratings and reviews so consumers can easily find all of the user-generated content they need to make informed purchase decisions.

Make it Easy for Consumers to Search Existing Q&A

Shoppers read Q&A to get more information about various topics, including product quality, product experience and shipping. Make it easy for them to find the information they’re looking for by adding a search feature to your Q&A display. If a shopper finds a question similar to theirs, you’ll get less repeat questions. Plus, the shopper will get an instant answer — and they’ll be more likely to convert right away.

2
3
Provide Fast Answers to Questions

Over half of consumers expect answers to questions within a day. And nearly a quarter expect a response within four hours. Make sure you have a plan in place to ensure questions are answered quickly. If you respond too late, you risk losing the sale to a more responsive business. 

Allow Existing Customers to Answer Questions from Prospective Customers

Consumers value answers from other shoppers who have already purchased a product significantly more than answers from brands or retailers. So start allowing your current customers to answer the questions posed by prospective customers. Hearing about the experiences of fellow consumers will build your shoppers’ confidence — and the likelihood that they’ll make a purchase.

4
5
Disclose Who Answers Questions Submitted Via Q&A

82% of shoppers pay attention to the small print detailing who provides Q&A responses. So for the sake of transparency and credibility, be sure to include a badge or disclosure that makes it clear who submitted each response to a customer question. 

Measure Q&A Performance and Optimize Accordingly

Developing a Q&A strategy isn’t a one time event. Instead, you’ve got to regularly measure the performance of your Q&A content. Then, use the insights you uncover to optimize your program and drive even bigger results for your business.

6
Brands ranked based on Ratings & Reviews captured across key retailers and marketplaces

Brands and retailers live and die on the performance and reputation of their product. This is why it’s critical for them to understand how they stack up against their competition.

The PowerReviews Brand Health Index: Electronics Edition ranks brands based on insights gleaned from product ratings and reviews across three major retailers and marketplaces (Amazon.com, Walmart.com and Target.com).

Check out the ungated report to find out:

Consumers depend on reviews, regardless of what they’re shopping for.

And the importance of this content is only growing. Recent research found that 99.9% (yes, you read that right) of consumers read reviews when shopping online at least sometimes, compared to 97% who said this was the case in 2018.

What’s more, shoppers seem to have a nearly insatiable appetite for review content. 68% of consumers say that ideally, a product should have 26 or more reviews. And nearly a third feel that a given product should have 100 or more reviews!

The Ideal Number of Reviews a Product Should Have, According to Shoppers

Brands and retailers that don’t collect this content aren’t meeting customer expectations — and are quite literally leaving money on the table.

Not convinced? Our analysis of 1.5MM product pages from more than 1,200 brand and retailer sites during 2020 found that there’s a 120.3% lift in conversion among those who interacted with ratings and reviews.

That means brands that don’t provide this content are missing out on a simple, yet impactful way to grow sales.

The Impact of Reviews on Conversion
Ecommerce UGC Page Visitor Overall
3.4%
Conversion for Those Who Interact with Reviews
7.6%
120.3% conversion lift when visitors interact with reviews

Cleary, the onus is on brands and retailers to collect reviews — and plenty of them.

How Incentives Motivate Shoppers to Contribute Reviews

Ideally, every customer would write glowing reviews about every product they purchased. But that’s just not how the world works, sadly.

Our research found that about half of consumers (52% to be exact) write reviews multiple times per month. The other half submit this content far less frequently –and 2% never do.

Review Submission Frequency

Fortunately, there are several strategies that are proven to increase review volume for brands and retailers. One particularly impactful way to generate more content is to offer an incentive in exchange for a review.

Frankly, incentives are the single most effective way to generate a ton of reviews fast.

Overall, nearly three-quarters (73%) of consumers say they’d be motivated to write a review if they were offered an incentive. And (perhaps not surprisingly), incentives motivate shoppers of all generations.

Incentives Motivate Reviewers Across Generations
Boomers
73%
Gen X
74%
Millennials
73%
Gen Z
73%

Four Impactful Types of Incentives for Generating Reviews, According to 10,000+ Consumers

We know incentives are enough to motivate 73% of consumers to write reviews. But what incentives actually work?

The short answer is that it depends. An incentive that works well for one brand might not be as successful for another.

However, we recently surveyed more than 10,000 consumers to understand what motivates them to write reviews — and there were four incentives that rose to the top. Let’s dig into each of them so you can determine which might be a good fit for your brand.

Incentives Leading to Review Submissions
Receiving the Product Free of Charge
91%
Receiving a Product Before It's Available to the Public
85%
Discounts with Store or Brand
67%
Loyalty Points with Store or Brand
59%

1. Free Products

Let’s face it: people like getting free stuff. So it’s probably not terribly surprising that receiving a free product is the most effective incentive for getting more reviews. 91% of consumers said they’d be motivated to write a review if they received a product free of charge.

So if you’re looking to generate a high volume of reviews fast, product sampling might be just the ticket.

The concept is simple: send free samples to consumers — and then ask them to write a review. But it’s incredibly effective. At PowerReviews, the average submission rate for product sampling campaigns is 85%. That means 85% of those who receive a free sample go on to write a review.

Reviews that result from product sampling campaigns are also high quality. We’ve found that reviews generated through a sampling campaign are 83% longer, compared to those captured via other methodologies.

This is great news, as 56% of consumers say that the length, depth, and detail of review content are factors that matter to them.

2. Receiving a Product Before It’s Sold to the General Public

Getting early access to a product can make a customer feel valued, special, and, quite frankly, a bit like a rock star. It’s a pretty cool feeling to know you have something that hasn’t officially hit the shelves.

Early access to a product can also motivate consumers to write reviews. 85% of consumers say that receiving a product before it’s sold to the general public would motivate them to write a review.

If you’re releasing new products, consider doing a pre-launch product sampling campaign. The consumers who receive early access are likely to write reviews — and that means you can officially launch the product with plenty of reviews already in place!

What’s more, the feedback you get in those pre-launch reviews can help you understand where your product shines — and where it falls flat. Then, you can use the insights you uncover to tweak the product before it officially hits store (and digital) shelves.

3. Discounts with the Store or Brand

Consumers are constantly on the hunt for great deals and discounts. According to a survey from Valassis, 72% of consumers make it a priority to save money by using coupons and discounts.

Who wants to pay full price when they don’t have to? No one!

Offering a coupon or discount can also increase the likelihood that a shopper will write a review. 67% of consumers say they’d be motivated to write a review in exchange for a discount for the store or brand.

So if you’re looking to increase your review volume, consider offering shoppers some sort of deal in exchange for writing a review. For example, you might provide a code for a percentage off a future purchase or free shipping percentage off a future purchase that’s “unlocked” after the customer has submitted a review.

The right discount or deal will help you generate more reviews, and as an added bonus, it’ll give your customers an excuse to shop with you again. The same survey from Valassis found that 54% of consumers said that receiving a coupon or discount has caused them to make an impulse purchase.

4. Loyalty Points with the Store or Brand

Consumers are loyal to the brands they love. According to Motista, customers that feel emotionally connected to a brand stick around for an average of 5.1 years, compared to 3.4 years for customers who aren’t emotionally connected. What’s more, the lifetime value of emotionally connected customers is 306% higher.

A great loyalty program can help you further engage your happy customers — and keep them coming back for more. And if you have a loyalty program, offering points in exchange for reviews can be a great way to generate more of this conversion-boosting content.

After all, 59% of consumers indicate they’d be motivated to write a review if they had the chance to earn loyalty points with the store or brand.

So if you have an established loyalty or rewards program, consider leveraging it to generate more reviews. For example, a customer might earn 10 loyalty points for each review they write.

And once they accumulate a certain number of points, they can redeem them for a coupon or some sort of promotion — such as a dollar amount off their next purchase.

How to Promote Your Chosen Incentive

You’ve chosen the incentive you plan to offer to customers in exchange for reviews. That’s great! Now it’s time to make sure your customers know about it.

Sometimes, a consumer will write a review without being prompted. But in most cases, they need a gentle reminder in the form of a post purchase email. Here at PowerReviews, we’ve found that about 80% of reviews are written as the result of a post purchase email.

So if you’re offering an incentive in exchange for reviews, be sure to prominently promote it in your post purchase emails. When possible, include the incentive in the top portion of the email so your shoppers will see if — even if they don’t scroll through the entire email. For example, this one from Bissell makes it clear that those who write reviews will be entered in a sweepstakes to win a prize.

You can also include these promotions in your packaging like this insert from Derma E.

How to Maintain Transparency (and Preserve Trust) When Incentivizing Reviewers

Consumers value reviews because this content is provided by fellow shoppers sharing their real experiences, rather than a brand trying to sell a product. In order to preserve consumer trust, transparency is a must.

When you display reviews, be sure to include fine print or a badge that indicates when a consumer received an incentive in exchange for a review. That way, future shoppers will have a clear idea of who wrote each review.

For example, it’s clear that the person who wrote this review for Wander Beauty is a verified buyer who received a free sample in exchange for their review.

Start Generating More Conversion-Boosting Reviews with the Right Incentive

Reviews are more important than ever before, regardless of what a consumer is shopping for. Brands and retailers must make it a priority to collect plenty of this content — or risk losing customers to a competitor. Offering the right incentive can be a great way to supercharge your review collection — and boost conversion across your website.

Andrew Smith

Andrew is an experienced ecommerce technology marketer. When he's not thinking about his day job, he's running around after two small children in Chicago's Lakeview neighborhood.

USAUK