
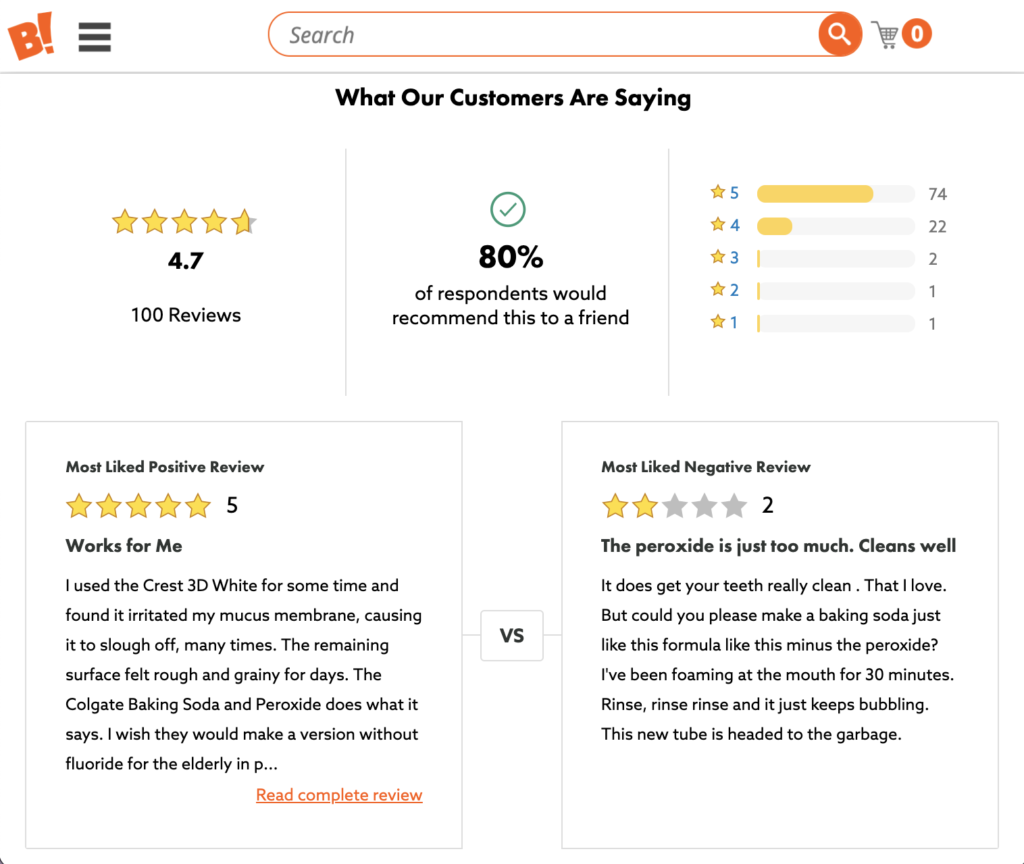
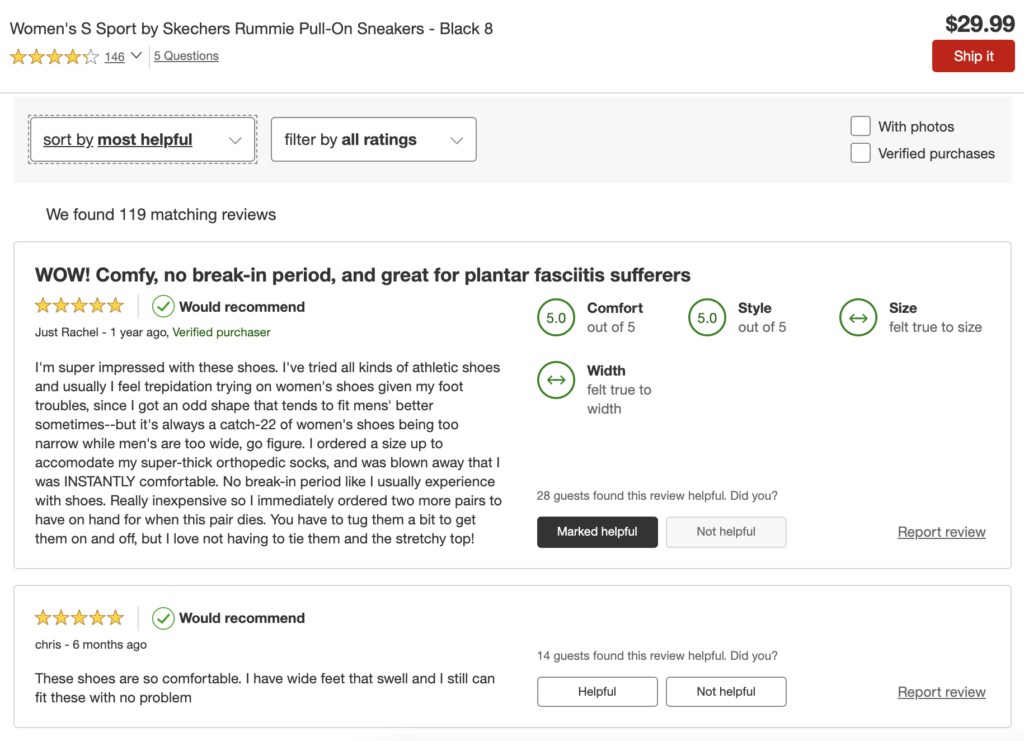
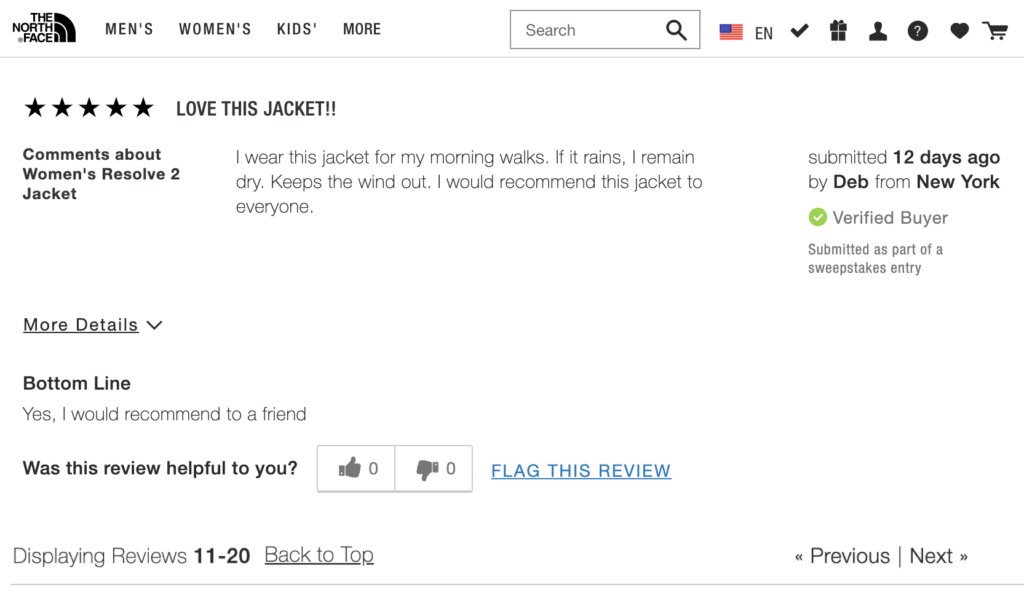
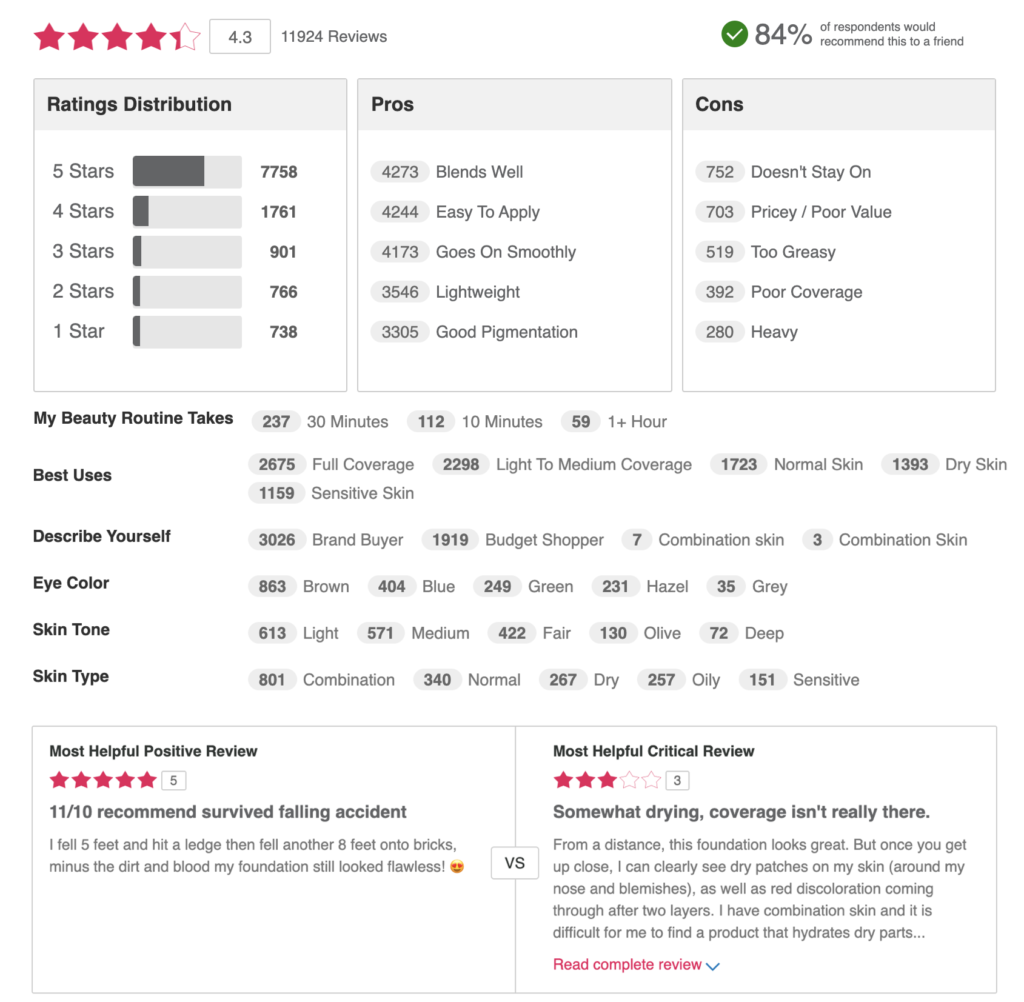
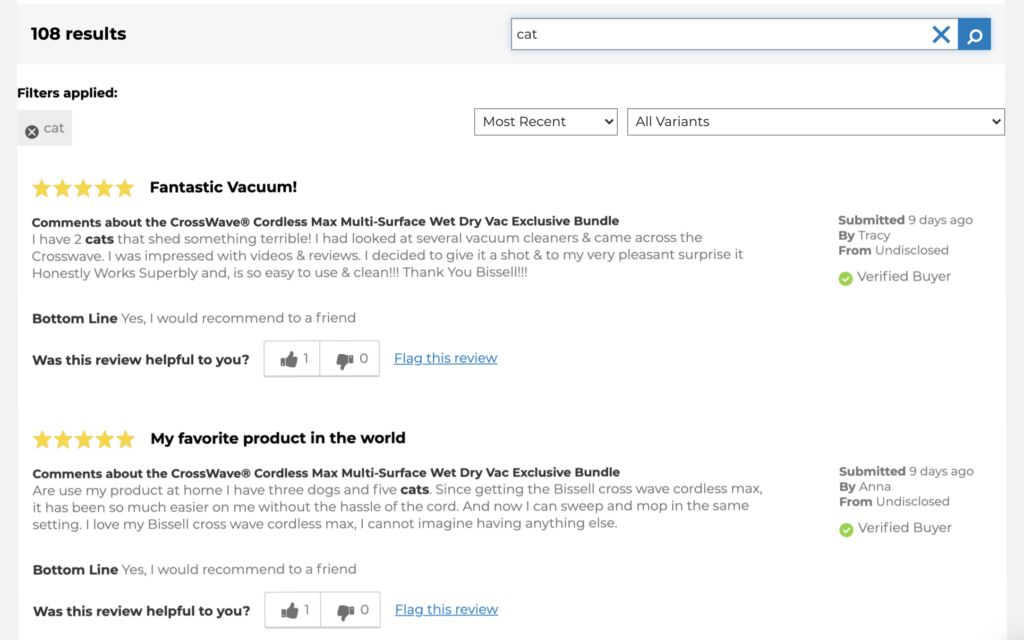
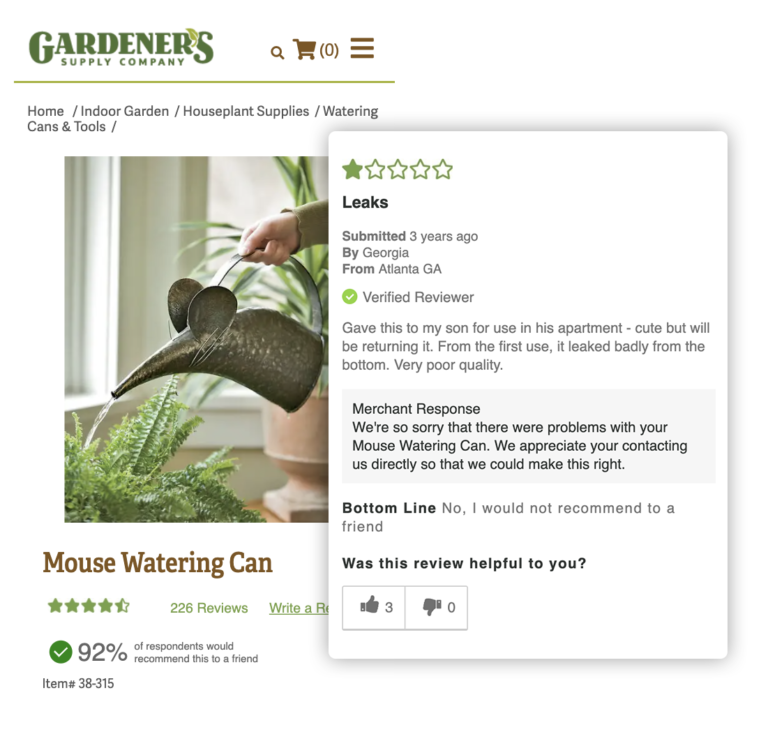
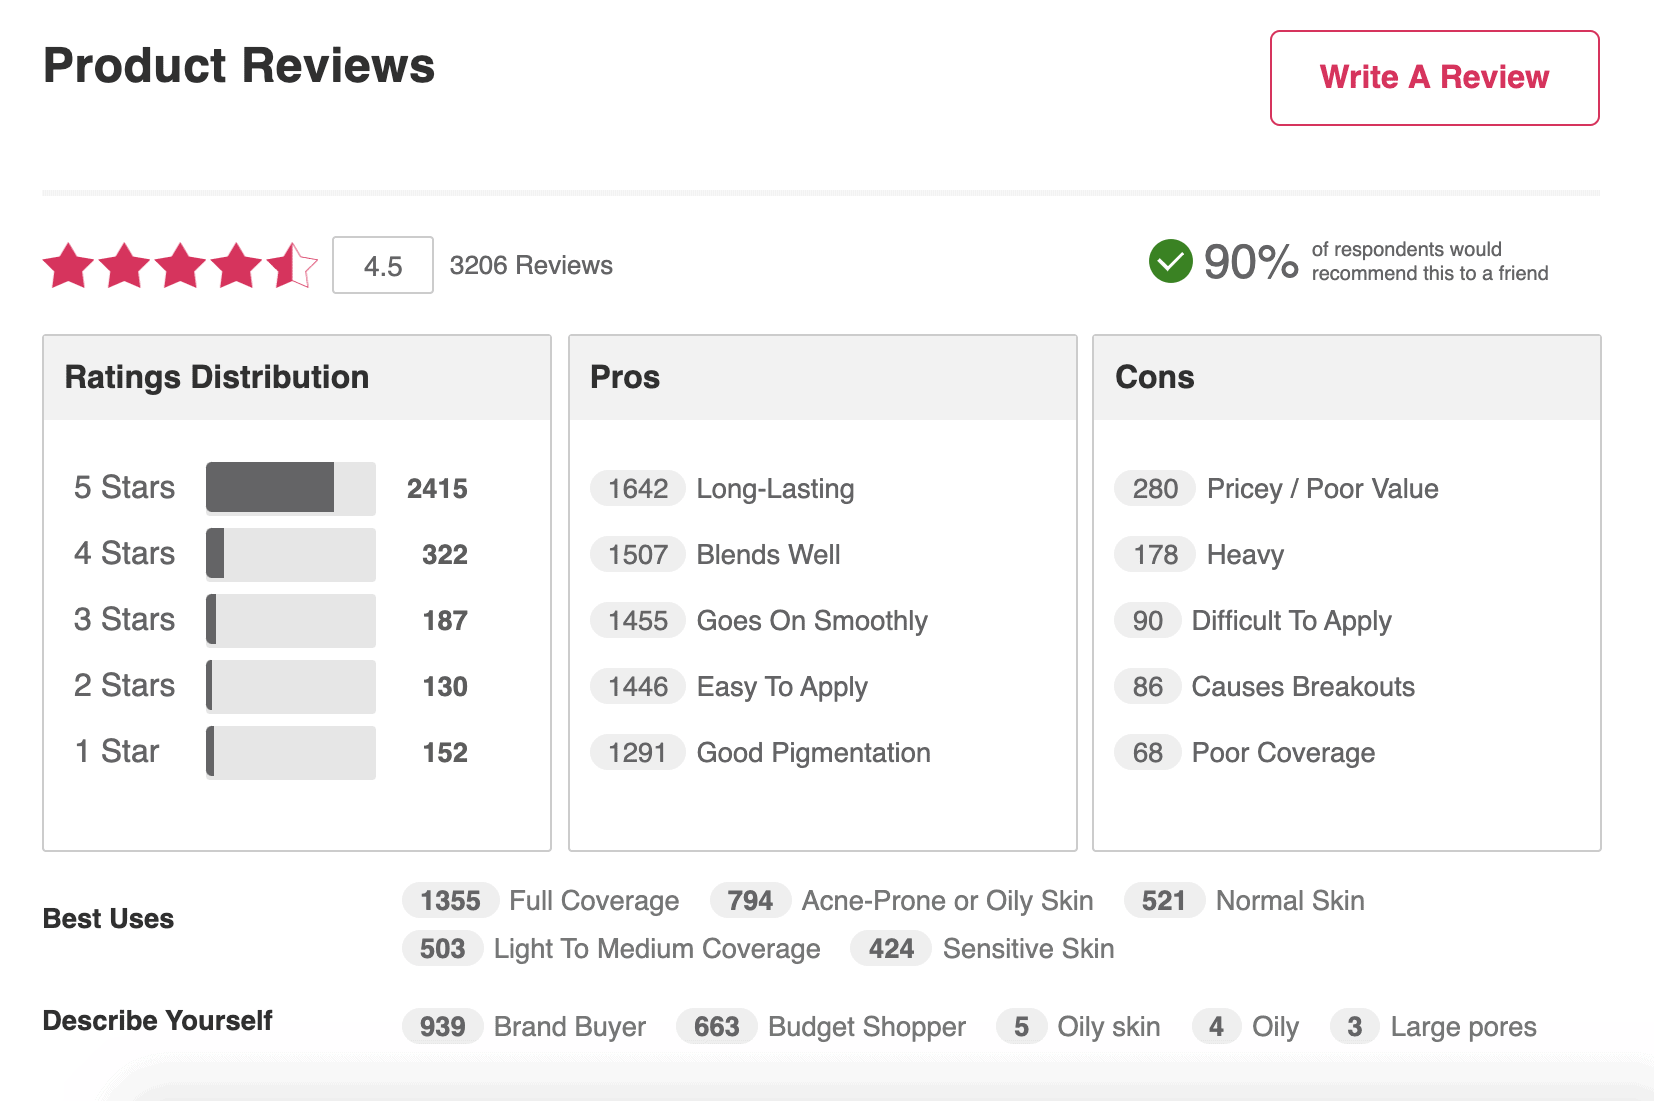
“We stopped selling products we realized were disappointing customers. We didn’t have this information before, and now I can’t imagine operating without it. It’s key to the long-term customer relationship.”

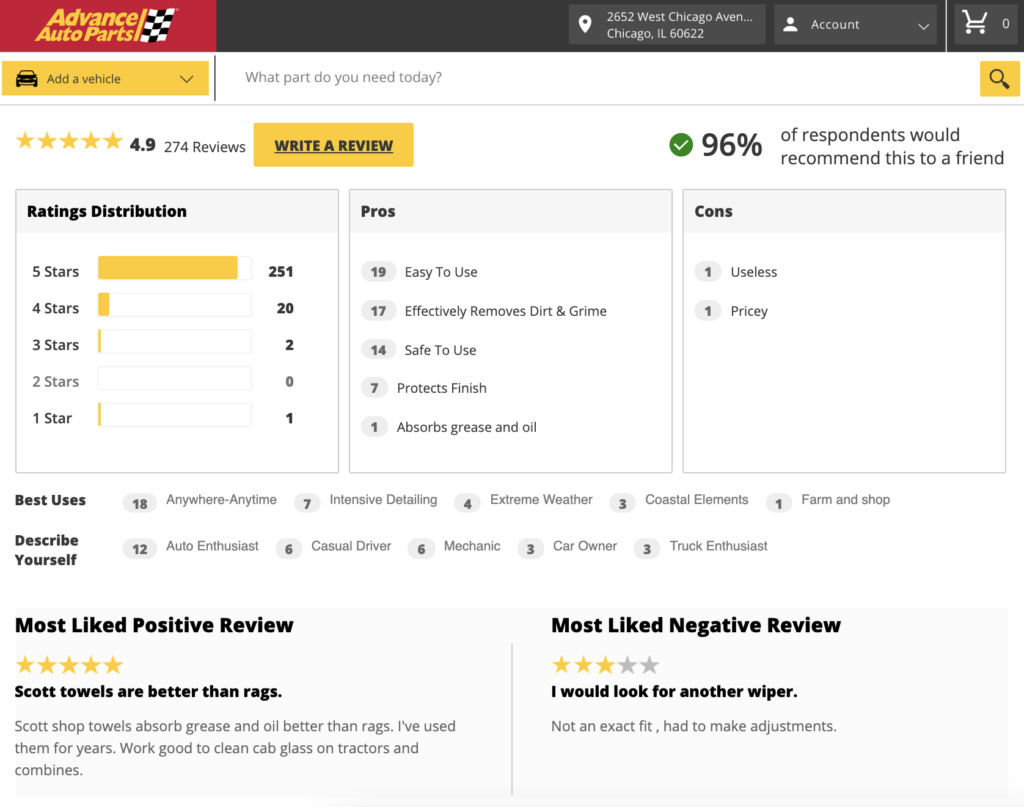
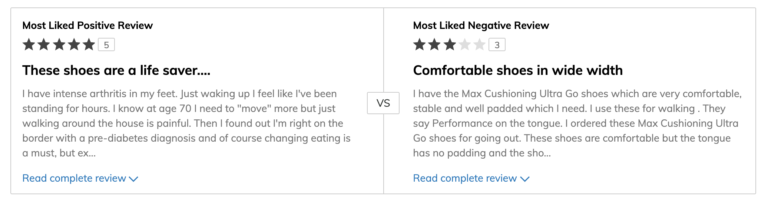
“Analyzing our UGC enables me to aggregate our customers’ opinion. I can go to our merchant and say ‘look at what our customers are saying, you need to fix this’. This insight is such a time saver for us.”


