PowerReviews Christmas Shopping Consumer Survey 2020
UK Edition

Our consumer survey of 2,296 UK consumers highlights Christmas shopping spending plans, factors driving purchase decisions, likelihood of shopping online vs in-store, importance of Black Friday and much more.

Key findings:

Download now to get these insights and more!
Paige Thulin

PowerReviews Holiday Consumer Survey 2020

Our consumer survey of 5,383 shoppers highlights spending plans for the Holiday season, factors driving purchase decisions, likelihood of shopping online vs in-store and much more.

Key findings:

Download now to get these insights and more!
Paige Thulin

The Beginner's Guide to a Best-in-Class Ratings & Reviews Program

A best-in-class Ratings and Reviews program consists of the collection, display and analysis of User Generated Content.


But few brands are operating at this level right now – which is why we created this four volume best practice guide. In it, you will learn how to capture as many customer product reviews as possible and then how to use it across your website (and beyond) to convert browsers to buyers.

Volume 1

What Constitutes the Perfect Review...and How to Get More of Them

What you’ll learn:

Volume 2

The Definitive Guide to Product Sampling

What you’ll learn:

Volume 3

Best Practices for Showcasing Your Ratings & Review Content

What you’ll learn:

Volume 4

Analyze Your UGC

What you’ll learn:

Paige Thulin

This is the sixth edition of our monthly snapshot (most recent versions here and here), originally established to assess the impact of the coronavirus pandemic on consumer behavior. This is our September version of the same report, analyzing consumer activity across more than 1.5MM online product pages from more than 1,200 retail/brand sites.

This time, we focused on a six-month period (starting February 24 2020 and ending August 23 2020). Each report, we specifically analyse review submission levels, review length and sentiment, overall conversions/sales volumes and review consumption (both absolute and among those who go onto purchase).

After some unprecedented and drastic extremes were evident over the course of March through May, we experienced continued stabilization for the third month running. We’ve been talking about a “new normal” for some time now in these reports, and we are only seeing continued confirmation of that trend.

Key ecommerce market trends

01

Ecommerce purchase volumes and site traffic now consistent for a full quarter

02

Review submission volumes now consistent with pre-pandemic levels

03

Reviews still converting more shoppers to buyers than before pandemic

Ecommerce purchase volumes and site traffic consistent for a full quarter

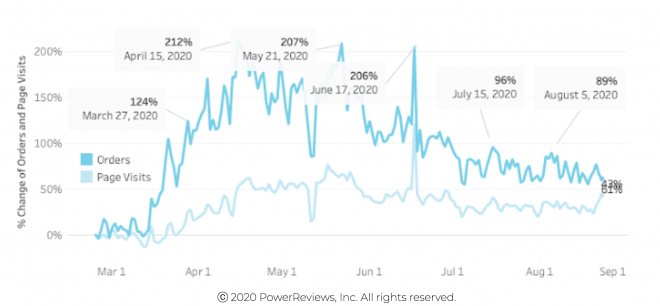
COVID has had a huge impact on consumer behavior, with unprecedented growth in ecommerce purchase volumes at the start of the pandemic. We consistently saw 3x increases in purchase volumes during April and May. However, for the last three months, we have seen continued stabilization.

Consumer behavior is clearly becoming more predictable, with purchase volumes consistently consistently at around 1.5x to 1.75x where they were at the start of the pandemic during this period.

Why? Most likely because the entire population has settled into a “new normal”. People are no longer buying in the bulk they were because they have confidence in supply chain and product availability. They know they will be able to source whatever items they need at short notice.

Traffic and purchase volumes stable for third month running

Review submission volumes now consistent with pre-pandemic levels

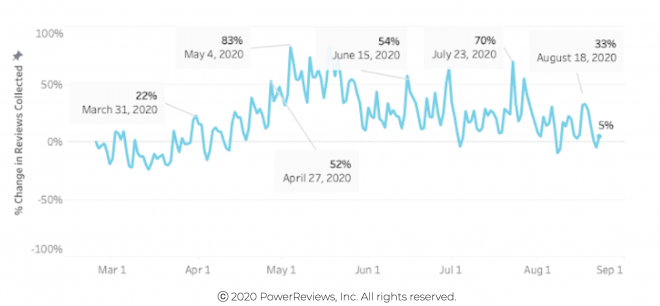
After reporting a giant 2.3x leap in review submission levels from April to May, we highlighted a slight drop over the past two months. This continued to the point where levels are now consistent with what we saw pre-pandemic.

This is most likely because consumers have now got to the point where they are no longer buying items they hadn’t tried before. Instead, they now have established product preferences so are less inclined to be motivated to submit reviews.

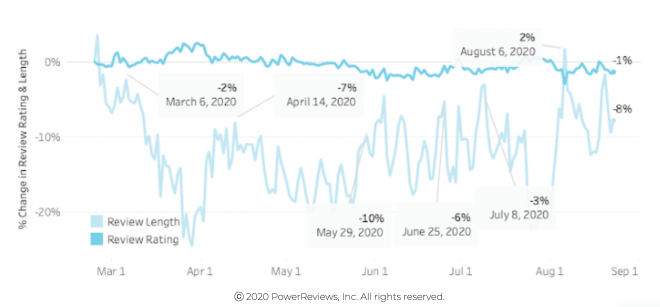
In terms of the actual content of reviews, there have not been any huge shifts over the past six months. Sentiment – in the form of average rating – remains flat, which makes sense given the products themselves are unlikely to have changed significantly in this period. Review length is down slightly on pre-pandemic levels but has rebounded notably in recent months. This may be because reviewers have become accustomed to the “new normal” and are approaching the task with renewed focus and mental capacity. 

In our June webinar, we focused on review length in detail and offered some tips how to improve review quality. Check out our blog for a summary of that webinar.

Review submission volumes now comparable to pre-COVID
Review length and sentiment flat throughout pandemic

Reviews still convert shoppers to buyers more than they were pre-COVID

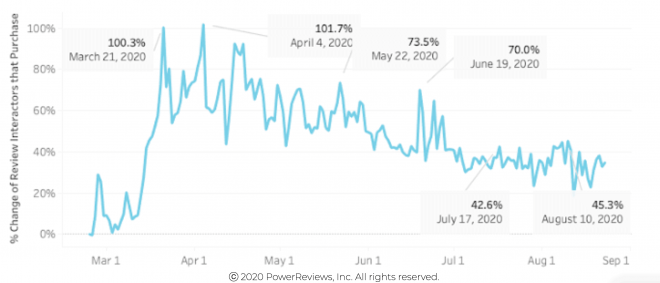
As with the other trends we highlight, the impact of review content on consumer behavior remains relatively consistent with what we saw in previous months. In other words, review content continues to be more influential on the path to purchase than it was before the pandemic. 

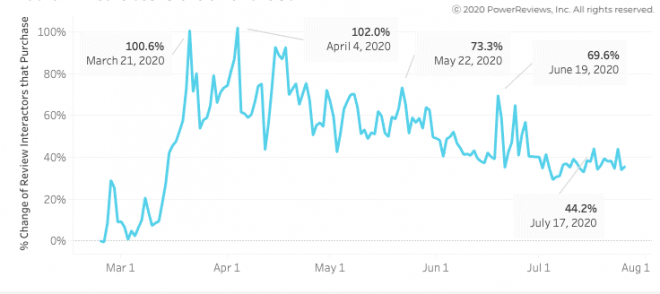
However, while the June and July high in total review interactors were identical (at 66% above the end of February levels), the proportion of review interactors who went onto purchase is actually down (the July peak was 63% below the equivalent figure for June). So consumers are interacting with review content at the same rate as they were last month but are then going onto purchase less than they were then. This is consistent with July’s decrease in orders overall and aligns with the idea that shoppers are becoming more comfortable browsing online, and are less “decisive” in their shopping habits.

But the bottom line remains: Shoppers are still heavily relying on review content to assess product quality and make purchase decisions.

Reviews still convert shoppers to buyers more than they were pre-COVID
Reviews still convert shoppers to buyers more

Summary

The story for the September snapshot is that it has proven to be the third month of continued stabilization. Trends are now very stable so we can confidently say we are now in a COVID-driven “new normal”.

We have been talking about this for the last two months, and it has completely borne out in this report.

As we pointed out last month, the wild and almost out of control growth patterns we saw at the start of the pandemic appear now to be a drastic reaction to drastic and unprecedented circumstances.

Given market conditions are unlikely to change any time soon, this “new normal” will soon simply become “the normal”.

Reinventing the Store Experience

A practical nine point guide for reopening your retail locations in the midst of the COVID-19 pandemic

The store experience needs to evolve

The COVID-19 pandemic has had a profound impact on all facets of daily life. Of course, that includes the way we shop with consumers shifting online at an unprecedented rate.


But – as the pandemic has worn on – many consumers have become increasingly eager to get back to stores. However, their preferences and expectations have changed considerably in the last six months. Retailers must adapt accordingly.

shutterstock_1680499126
shutterstock_1723056670

Download our Guide to learn:

Paige Thulin

This is the fifth edition of our monthly snapshot (most recent versions here and here), originally established to assess the impact of the coronavirus pandemic on consumer behavior. As always, we draw our analysis from consumer activity across more than 1.5MM online product pages from more than 1,200 retail/brand sites.

This time, we focus on a five-month period (starting February 24 2020 and ending July 26 2020). Each report, we specifically analyze review submission levels, review length and sentiment, overall conversions/sales volumes and review consumption (both absolute and among those who go onto purchase).

After seeing drastic extremes over the course of March through May, we experienced continued stabilization for the second month running. Again, the overriding theme seemed to be that the market had well and truly settled into a “new normal”.

Key ecommerce market trends

01

Ecommerce purchase volumes and site traffic consistent over the past month

02

Review submission volumes continue to trail off, but still at higher levels than pre-pandemic

03

Reviews still converting more shoppers to buyers than before pandemic

Ecommerce purchase volumes and site traffic consistent over the past month

Over the past four months, we have reported aggressive growth in ecommerce purchase volumes since we started measuring at the back end of February. We consistently saw 3x increases in purchase volumes during April and May. However, this started to tail off in June, a trend that continued in July.

If you analyze the last two months, a very slight but notable decrease is actually evident. It’s too early to tell how significant or long lasting this will prove to be. However, there certainly appears to be clear overall stability with less drastic fluctuations evident. July ecommerce purchase volumes still peaked at almost double where they were at the end of February.

Traffic too has stabilized, remaining consistent over the past two months. As we mentioned last month, customers are now far more comfortable shopping online but have become less decisive over the course of the COVID era – perhaps due to broader economic uncertainty, job insecurity, and associated pressures.

Both traffic and purchase volumes stabilize throughout June and July
Both traffic and purchase volumes stabilize

Review submission volumes continue to trail off, but still at higher levels than pre-pandemic

In the June snapshot, we reported a giant 2.3x leap in review submission levels from April to May before highlighting a slight drop last month. These levels were maintained through July 2020.

However, it’s important to note that review submission volumes are still around 20% higher than where they were pre-pandemic. This is despite an initial drop off throughout March, when review submission actually fell right at the time “Stay at Home” orders kicked in. Consumers probably had bigger concerns at that time than writing product reviews.

In terms of the actual content of reviews, there were not any huge shifts. Sentiment – in the form of average rating – remains flat, which makes sense given the products themselves are unlikely to have changed significantly in this period. Review length is down slightly on pre-pandemic levels but, given the average review length is 154 characters, a decrease of 10-20% is not particularly significant or meaningful. In our June webinar, we focused on review length in detail and offered some tips how to improve review quality. Check out our blog for a summary of that webinar.

Review submission volumes continue to decline but up on pre-COVID
Review submission volumes continue to decline
Review length and ratings stable throughout COVID era
Review length and ratings stable throughout

Reviews still converting more shoppers to buyers than before pandemic

As with the other trends we highlight, the impact of review content on consumer behavior remains relatively consistent with what we saw in previous months. In other words, review content continues to be more influential on the path to purchase than it was before the pandemic. 

However, while the June and July high in total review interactors were identical (at 66% above the end of February levels), the proportion of review interactors who went onto purchase is actually down (the July peak was 63% below the equivalent figure for June). So consumers are interacting with review content at the same rate as they were last month but are then going onto purchase less than they were then. This is consistent with July’s decrease in orders overall and aligns with the idea that shoppers are becoming more comfortable browsing online, and are less “decisive” in their shopping habits.

But the bottom line remains: Shoppers are still heavily relying on review content to assess product quality and make purchase decisions.

Reviews interaction levels stable from June to July
Reviews still convert shoppers to buyers at higher rate than before pandemic
Reviews still convert shoppers to buyers at higher rate

Summary

The story for the August snapshot is stabilization. There are slight declines in many of the metrics we capture but they are not significant. Last month’s assessment that consumers have settled into a “new normal” when it comes to ecommerce seems to have largely borne out.

However, the declines in activity are certainly worth watching. Will they continue into something more significant or will they creep back up to what we saw in May and June?

The crazy numbers we saw at the start of the pandemic appear now to be a drastic reaction to drastic and unprecedented circumstances. It seems to be a safe bet that the more stable trends of May, June, and July will continue into August and beyond given there’s no end to the pandemic in sight.

The Definitive Guide to Product Sampling

By now, the value of reviews in converting browsers to buyers is well known. More reviews on your site = more sales.


Product sampling – the act of sending free or discounted samples of product to a consumer – is a proven strategy for accelerating the review generation process.


But product sampling campaigns contain a number of different elements and are serious challenge to execute.

shutterstock_680976457

View our nuts-and-bolts Guide to learn:

How following best-in-class product sampling methodologies generate on average 85% review completion rates

The typical scenarios that lead brands to implement product sampling campaigns

The nine steps you need to follow to execute outcome-driven product sampling campaigns

Start Boosting Sales Performance with Product Sampling

Paige Thulin

This is the fourth edition of our monthly snapshot (most recent versions here and here). This is our July version of the same report, analyzing consumer activity across more than 1.5MM online product pages from more than 1,200 retail/brand sites.

This time, we focused on a four-month period (starting February 24, 2020 and ending June 28, 2020). In each report, we specifically analyze review submission levels, review length and sentiment, overall conversions/sales volumes, and review consumption (both absolute and among those who go onto purchase).

We are seeing stabilization in most of the data we capture, as the market seemingly adapts to a new “normal”. But let’s dig deeper into the specifics of what this actually means.

Key ecommerce market trends

01

Both online order and traffic volumes flatten out to a (revised) “new normal”

02

Review submission levels fall slightly, but still significantly above pre-pandemic norms

03

Review content continues to be critical to converting browsers to buyers, with review consumption among those who purchase up on pre-pandemic levels.

Both online order and traffic volumes flatten out to a (revised) “new normal”?

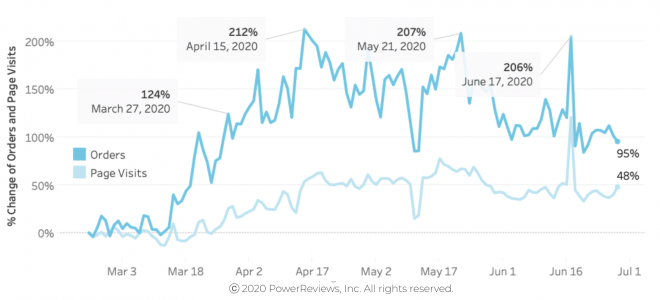
Over the past three months, we have reported aggressive growth in ecommerce purchase volumes since we started measuring at the back end of February. We speculated then that we had hit a potential “new normal” with highs of a 3x increase between that end of February date consistent across both April and May. We also pondered the impact of “Stay at Home” orders being lifted, as was the case in some states in June.

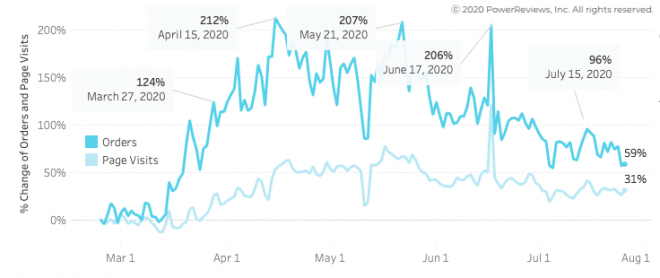
Throughout June, this certainly had an affect. We saw fluctuating demand during the month, with highs (of 206% above end of February levels) consistent with April and May. But, for the most part, we saw lower order volumes than we did in those two months. On our last date for capturing this data (June 28th), order volumes fell to around double (+95%) what they were pre-pandemic. They were approximately at this level throughout June, indicating that reopening was definitely having an impact. COVID-19 has clearly driven consumers online and so it’ll be very interesting to see if this sticks longer term.

Traffic has increased steadily over the past four months and hasn’t shown any sign of falling recently, which demonstrates a clear shift in consumer behavior. Customers are now far more comfortable shopping online but have become less decisive – perhaps due to broader economic uncertainty, job insecurity and associated pressures.

Both traffic and purchase volumes stabilize in June
A (revised) “new normal” in place across the board

Review submission levels fall slightly, but still significantly above pre-pandemic norms

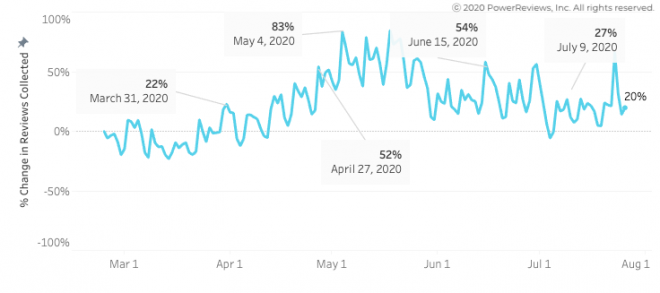
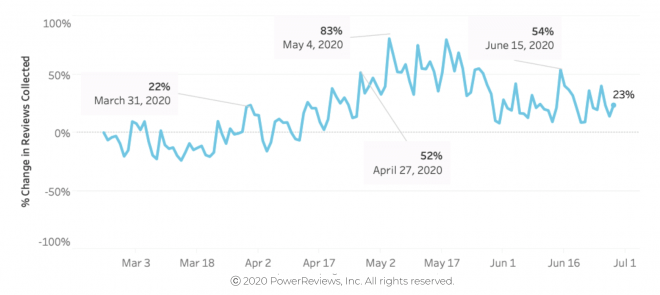
In last month’s snapshot, we reported a giant 2.3x leap in review submission levels from April to May. After this big increase, volumes dropped in June – peaking at 54% above pre-pandemic levels on June 15 (consistent with the high in April). This is to be expected to a certain extent given the drop off in purchase volumes reported above.

However, it’s important to note that review submission volumes are still way above what we saw pre-pandemic. This is despite an initial drop off throughout March, when review submission actually dropped right at the time “Stay at Home” orders kicked in.

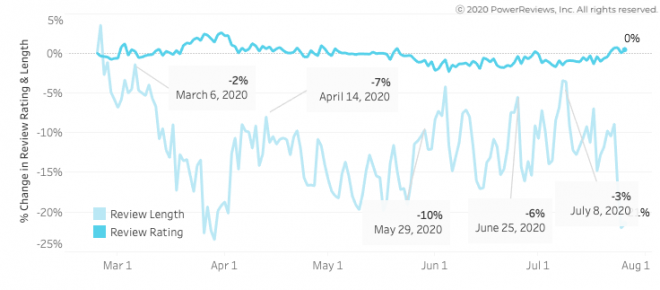
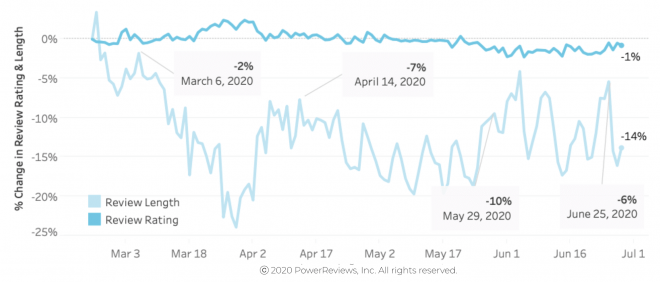
In terms of the actual content of reviews, there were not any huge shifts. Sentiment – in the form of average rating – remains flat, which makes sense given the products themselves are unlikely to have changed significantly in this period. Review length is down slightly on pre-pandemic levels but, given the average review length is 154 characters, a decrease of 10-20% is not particularly significant or meaningful. In last month’s webinar, we focused on review length in detail and offered some tips how to improve review quality. Check out our blog for a summary of that webinar.

Review submission volumes fall slightly in May but up on “normal”
Review length and ratings stable through June
Review length still down very slightly on pre-pandemic levels

Review content continues to be critical to driving purchase decisions

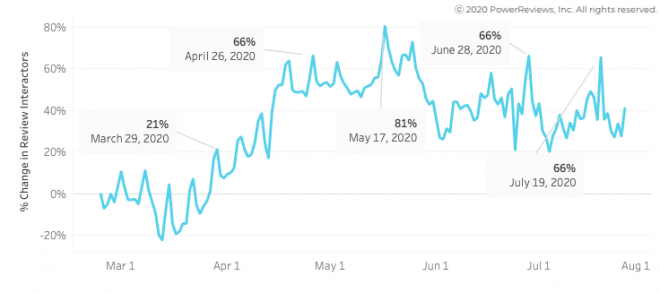
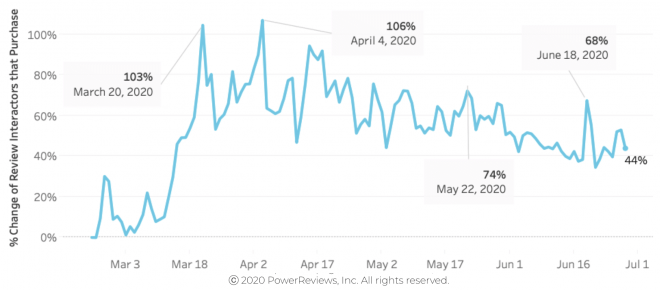
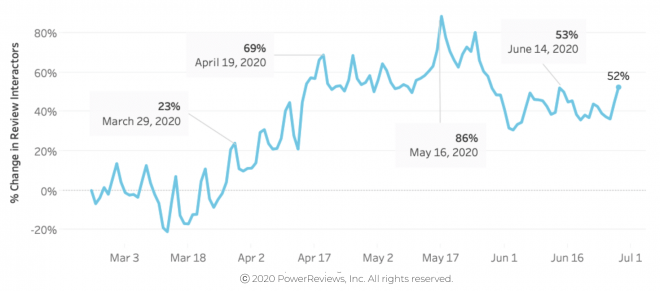
Review content continues to be more influential on the path to purchase than it was before the pandemic. The June high of our review interaction measure (the extent that consumers who convert engage with review content i.e. sorting, filtering, etc.) proved consistent with what we saw in May at 74% and 68% above pre-pandemic levels respectively. Overall review engagement is up around 1.5x on “normal” times. 

With that being said, this has dropped since February and March. There are most likely two reasons for this: 1. Purchase volumes have also fallen in this period and 2. The initial surge was likely due to consumers flooding online, buying products they previously had never bought before, and searching for validation before purchasing.

Bottom line: Shoppers are still heavily relying on review content to assess product quality and make purchase decisions.

Reviews continue to influence purchase at a higher rate than pre-pandemic
Consumers still relying on review content to make buying decisions
Review engagement stable at around 1.5x pre-pandemic
Consumer interactions with online reviews remains high

Summary

The re-opening of a number of states led to month-over-month decreases in most of the metrics we capture: purchase levels, review submissions, and review interaction volumes.

However, these are still way above comparative figures from when we started our research pre-pandemic at the end of February.

Specifically, purchase levels are double what they were pre-pandemic (purchase levels had tripled in May and April). Review interaction volumes have consistently increased, and are up between 50% to 65% during this time period. This is indicative of consumers seeking out greater social proof as they shop for products they are not as familiar with.

Review submission levels are also up from where they were pre-pandemic but have slightly fallen off lately. This is to be expected given the reduction in overall sales volumes.

Given the tightening of restrictions in many states that reopened earlier and the rapid change in consumer behavior more generally, we would expect increases across the board during July.

In the latest guide from PowerReviews...

Learn How to Grow Sales by Showcasing Your Ratings & Review Content to More Shoppers

UGC offers compelling validation and social proof during the buying journey. Generating this content in plentiful volumes across your portfolio is tough. But – once you’ve done this – how do you ensure you then get it in front of shoppers in a way that will generate the most sales?

Read our Guide to learn:

How to build a genuine omnichannel UGC marketing strategy
The many different ways leading brands and retailers use UGC to drive more business
Practical tips you can start using today to better leverage consumer review content throughout the buying journey