








User-Generated Content (UGC) – ratings and reviews, and consumer submitted video, imagery and Q&A content – is typically a core pillar of any successful ecommerce strategy. And with good reason: it’s proven that the more UGC you have on your website, the more sales you generate.
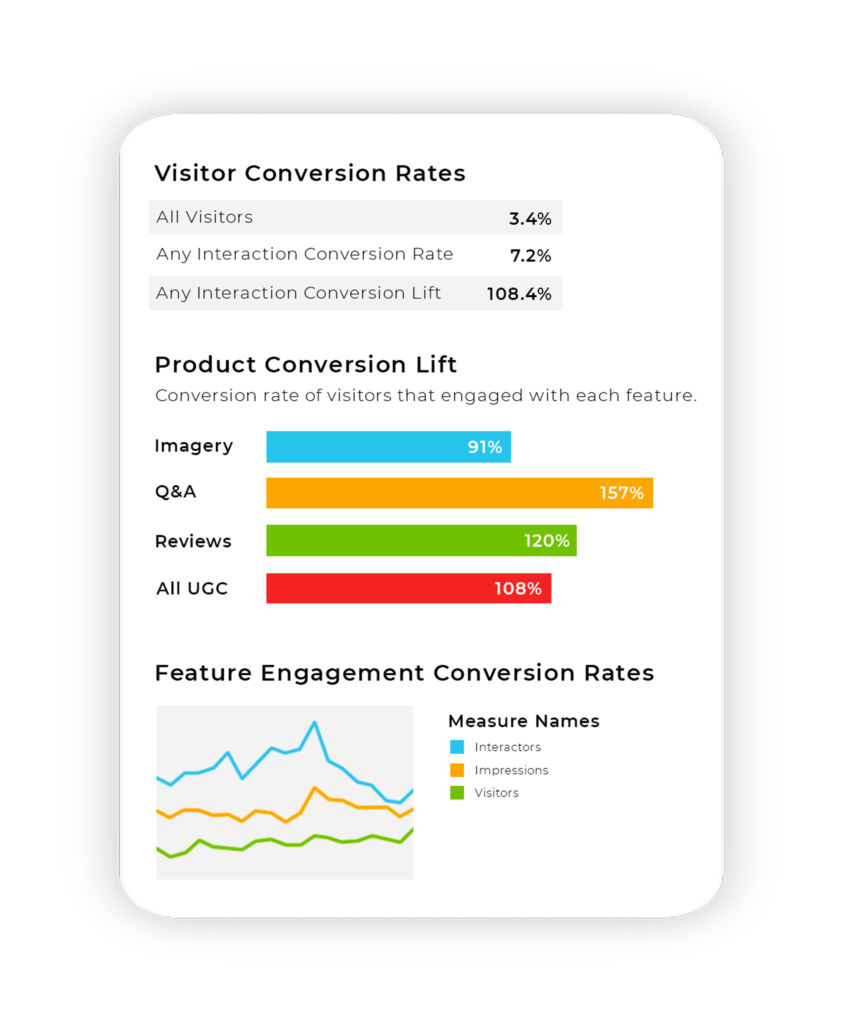
In fact, PowerReviews data from across more than 1,000 brand and retailer websites highlights how consumers who interact with reviews convert at 115% the rate of those who don’t. The same figures for Q&A content and imagery are 153% and 81% respectively.
However, one question we get asked a lot by brands and retailers is: how can we generate more of this content?
There are a wide range of theories behind why consumers opt to provide UGC.
But there isn’t a huge volume of concrete data-driven information examining specific reasons. This survey was conceived to change that. It provides a deep dive into exactly what motivates shoppers to submit all types of User-Generated Content (ratings and reviews, and consumer submitted video, imagery and Q&A content) by exploring the opinions of a total of 10,486 active consumers.
We also dig into whether generational differences affect review submission preferences and behaviors. Does age impact whether consumers are more likely to provide review content? And do different factors motivate different age groups?
Throughout, we offer some tips to optimize UGC collection based on the survey results.
To level set, our 10,486 respondents are active shoppers across the United States who have opted in to offers and discounts from retailers. We ran the survey in October 2020.
To get an idea of how these consumers approach UGC, we first wanted to understand how frequently our participants typically provide ratings and reviews.
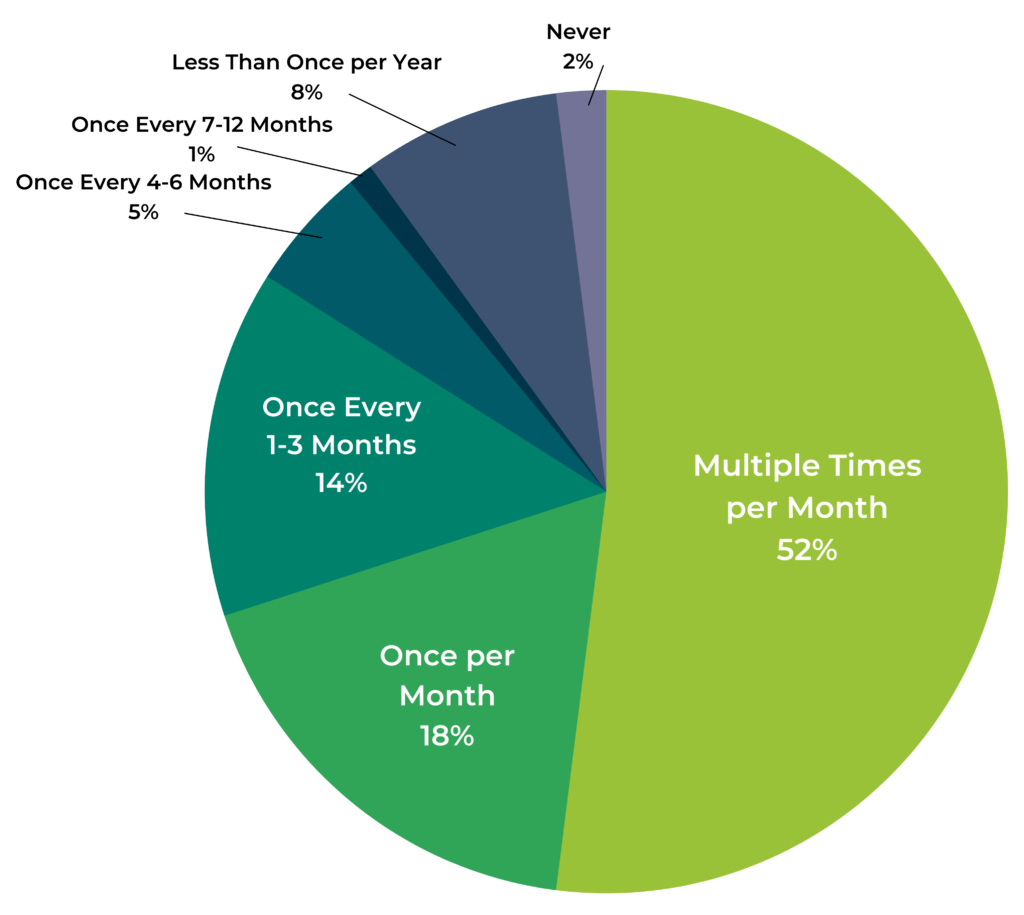
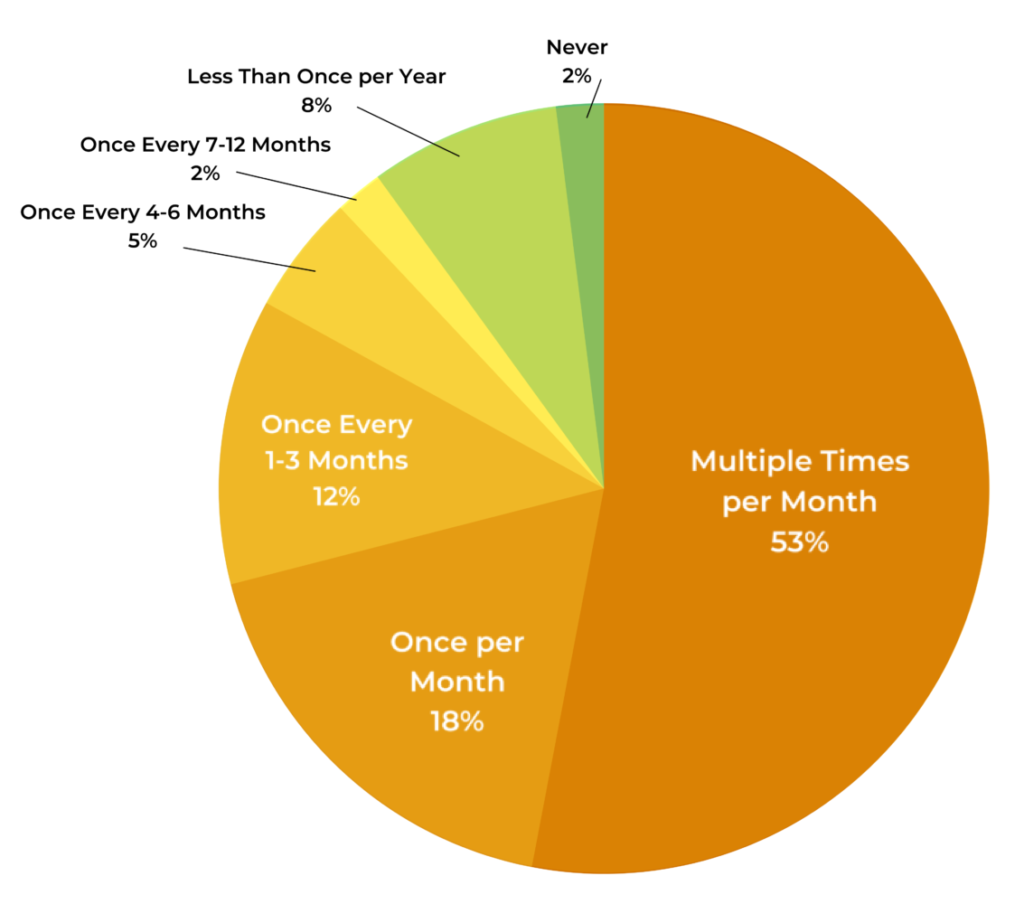
More than half of our respondents claim they provide a product rating or review more than once a month. And almost nine in ten (89%) say they do so at least once every six months.
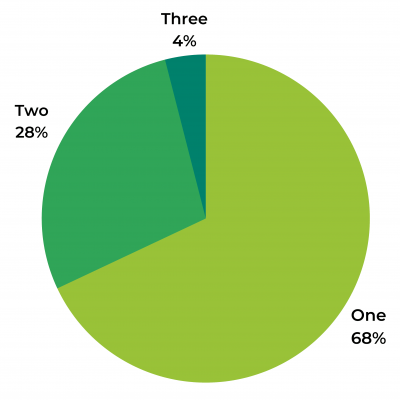
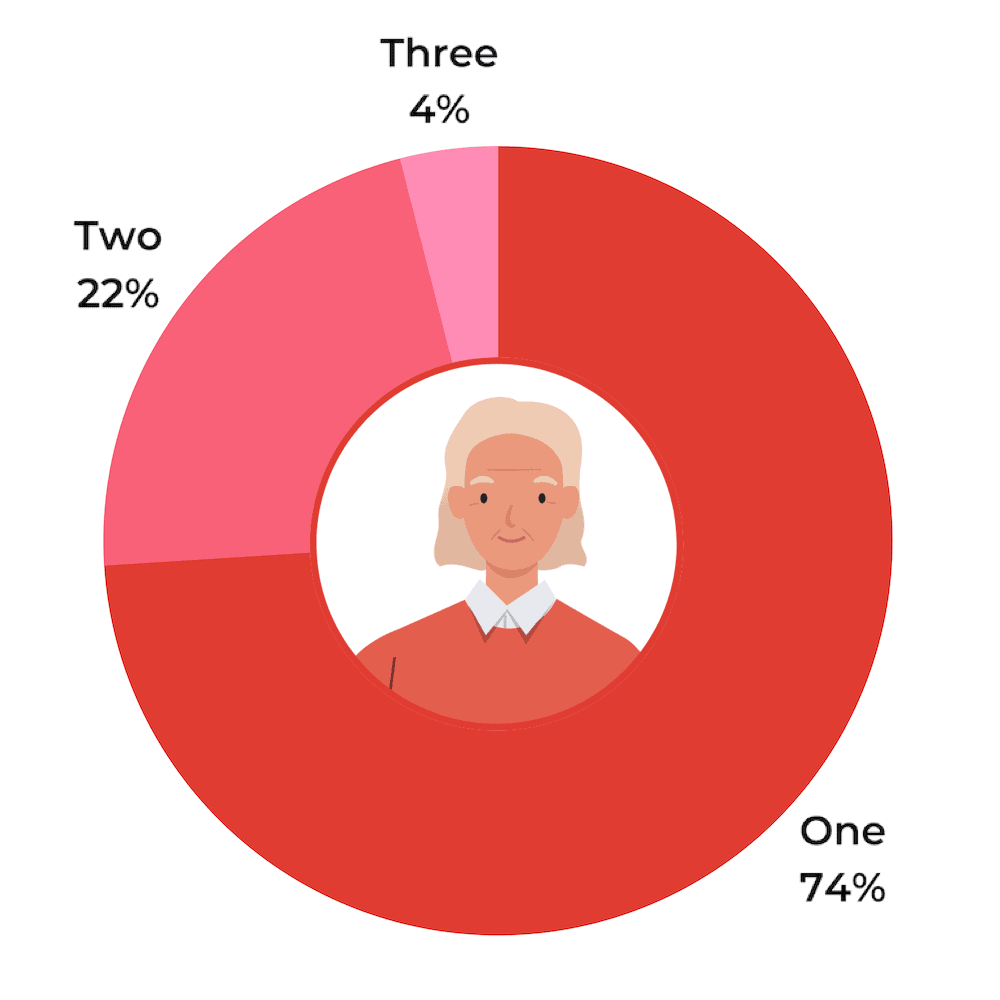
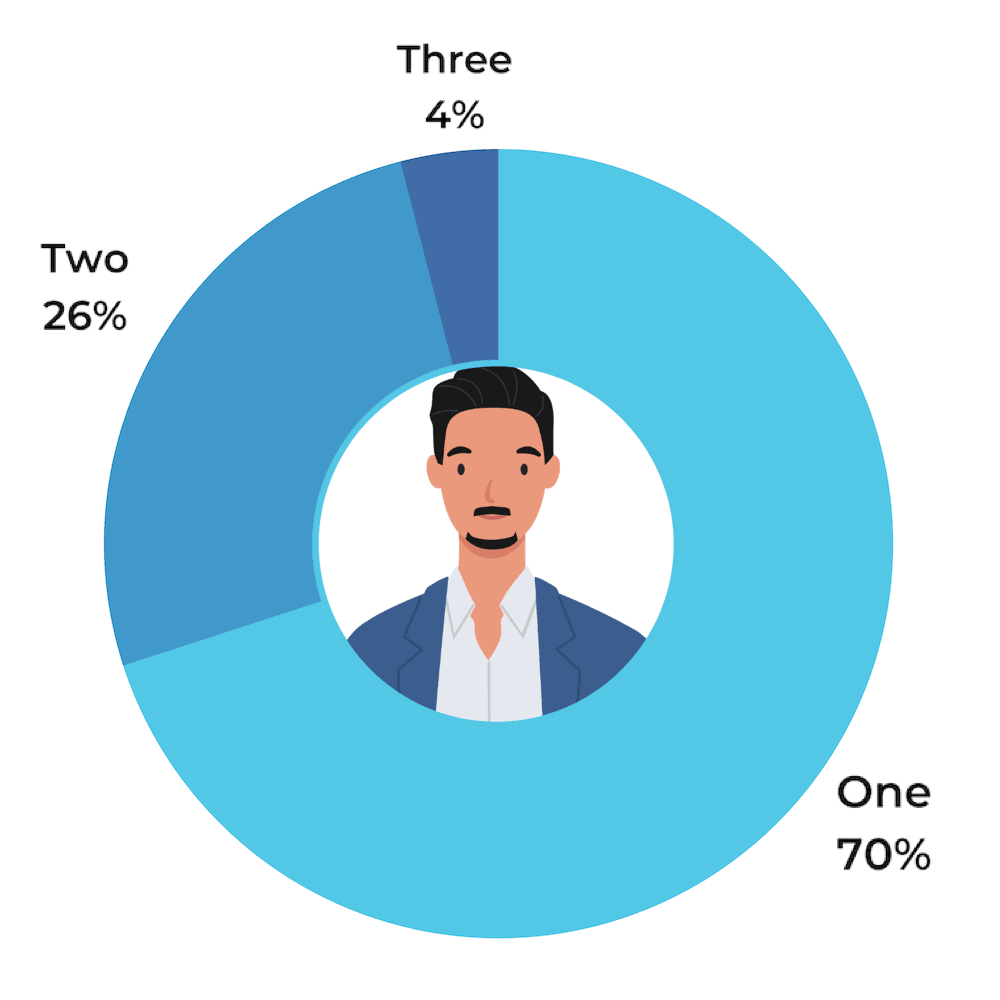
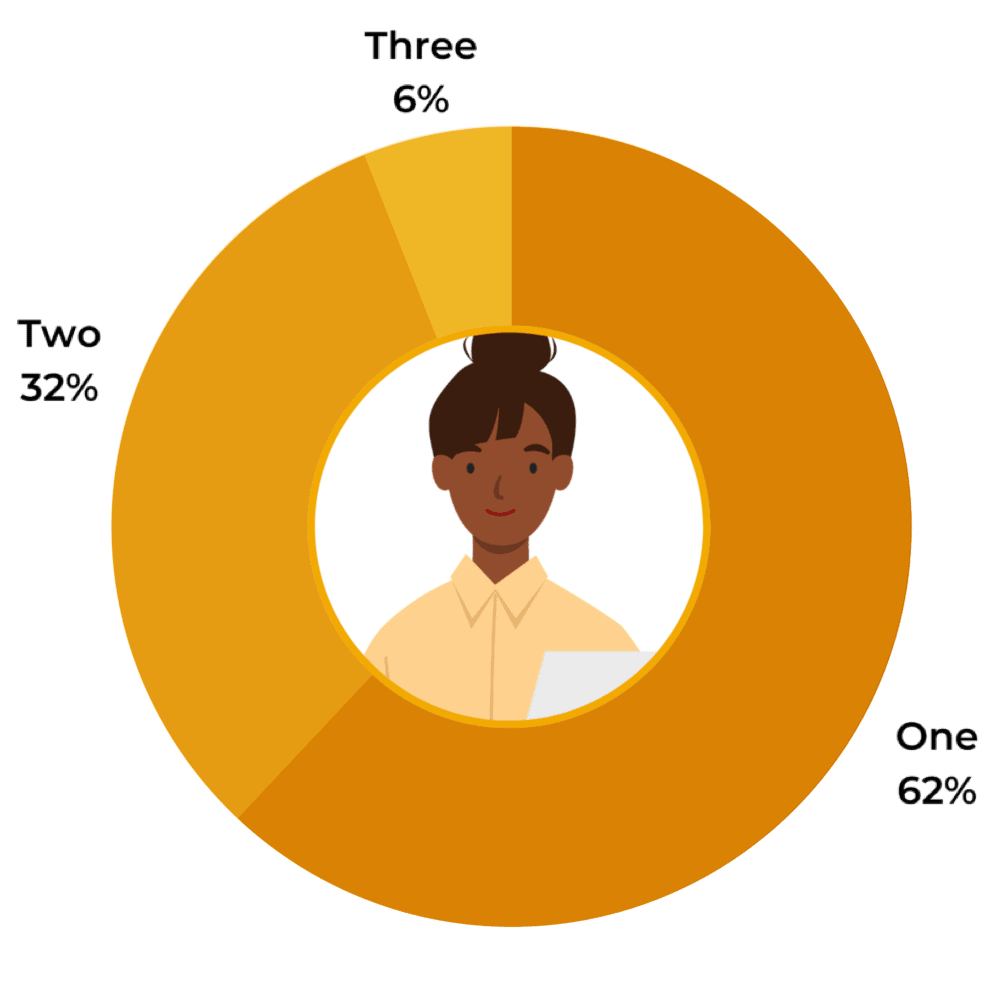
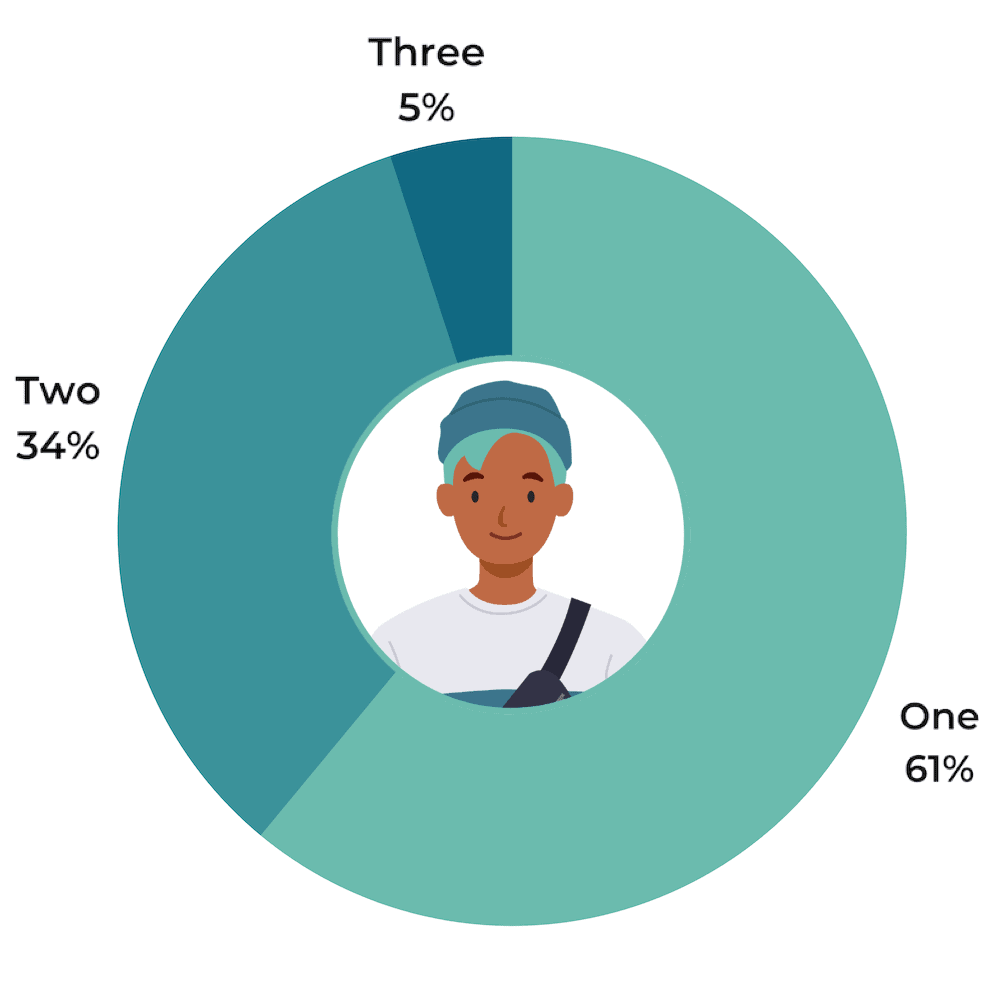
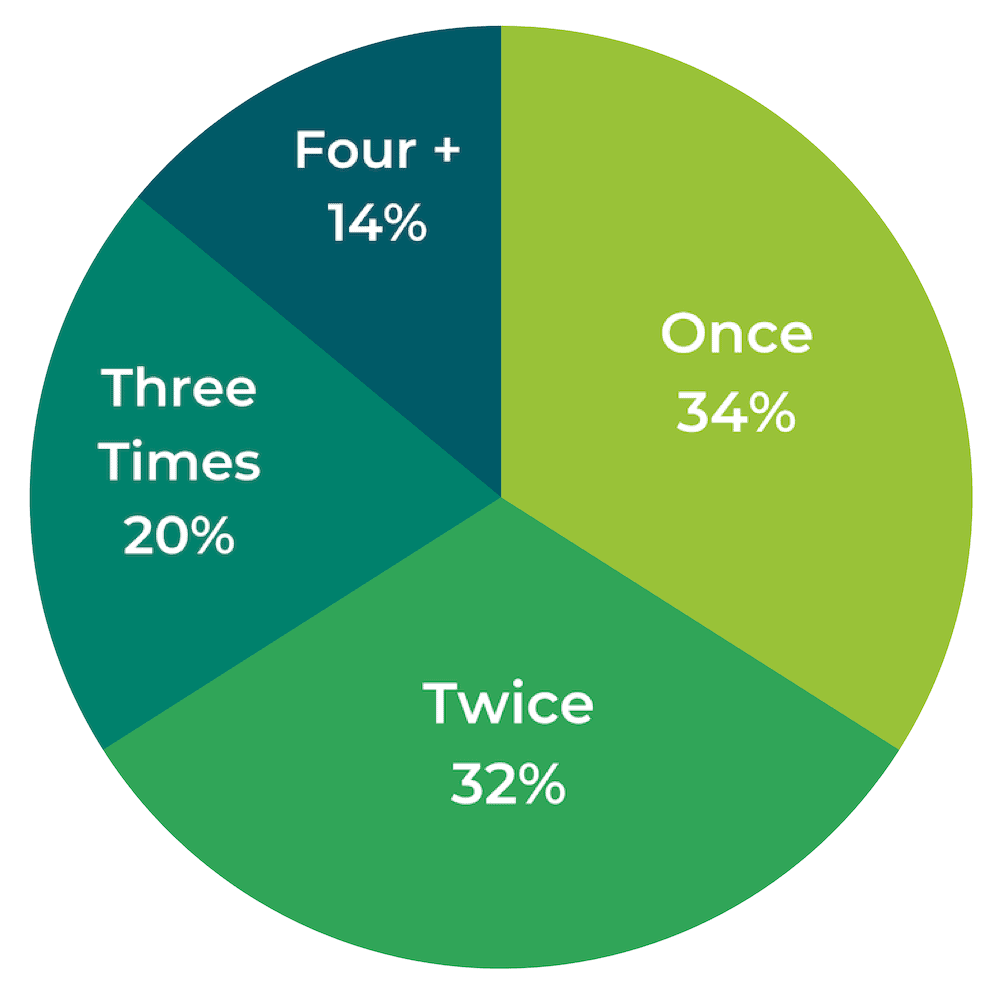
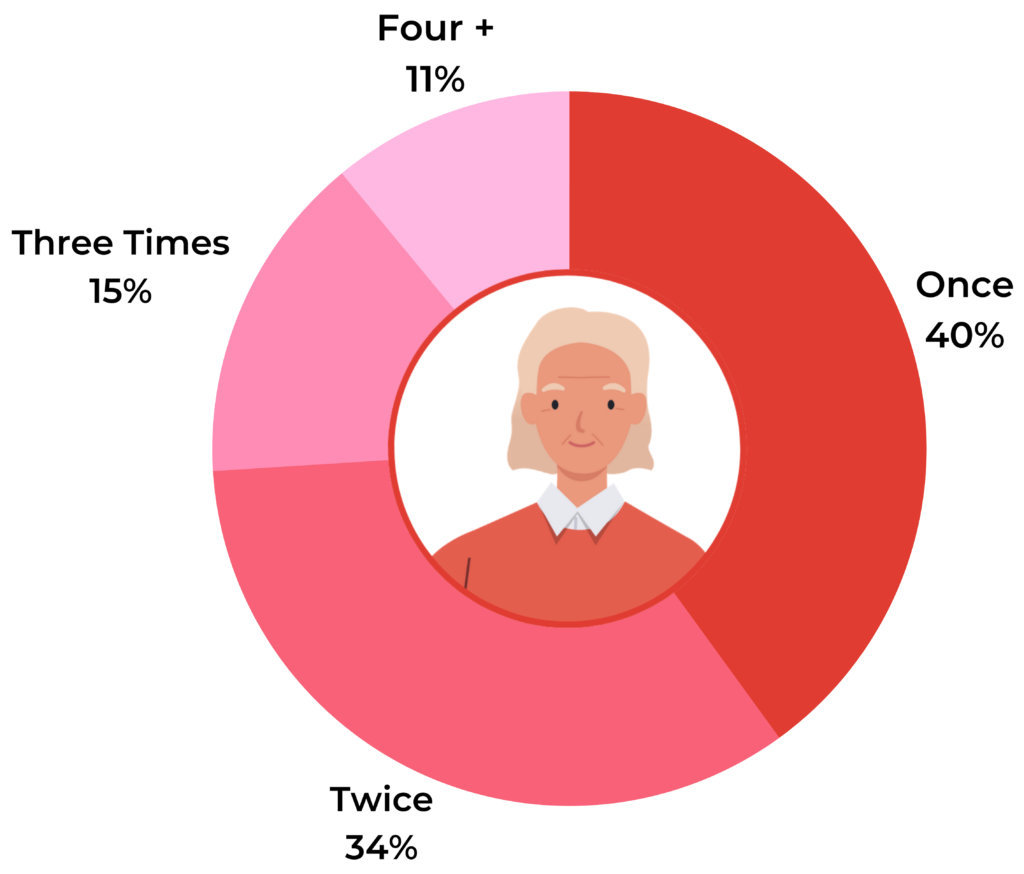
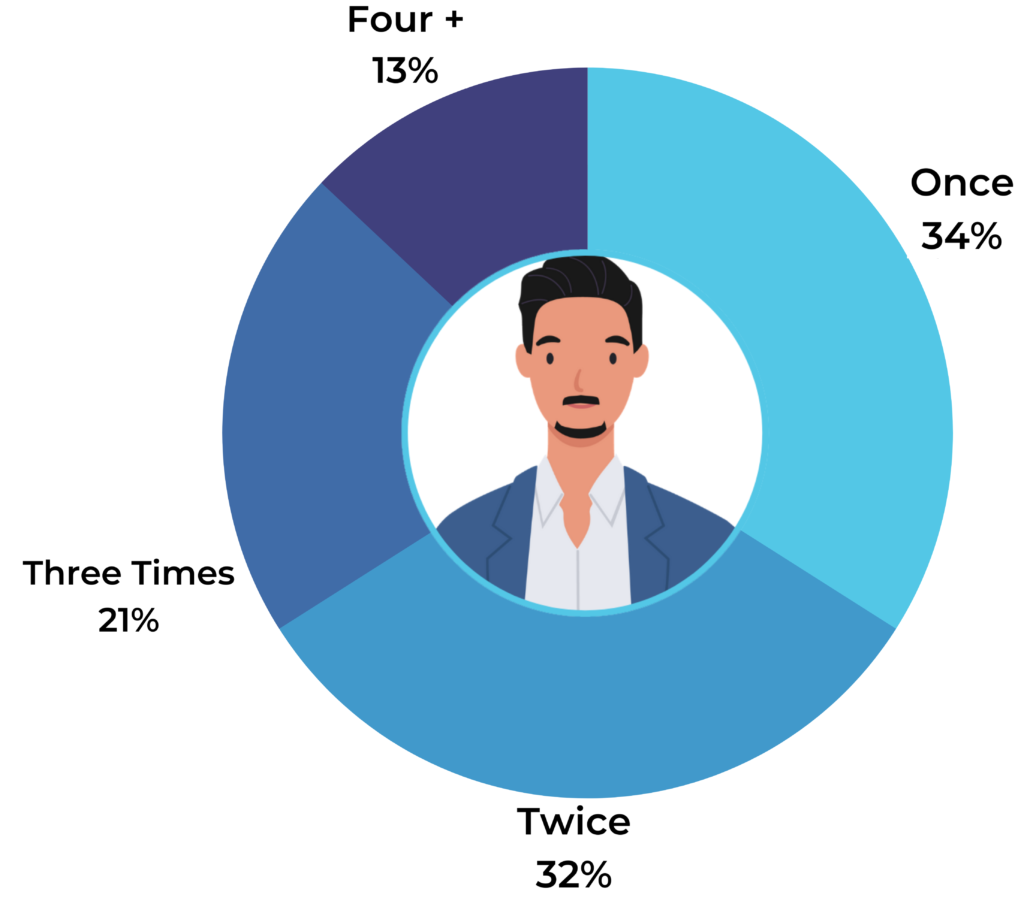
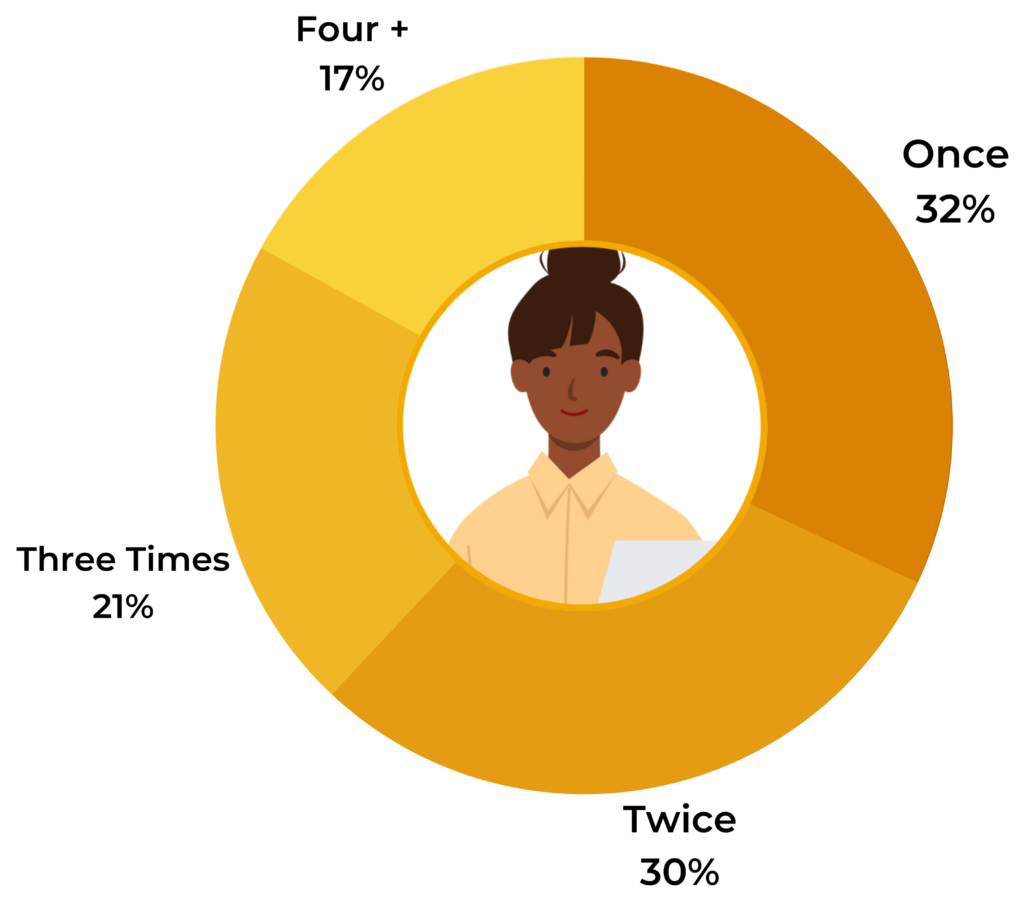
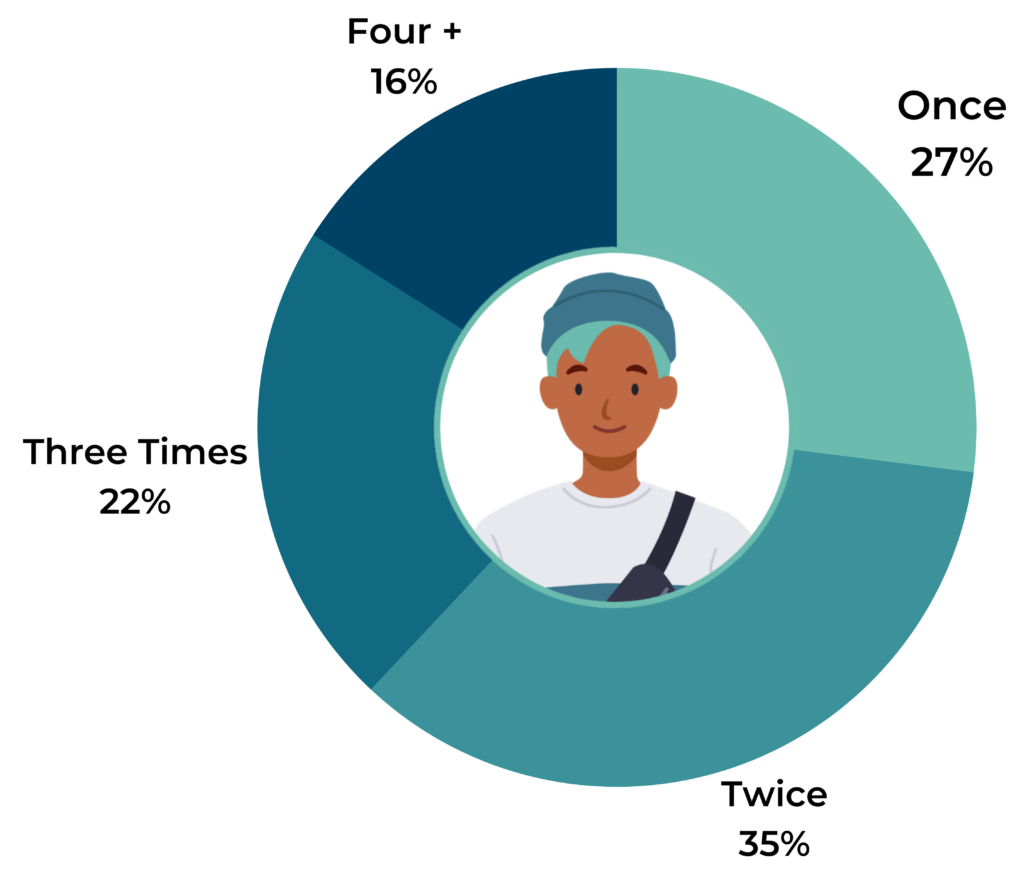
More than two-thirds say they only need to be asked to leave a review once to submit one, while 96% claim they will do so by the second request.
These results show that our survey panel is highly engaged with User-Generated Content (UGC). They submit ratings and reviews in significant volumes.
This means the subsequent findings we highlight are critical for brands and retailers trying to understand how to generate more UGC. Our survey provides crucial insights into how to motivate consumers to provide reviews who are among the most inclined to do so.
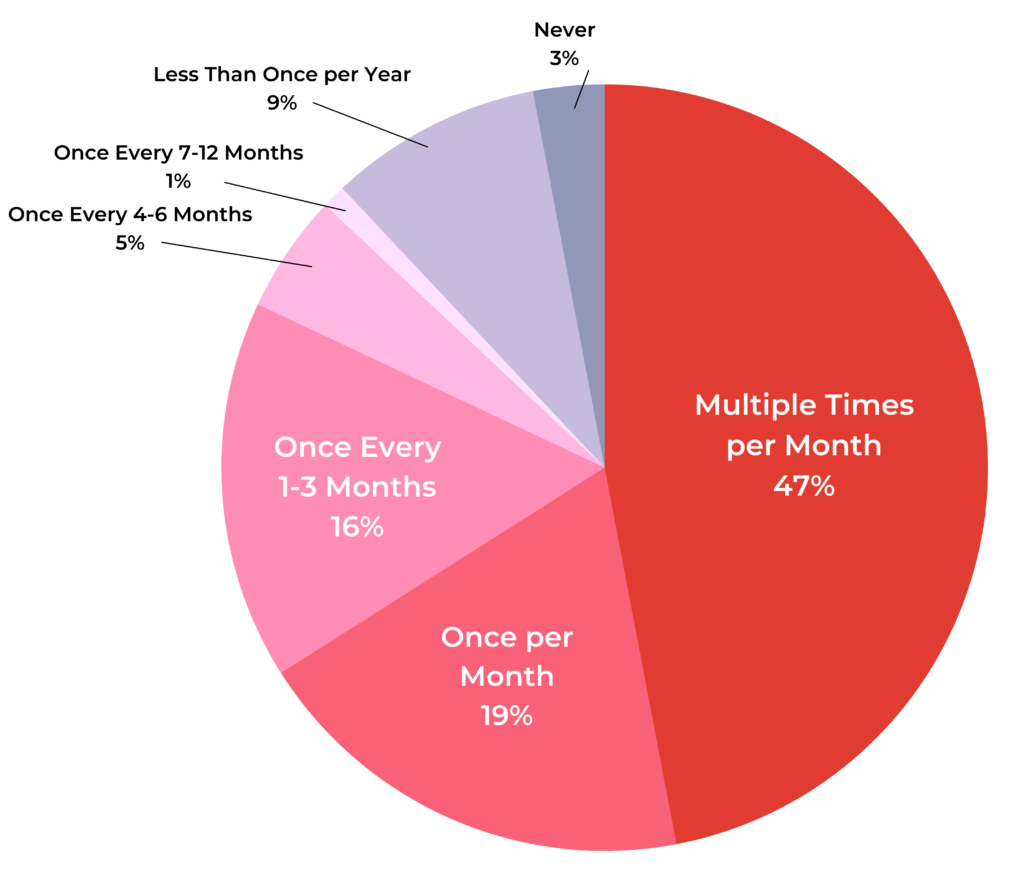
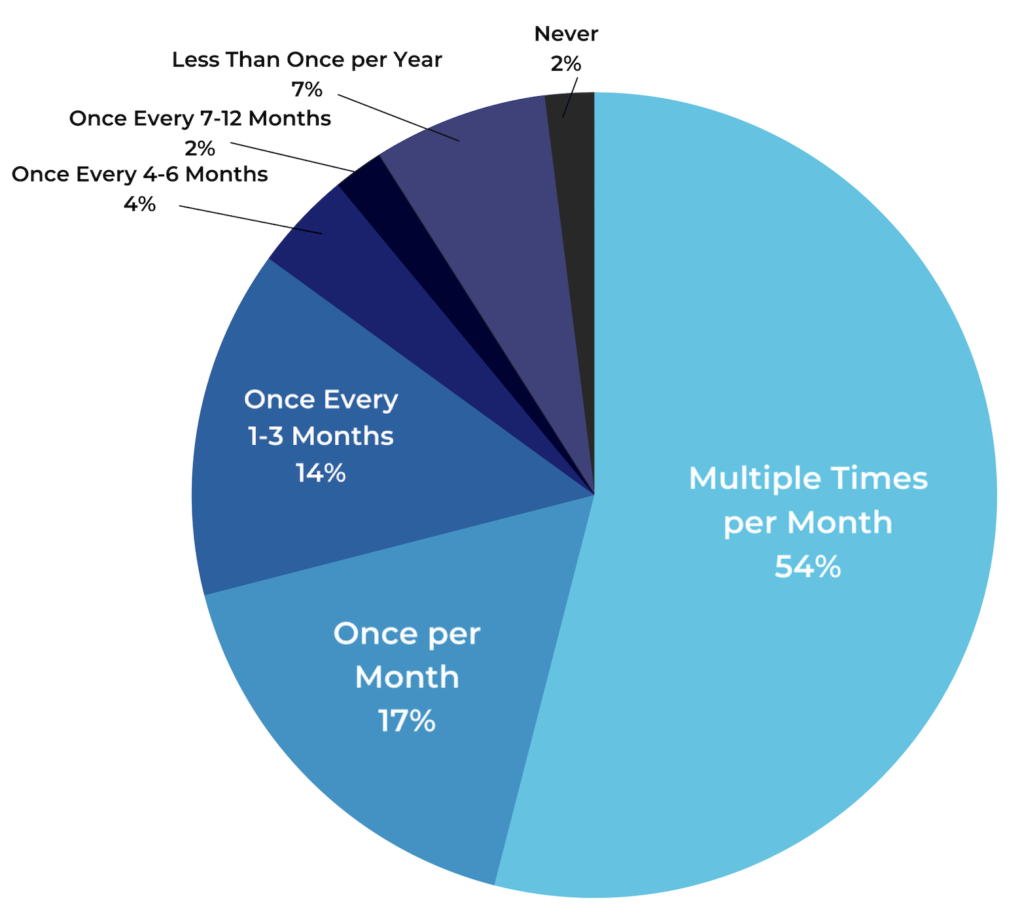
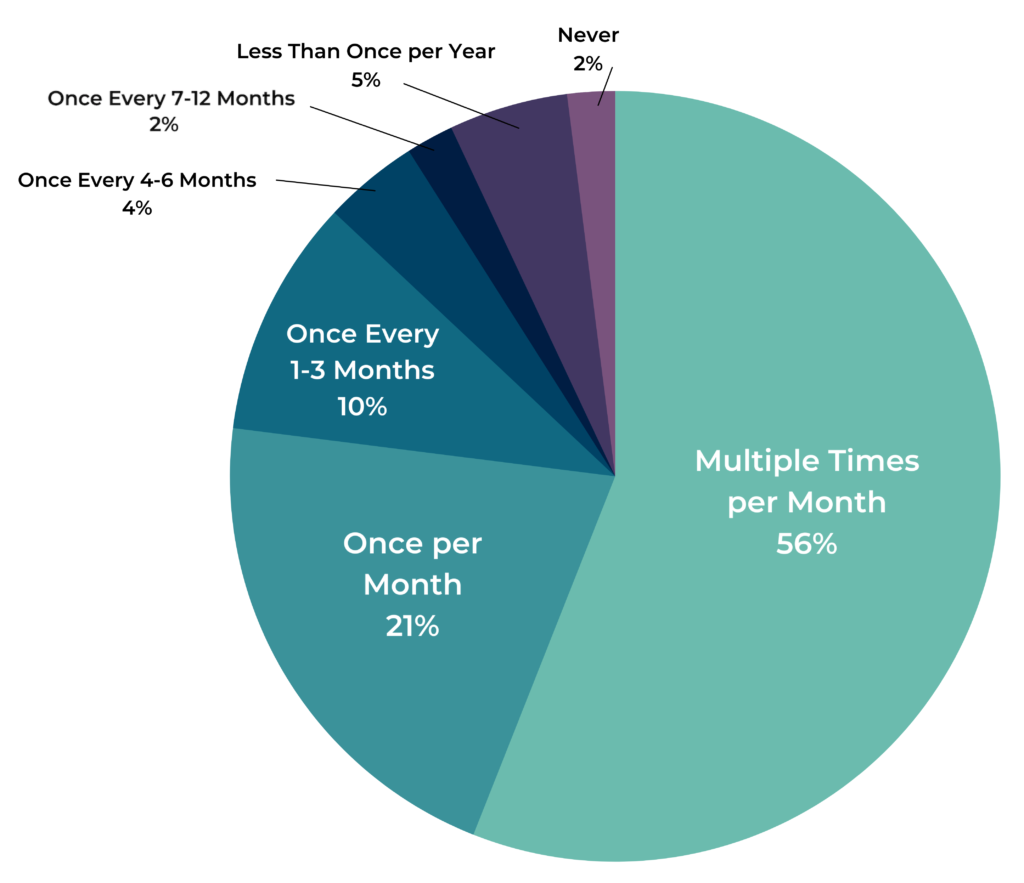
When comparing review submission behaviors according to age, younger generations are more prolific review writers and contributors. 47% of Baby Boomers submit reviews more than once per month, compared to 54% of Gen Xers, 53% of Millennials and 56% of Gen Zers.
However, younger generations also need to be asked to provide this content on more occasions before they do so. 61% of Gen Zers say they will submit a review on the first request, compared to 62% of Millennials, 70% of Gen Xers and 74% of Baby Boomers.
Based on our results, younger generations are overall more committed to providing reviews but less immediately responsive to initial requests.
As a starting point, we wanted to understand the main motivating factors for consumers to provide product ratings and reviews.
We based the response options on our experience of working on UGC programs for a number of years at more than 1,200 brands and retailers. In other words: this is what we and our own customers believe to be the main reasons that their customers offer up this content.
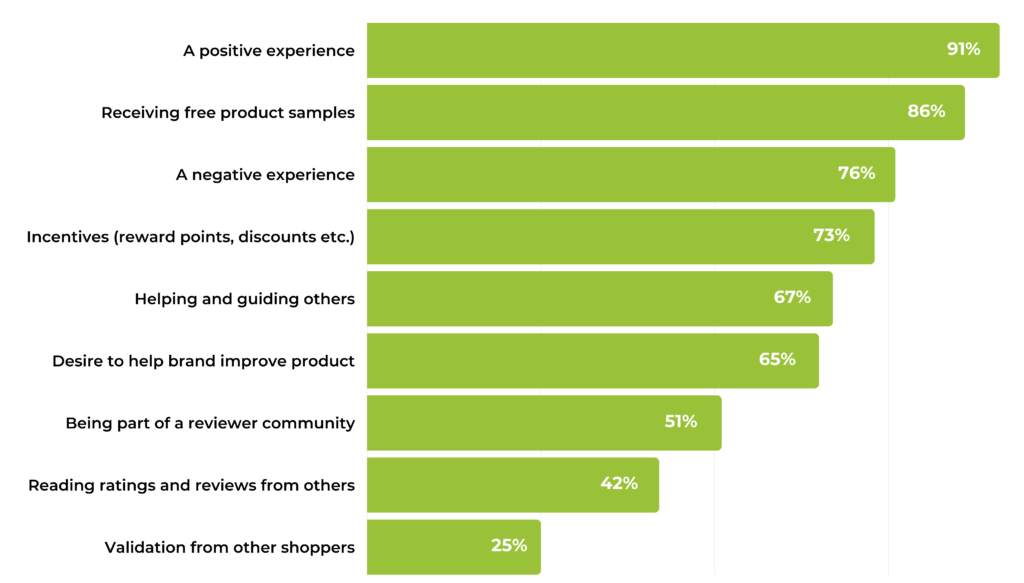
Our responses provide an easy-to-rank list of the most important motivating factors for consumers. Our top ranking result shows there is simply no substitute for a good experience. More than nine in ten say this is the primary reason they choose to provide this content.
By the same token, a negative experience also leads more than three quarters to leave a product rating and review.
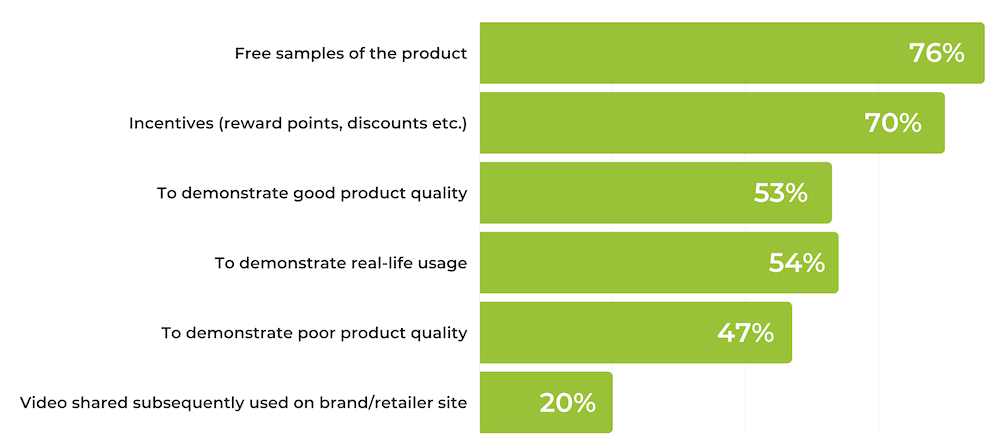
With that being said, incentives clearly – if employed correctly – can stimulate review content. A free sample of the product is a critical motivating factor for a massive 86% of respondents. Incentives are also important for 76% of the consumers surveyed.
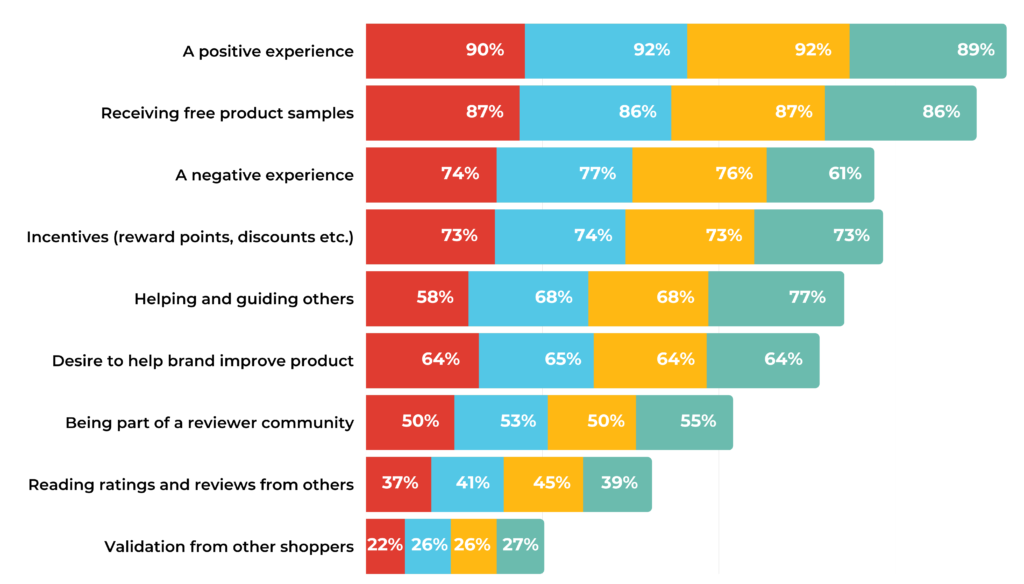
In terms of reasons consumers provide review content, there are not too many cross-generational differences.
Regardless of age, a similar volume of respondents feel compelled to submit ratings and reviews if they:
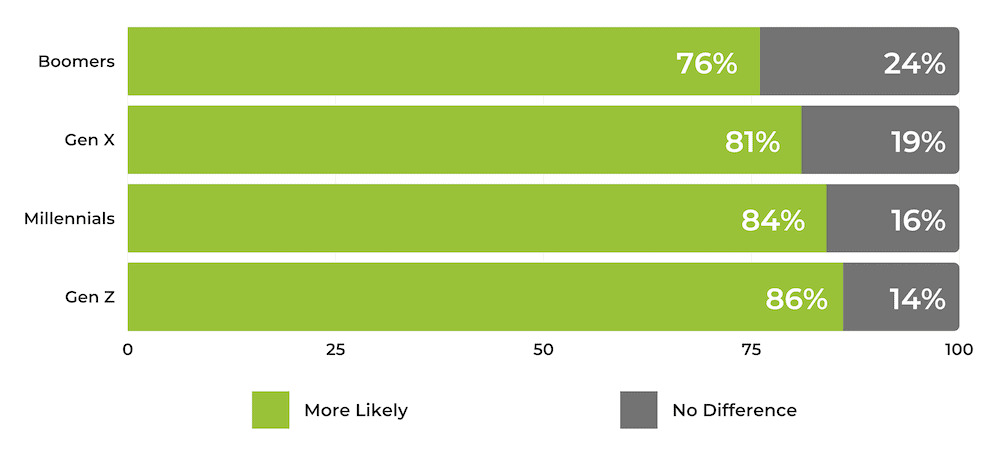
The one factor where we identified a clear trend was a desire to help and guide others – younger generations are significantly more motivated to provide reviews for this reason (77% of Gen Zers, compared to 68% of millennials, 68% of Gen Xers and 58% of Baby Boomers).
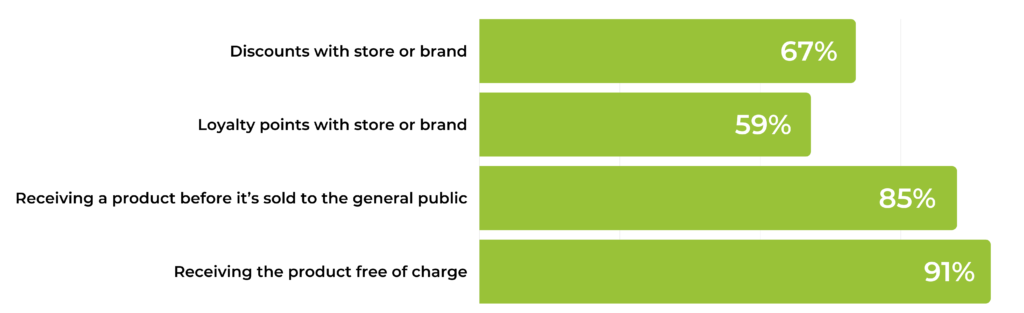
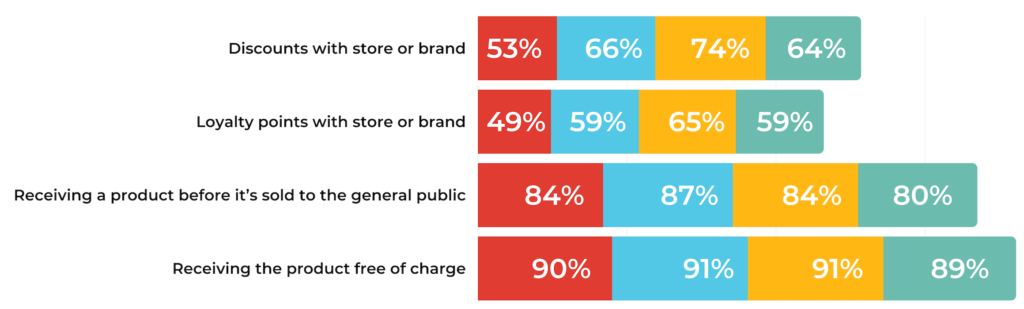
With consumers seeking incentives in exchange for submitting ratings and reviews, it begs the question: what incentives particularly motivate them to do so?
Unsurprisingly perhaps, any incentive can be used to generate more review content. But two particularly stand out: receiving the product to be reviewed free or before it officially hits the shelves (digital or physical).
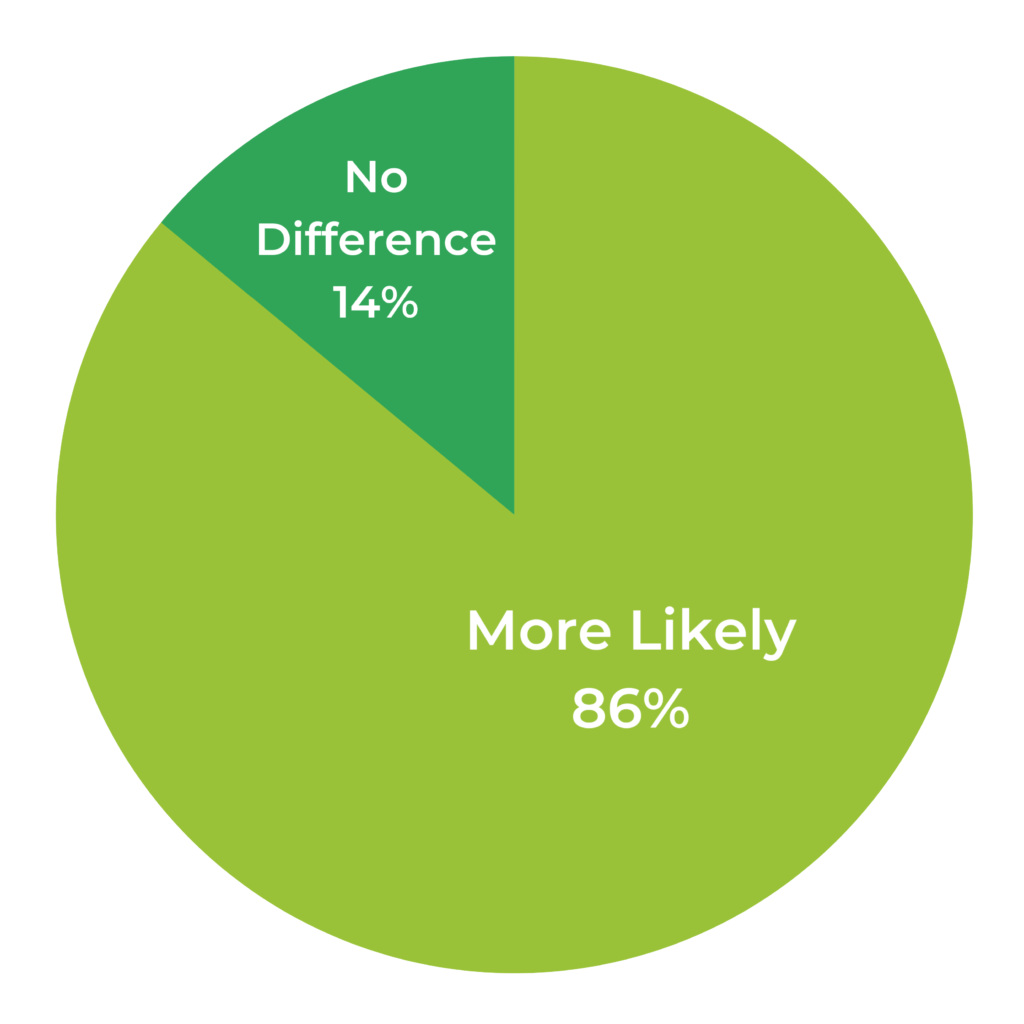
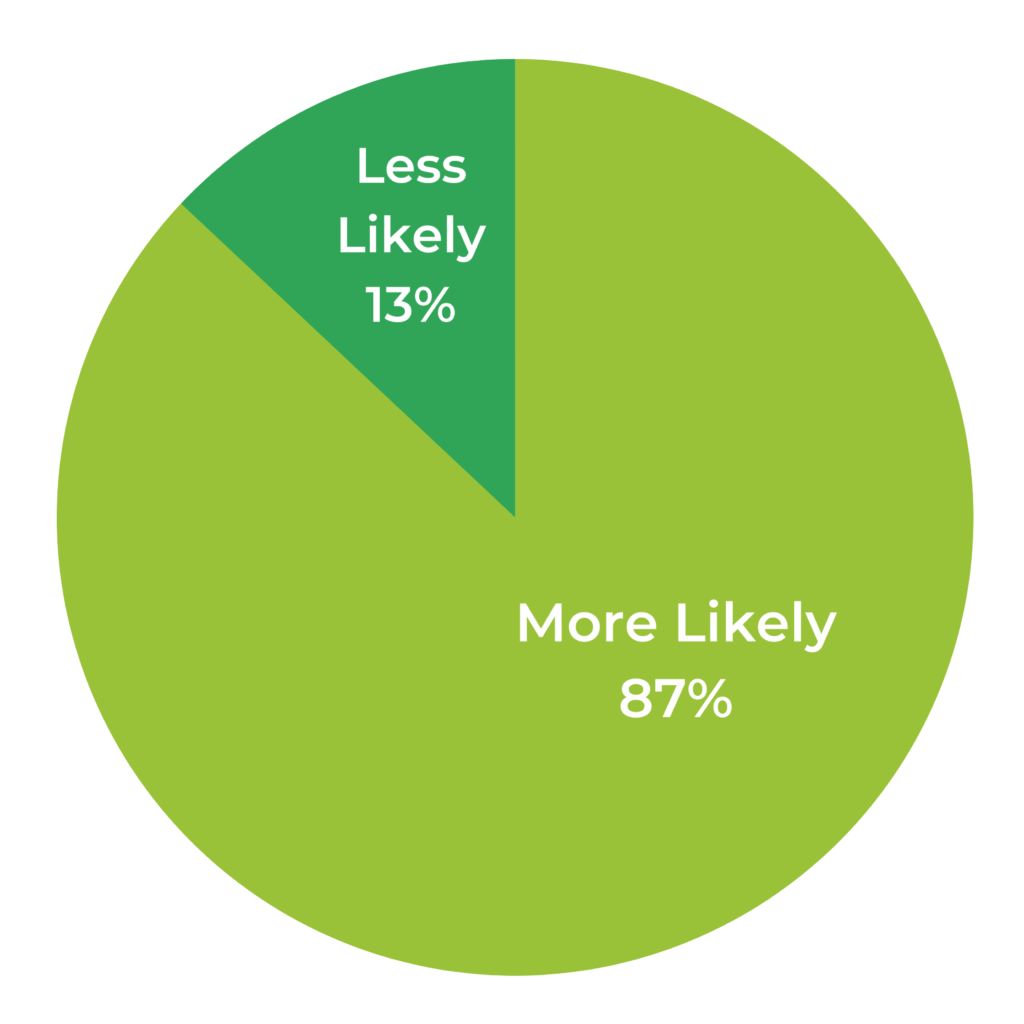
Although near the bottom of the rankings in the list of motivating factors (only 42% claimed this would lead them to submit a review), reading existing ratings and reviews content does still have an impact.
In fact, these results show that 1) reading reviews from others and 2) low review volumes is still a significant motivator.
One question we get asked a lot: how long after asking for a review is it likely to be generated? We explored this topic with our respondents, also questioning them about typical product usage before submitting this content.
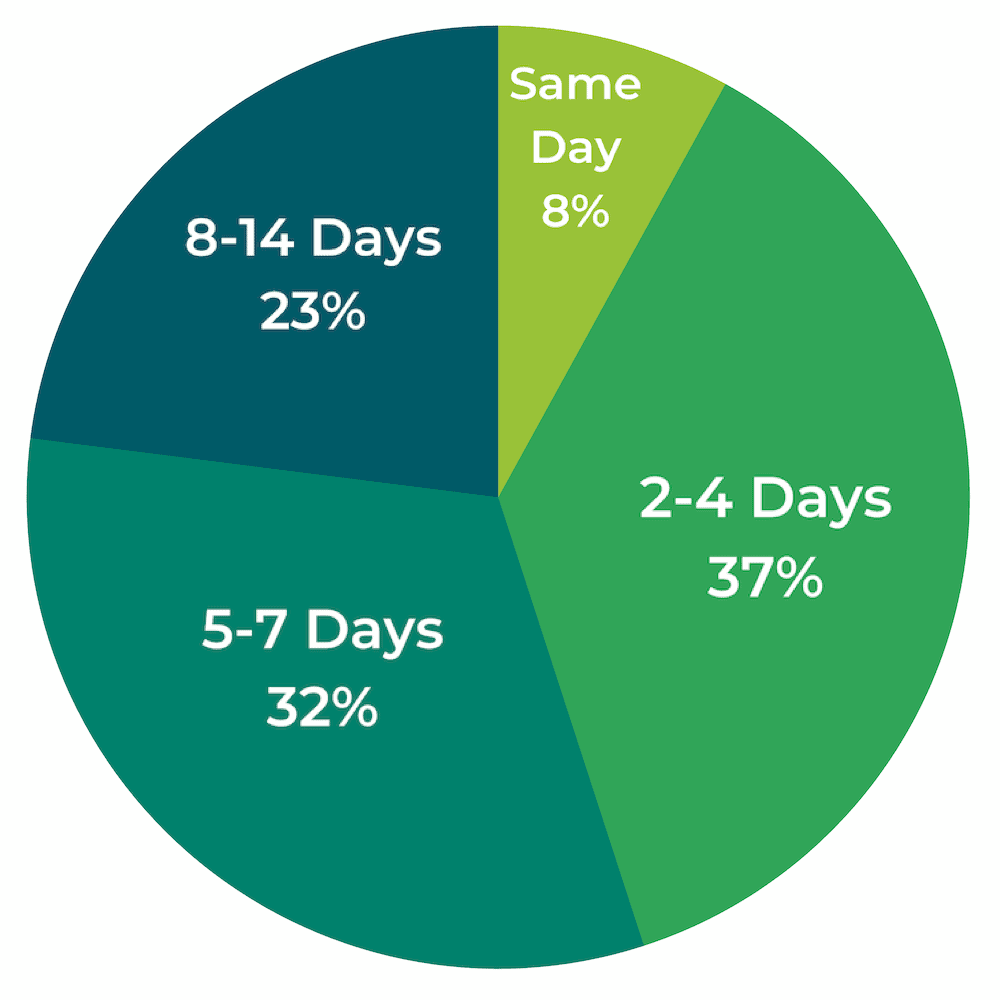
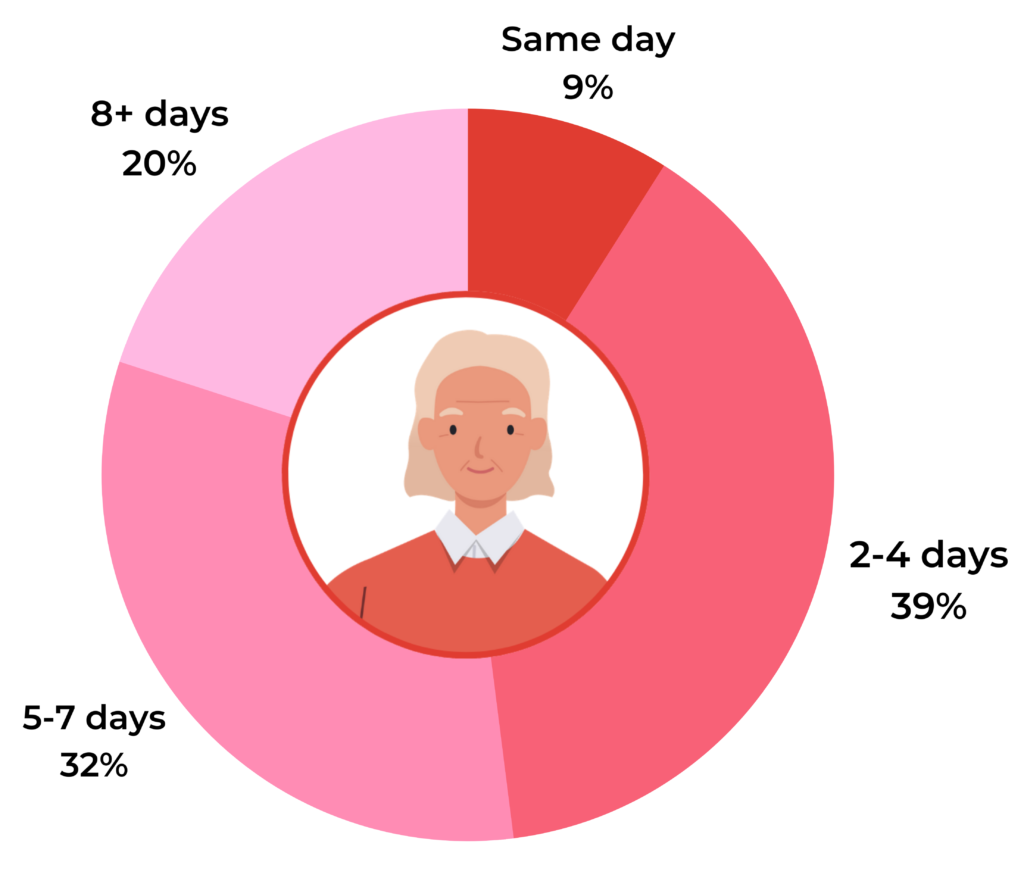
The vast majority of respondents submit review content within a week of receiving the product (76%) or within the third usage (86%) of the product. Few do so immediately but a surprisingly high third of all consumers surveyed will provide a review after only using the product once.
Likelihood to provide a rating and review after only one use increases with age: 40% of Baby Boomers submit reviews after one use, compared to 27% of Gen Zers. It appears that younger consumers like to more robustly road test products before delivering their verdict.
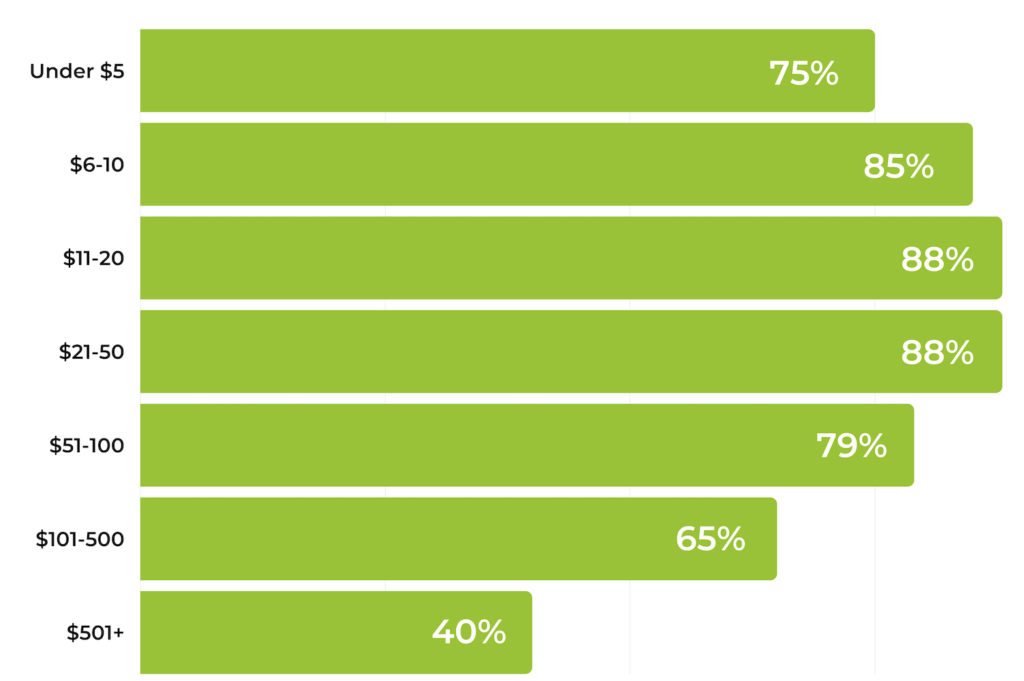
We wanted to explore whether product price point has an impact on the likelihood to submit review content. We know more expensive products typically require higher buyer consideration, so we wanted to see if this was reflected in motivation to submit reviews.
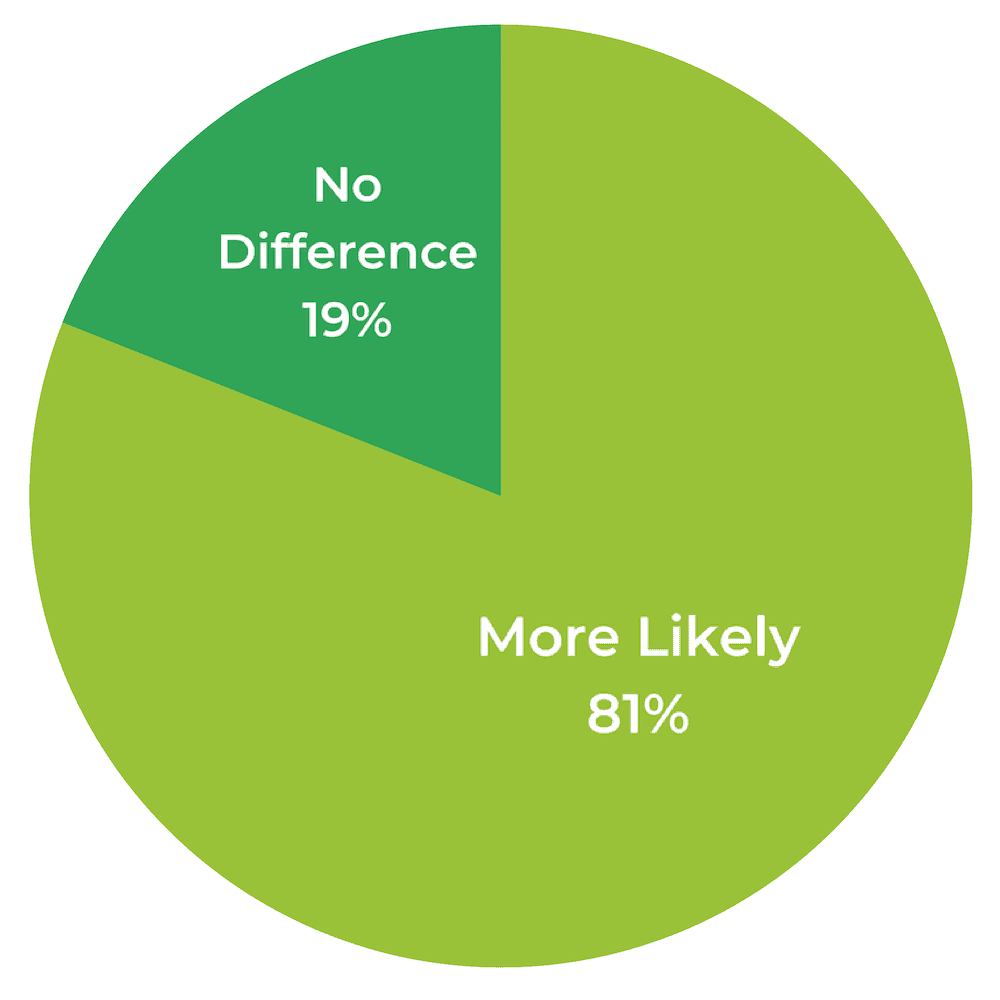
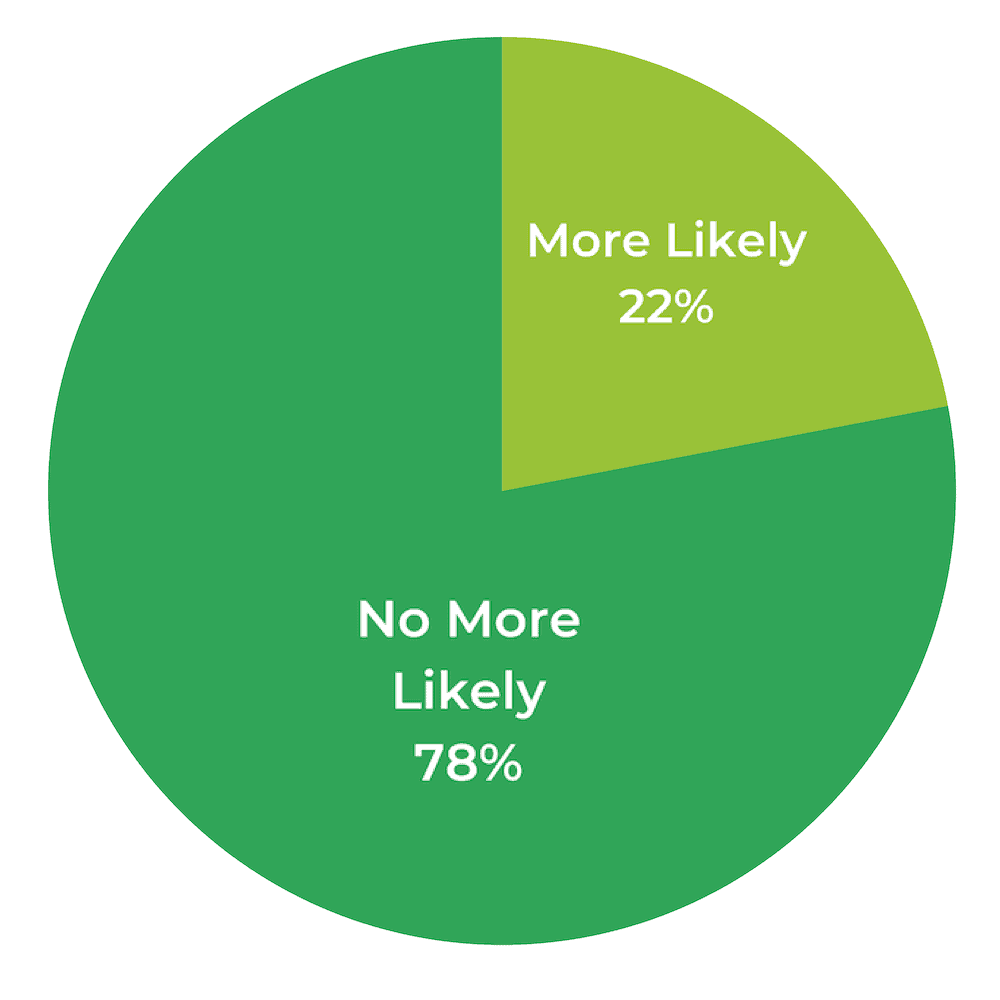
Our results show that price does not have a notable impact on review submission likelihood. In fact, around eight in ten respondents explicitly stated this to be the case.
However, the sweet spot for actual review generation by price point is – according to our results – between $6 and $50. Fewer consumers have left product reviews at the higher ranges ($101+) but this can be explained simply by fewer purchases at this level.
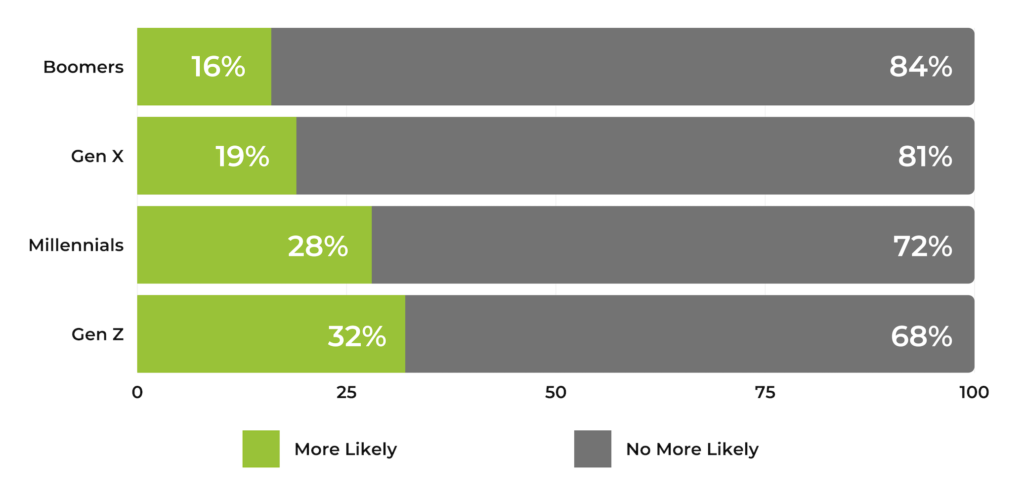
Younger generations are clearly more compelled to provide a rating and review as the price of the product increases. In fact, 32% of Gen Zers say this has an impact (compared to 28% of Millennials, 19% of Gen Xers and 16% of Baby Boomers).
While ratings and reviews are the bread and butter when it comes to UGC, they are also just a piece in a bigger overall puzzle. A best practice UGC strategy will also include many other elements, such as imagery and video.
As we outline above, data from across more than 1,000 brand and retailer websites we work with highlights how website visitors who interact with imagery are 81% more likely to convert than those who don’t.
This is why many brands and retailers incorporate visual media – either collected within the review itself or on social media – throughout their digital experiences (i.e. on their product pages, category pages, homepages, in email marketing and within social media campaigns etc.). It’s proven to drive purchases.
With this being such an impactful and important element, we wanted to see what makes shoppers feel compelled to leave this specific type of content.
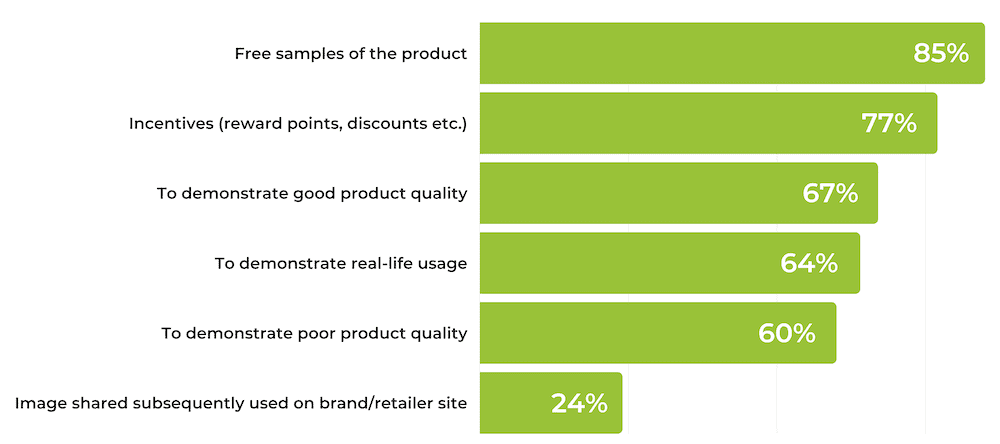
Incentivizing consumers to submit images and videos within their reviews is clearly – according to our survey results – the single most likely factor to drive this outcome.
Again, however, it’s impossible to ignore product quality and demonstration of real-life use cases as a motivator (the main reasons visual media has such an impact on conversions).
There is simply no hiding place for a product perceived to be poor quality when it comes to UGC.
With respect specifically to product quality, this can be managed by appropriately setting expectations up front – primarily through messaging/positioning and pricing. Outlining any features that have potential to be perceived as weaknesses and then adjusting price as necessary goes a long way.
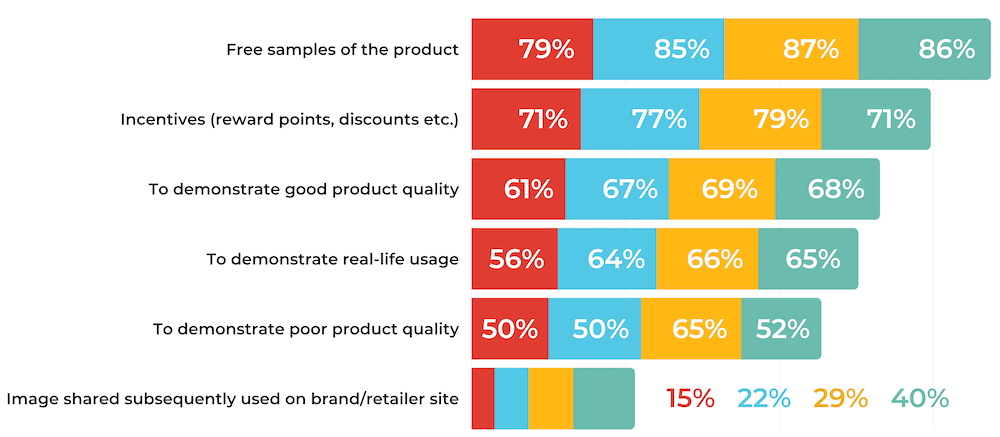
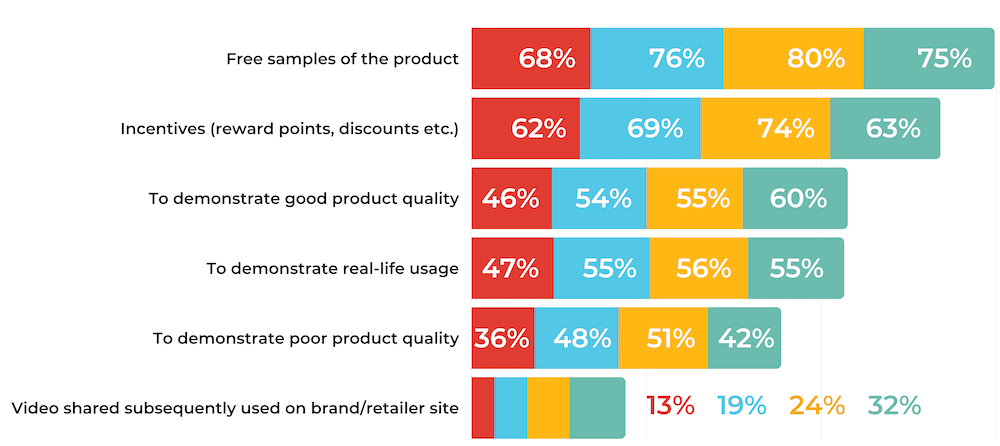
Baby boomers are the least compelled to share user generated imagery and video overall.
The percentage figures for the reasons more senior generations would share this type of content are consistently lower than younger respondents – which highlights a relatively less appetite to submit it.
As mentioned, incentives to submit imagery and video are big motivators regardless of age. But the biggest age-related difference in what compels consumers to provide this content is whether a brand subsequently shares it.
The trend is clear. The younger the consumer, the more this excites them. 32% of Gen Yers say they are motivated to provide product video content if it’s shared by the brand (40% of Gen Yers say the same for imagery), compared to 13% of Baby Boomers (15% say the same for imagery).
This is perhaps unsurprising given the popularity of visual social-media focused platforms like Instagram, TikTok and so on among this demographic.
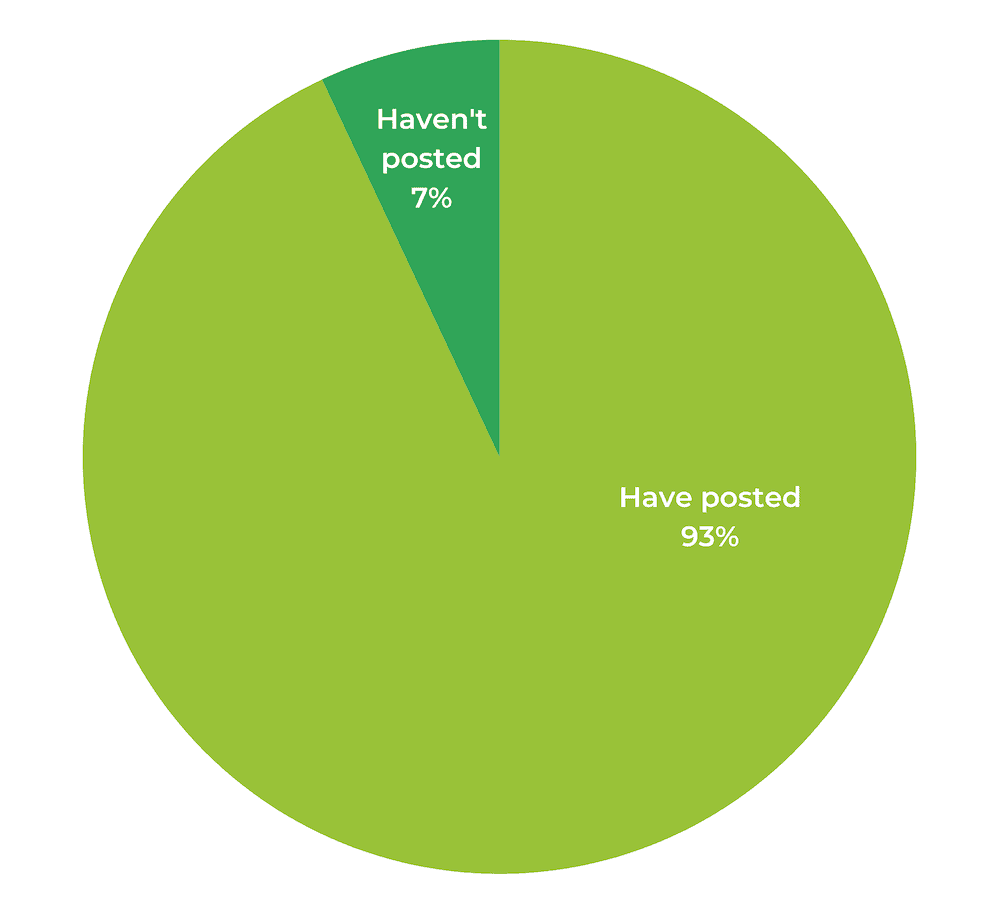
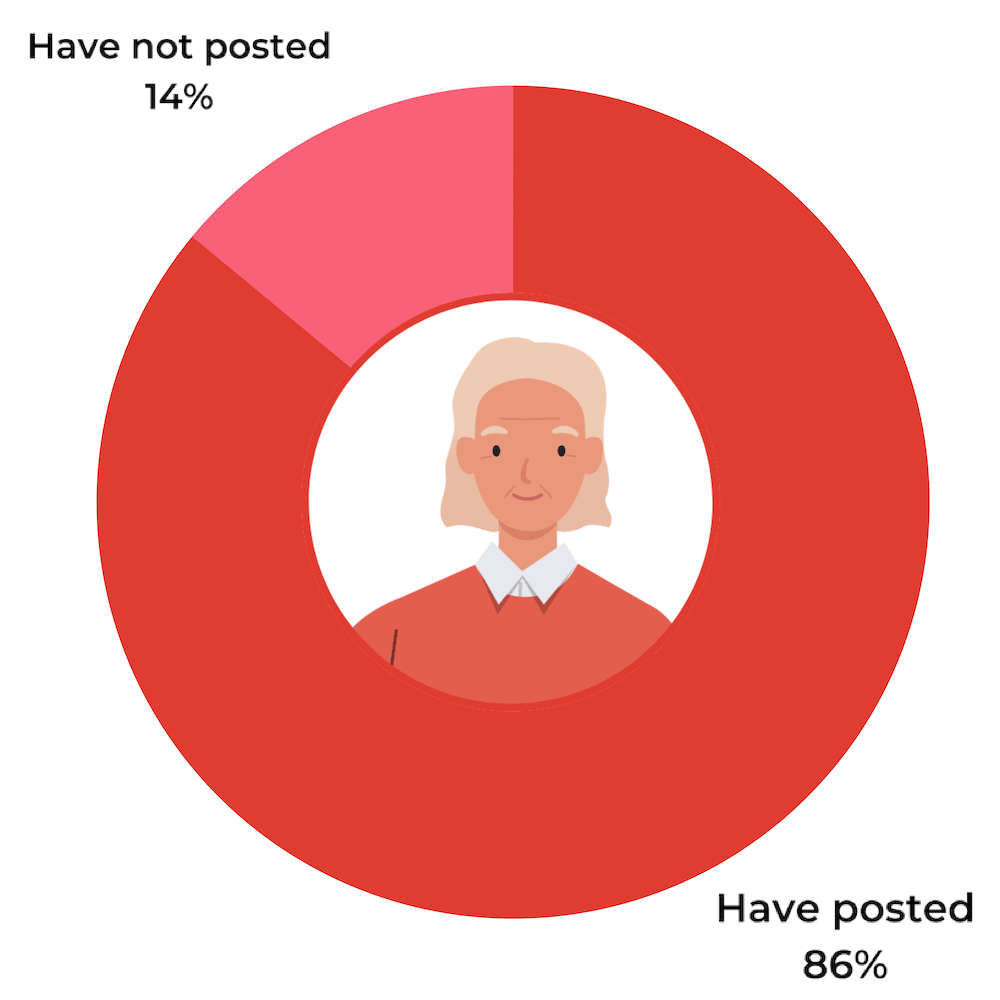
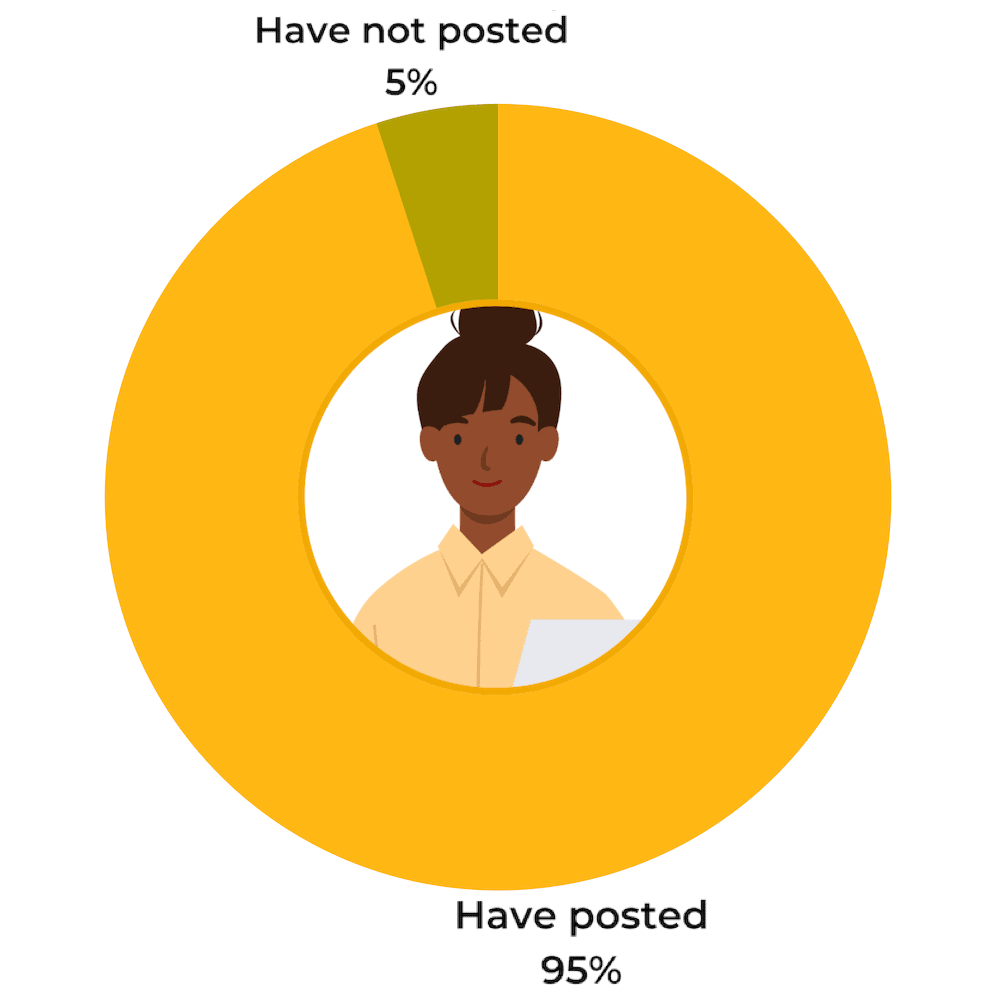
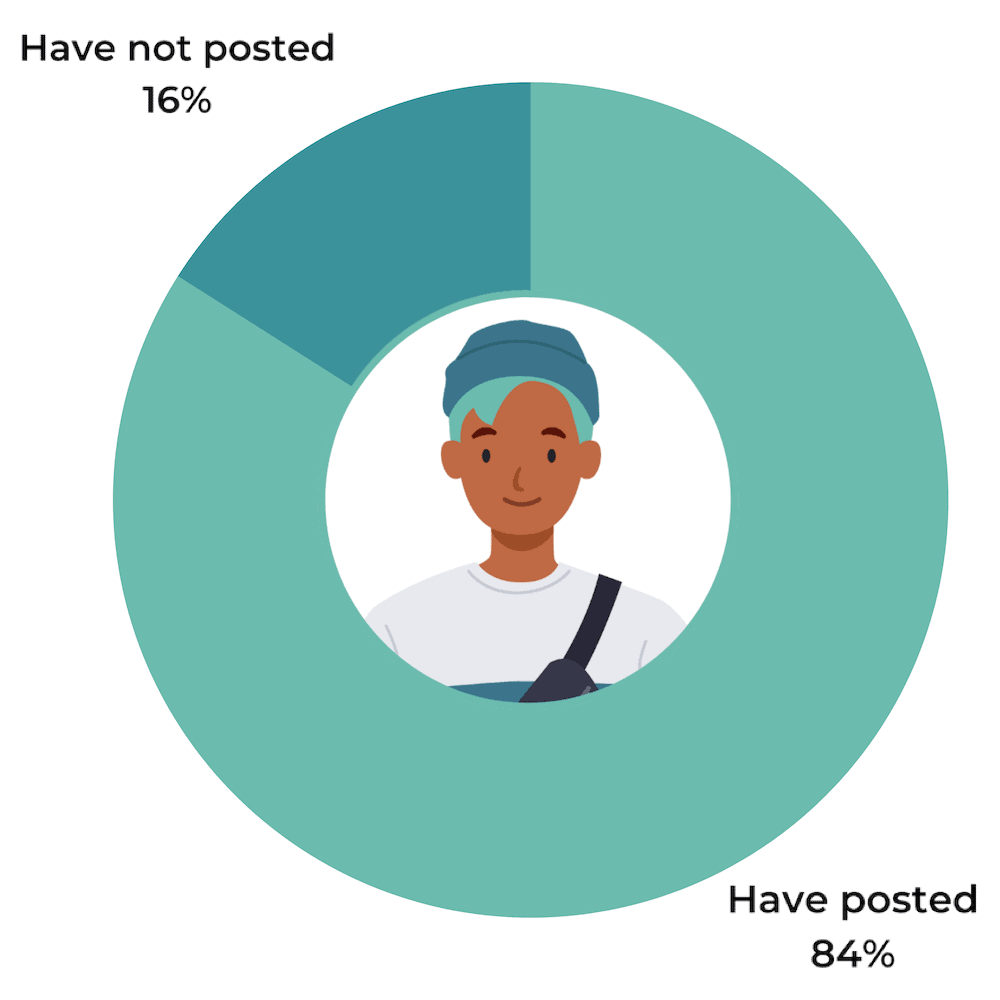
Nearly all the consumers we surveyed have posted about product experiences on social media.
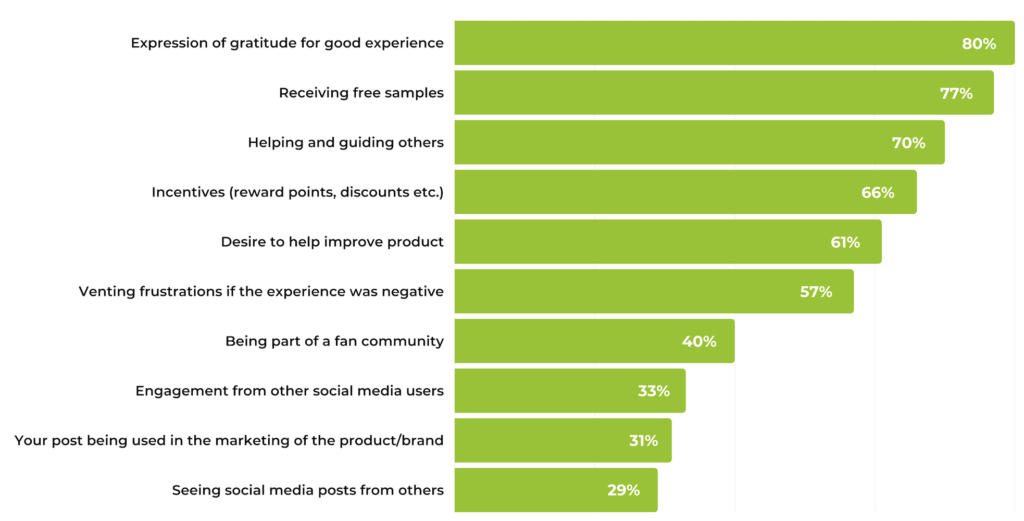
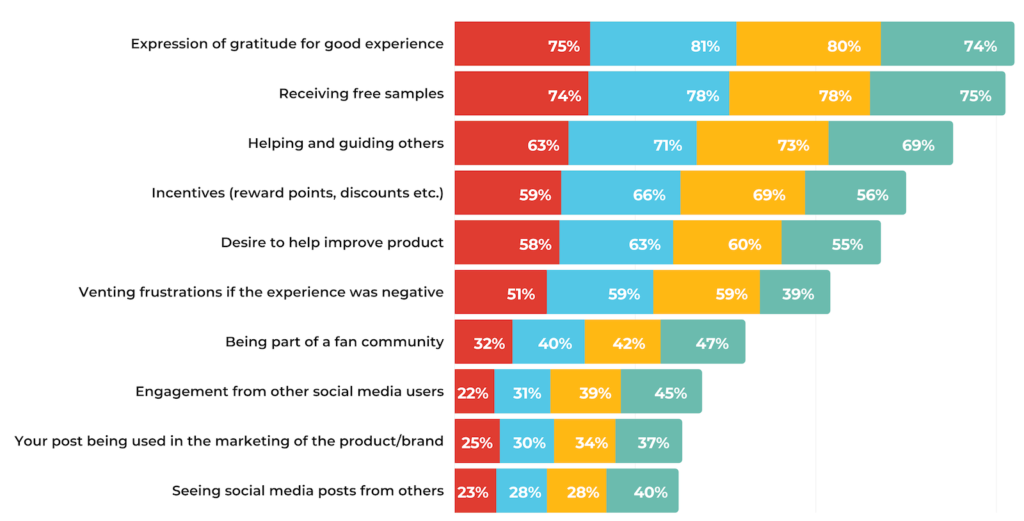
However, why they are motivated to do so is slightly different to the reasons they provide imagery and videos within review content – with product and brand experience typically being the primary factor. This is demonstrated with 80% saying they do so to express gratitude (for a good experience) and 70% to help and guide others.
Similar to the trends identified directly above, the engagement element of social media really inspires younger generations to share content there about your brand.
Customer questions and answers on product pages are a tactic used by many brands and retailers to address consumer concerns. Essentially, both the questions and answers can be customer or brand-submitted but their purpose is to get right to the heart of known barriers to purchase.
And this content is really effective: as we highlight above, consumers who interact with Q&A content are 153% more likely to convert than those who don’t. This makes it the single most impactful type of UGC.
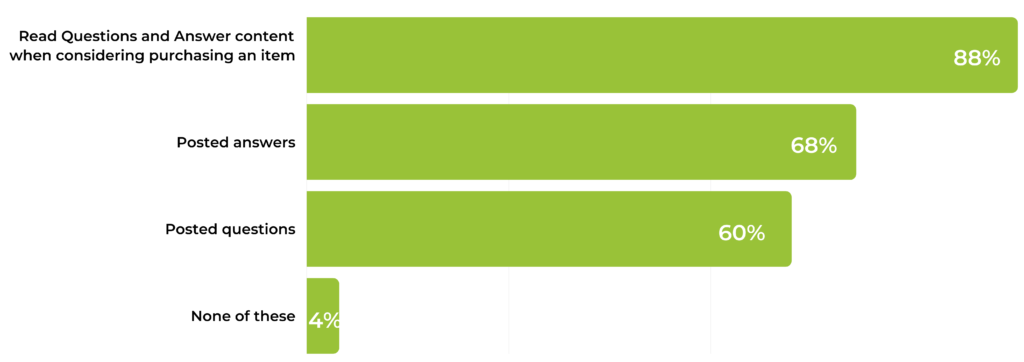
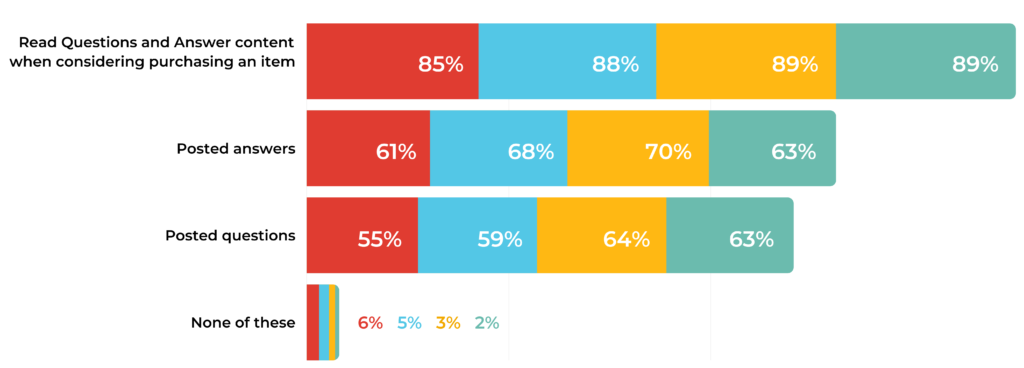
Our survey results reiterate the importance of Q&A content. Almost nine in ten consumers have read Q&A on product pages as they consider a purchase decision. Fewer have posted this content, but a healthy volume of shoppers claim to have done so.
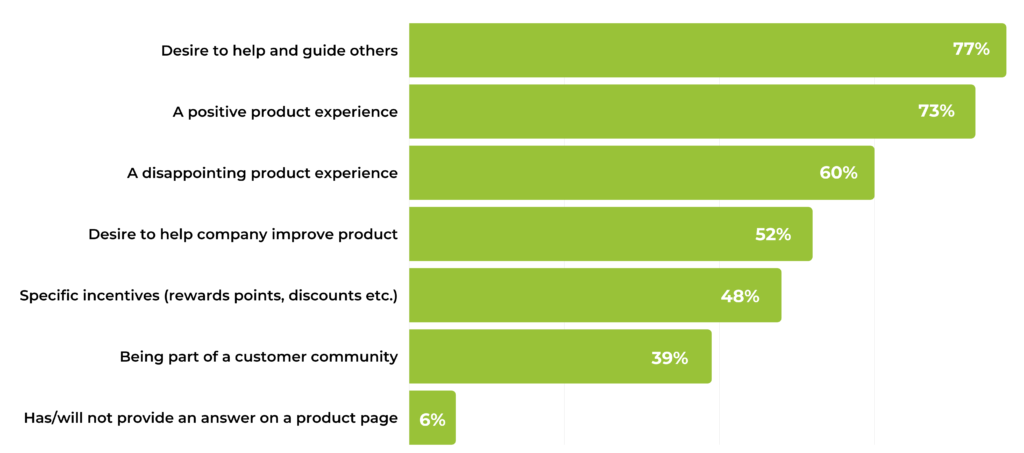
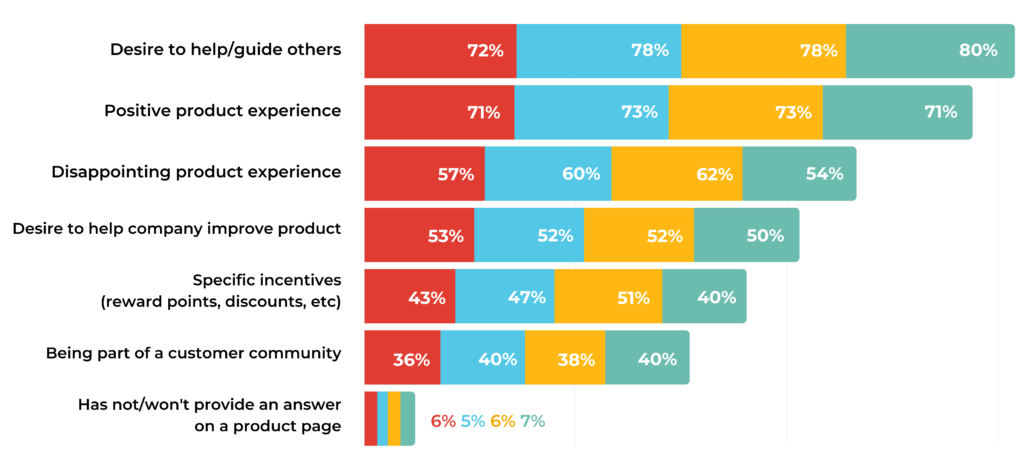
As with visual media, the main motivation for submitting either questions or answers is a desire to guide others in the event of either a positive or negative product experience. However, the fact that more than half do so to improve the product highlights strong personal brand attachment and investment.
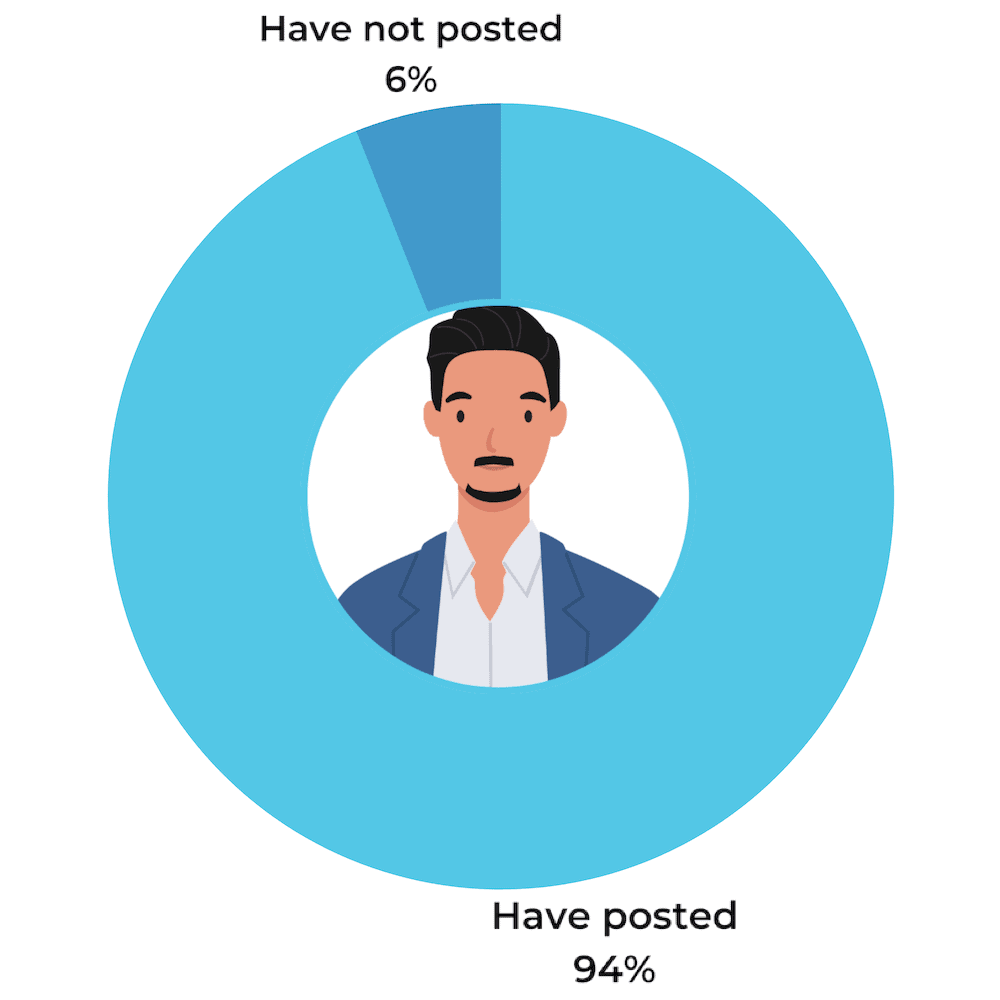
Critically, consumers are very open to providing Q&A content. Only 6% are not (which – to state the obvious – means 94% are). So there is a definite opportunity to tap into this appetite for brands and retailers.
Similar themes evident throughout the rest of the survey are clear in responses to the questions we asked around Q&A content. Again, younger generations are motivated mostly by a desire to help and guide others in their purchase decisions.
There’s no getting away from it: consumers are most likely to provide review content if they are incentivized to do so. Offering a free sample of the product is the single most effective way to generate a ton of fresh UGC.
Ultimately, the UGC you generate is a reflection of the quality of your products. However, you should do everything you can to manage expectations up front by educating shoppers with accurate product descriptions and imagery.
Not only does the overall experience your product delivers need to be great, it needs to be great from the very first use. The overwhelming majority of consumers leave a review within the first week of receiving the item, often after a single use.
Q&A and user-generated video and imagery is extremely impactful in providing buyer confidence and driving sales online. And your ability to generate this content is dictated more by a great experience than ratings and reviews (which, as we explain, relies more on incentives). A best-in-class UGC program will incorporate all these elements.
Sure, the primary reason you have a UGC program is to create buyer confidence at the moment of truth. But it also includes a goldmine of customer feedback that can significantly help improve your product experience, customer experience and overall marketing and messaging efforts. Make sure you make use of this insight to drive your business forward.
Different generations clearly have slightly different preferences and motivations to provide UGC. If you have products focused on different age groups or are able to segment your database by generation, consider adapting the nature of your collection outreach and requests.
This is the post-Holiday special edition of our monthly snapshot, an analysis of consumer activity on the weekend from Thanksgiving thru Cyber Monday across more than 1.5MM online product pages from more than 1,200 retail/brand sites. This is old news but worth reiterating due to knock-on Holiday impact: the effect of Covid on ecommerce activity has been immense.
To recap, a huge initial surge led to an overall 3x increase in online purchase volumes between February (pre-pandemic) to May. However, the subsequent four months through to October led to a steady decline and then stabilization, with purchase volumes consistently between 40% and 70% higher than they were pre-pandemic (we actually re-aligned our reports to three month periods due to this stabilization).
We then saw a slight uptick in preparation for the Holidays (remember: shopping was expected to start early this year).
Then onto the Holidays. No one really knew what to expect given the unique conditions created by the pandemic.
Last month, we commented how our data at that point showed a bigger increase in 2020 than 2019 (of course coming off a bigger baseline in 2020). However, this proved premature.
Read on to find out more.
Prior to the Holidays, consumer behavior had clearly become more predictable, with purchase volumes consistently around 1.4x to 1.7x where they were at the start of the pandemic (this was after a giant surge in April, May and June). So remember that is the baseline we’re dealing with in the chart below.
But the Holidays brought us into uncharted territory. Typically, we can predict online shopping volumes will increase, but this Holiday period is completely unprecedented for obvious reasons.
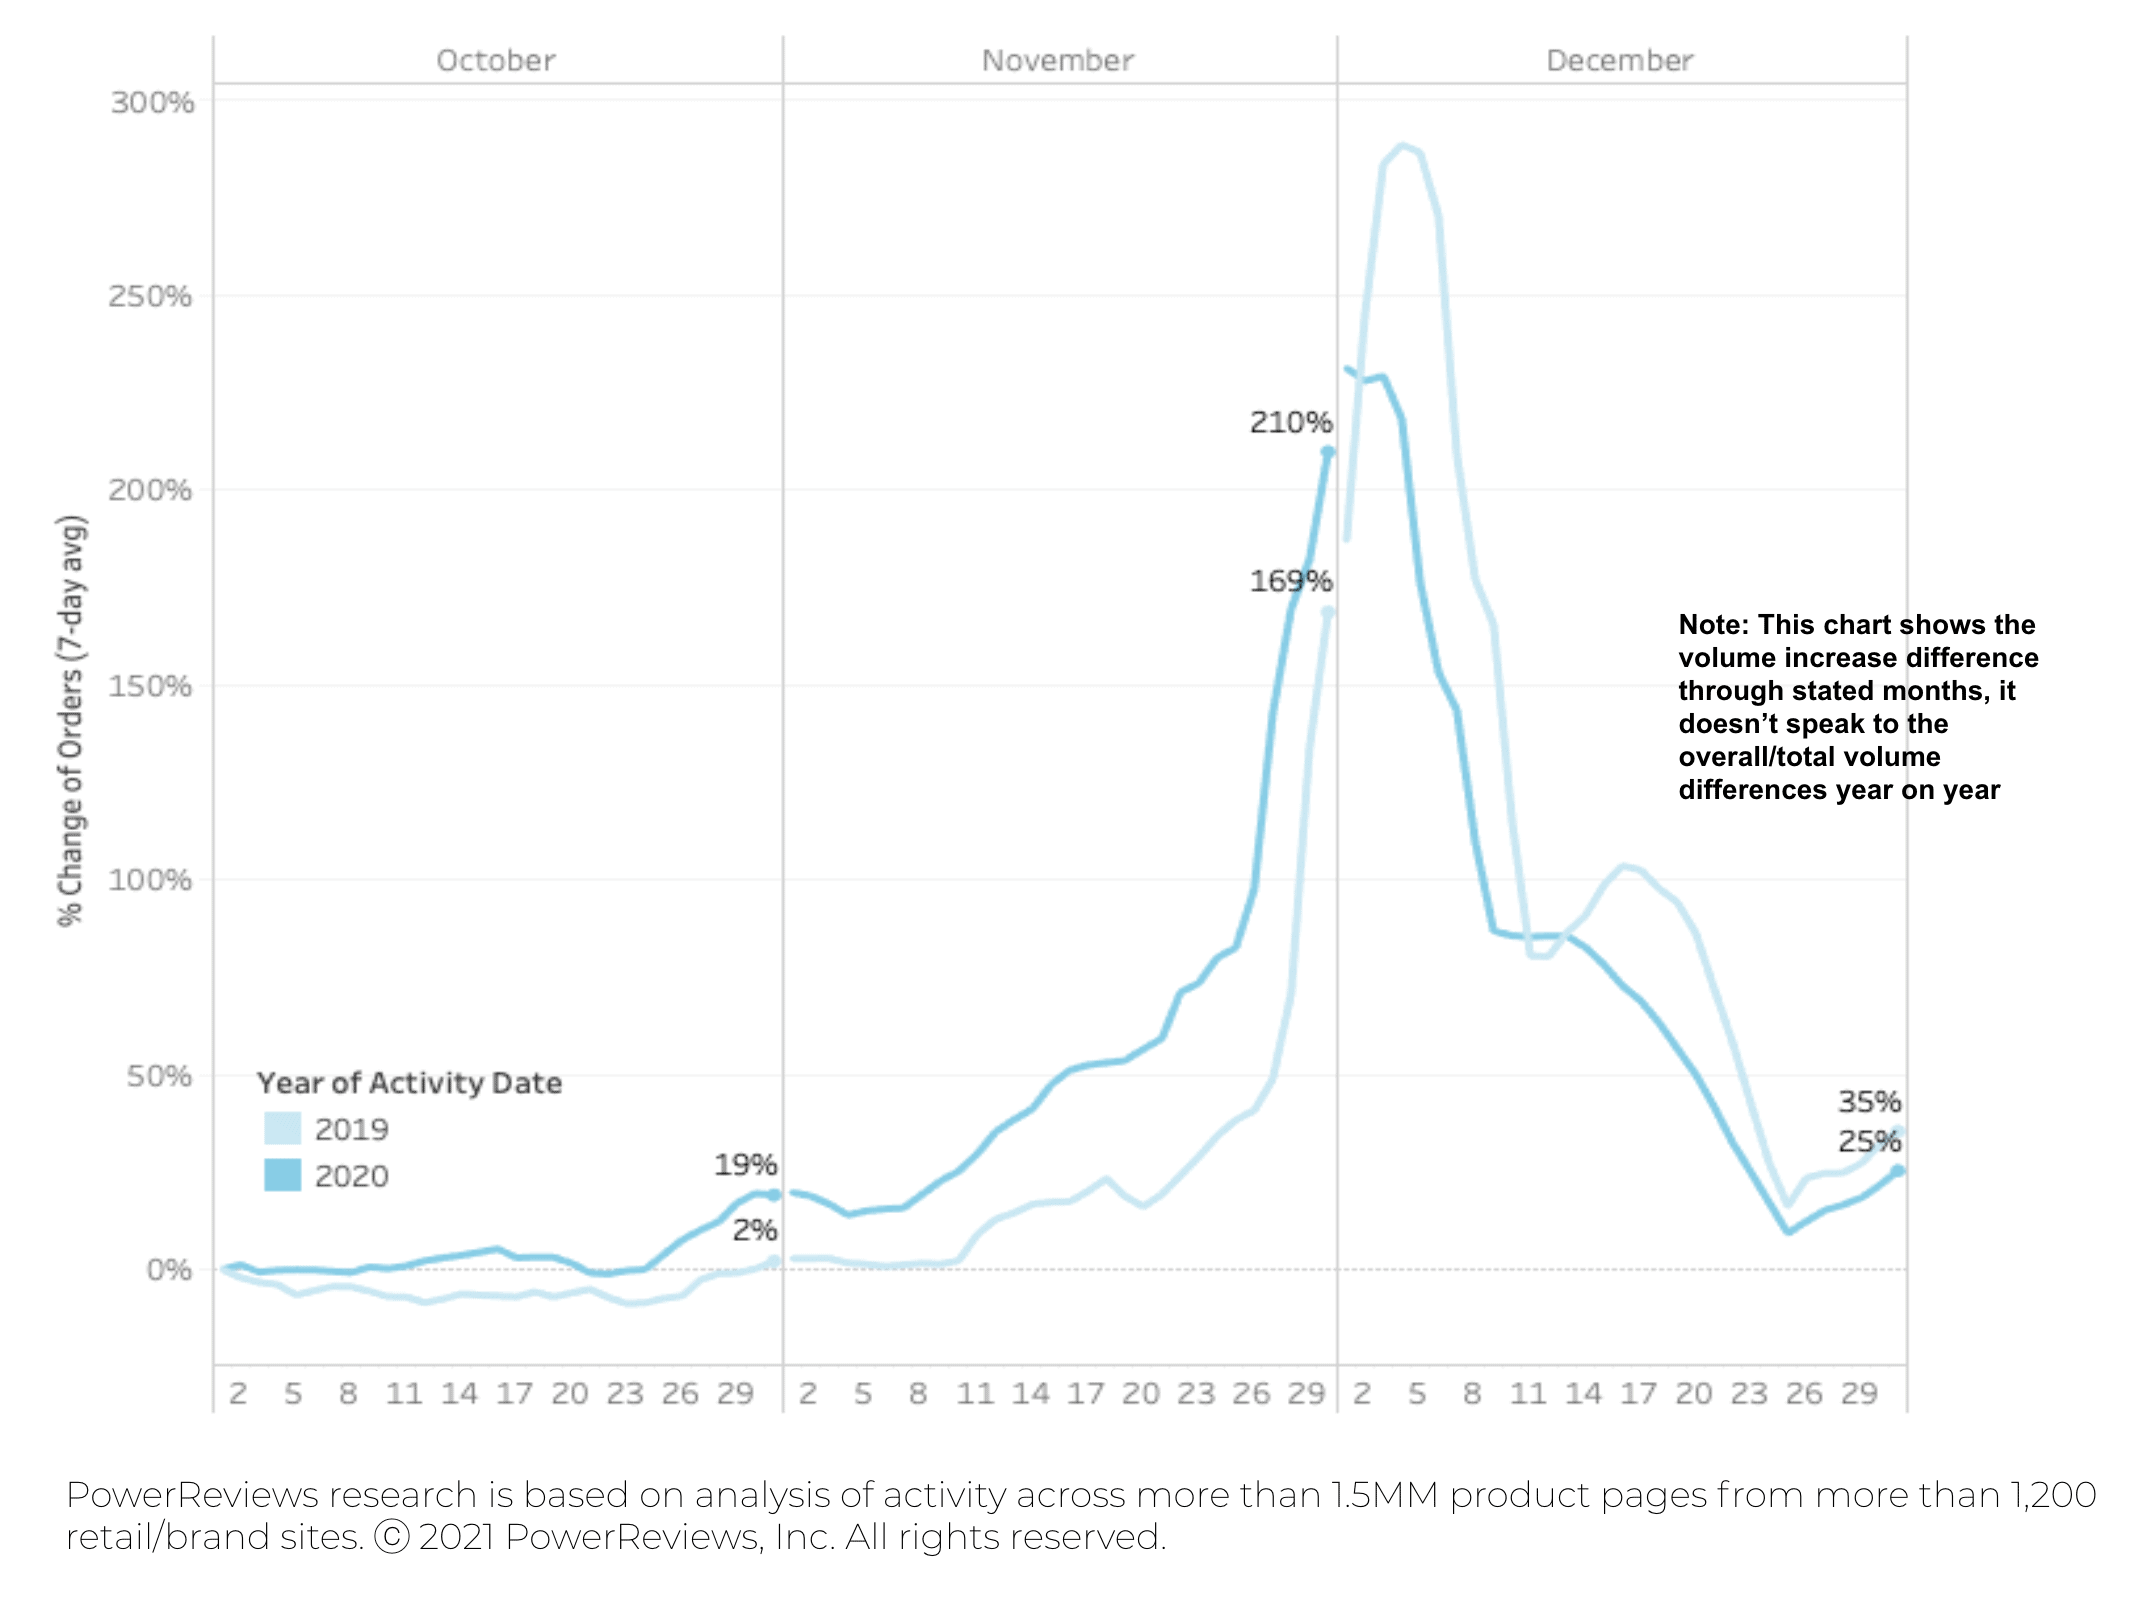
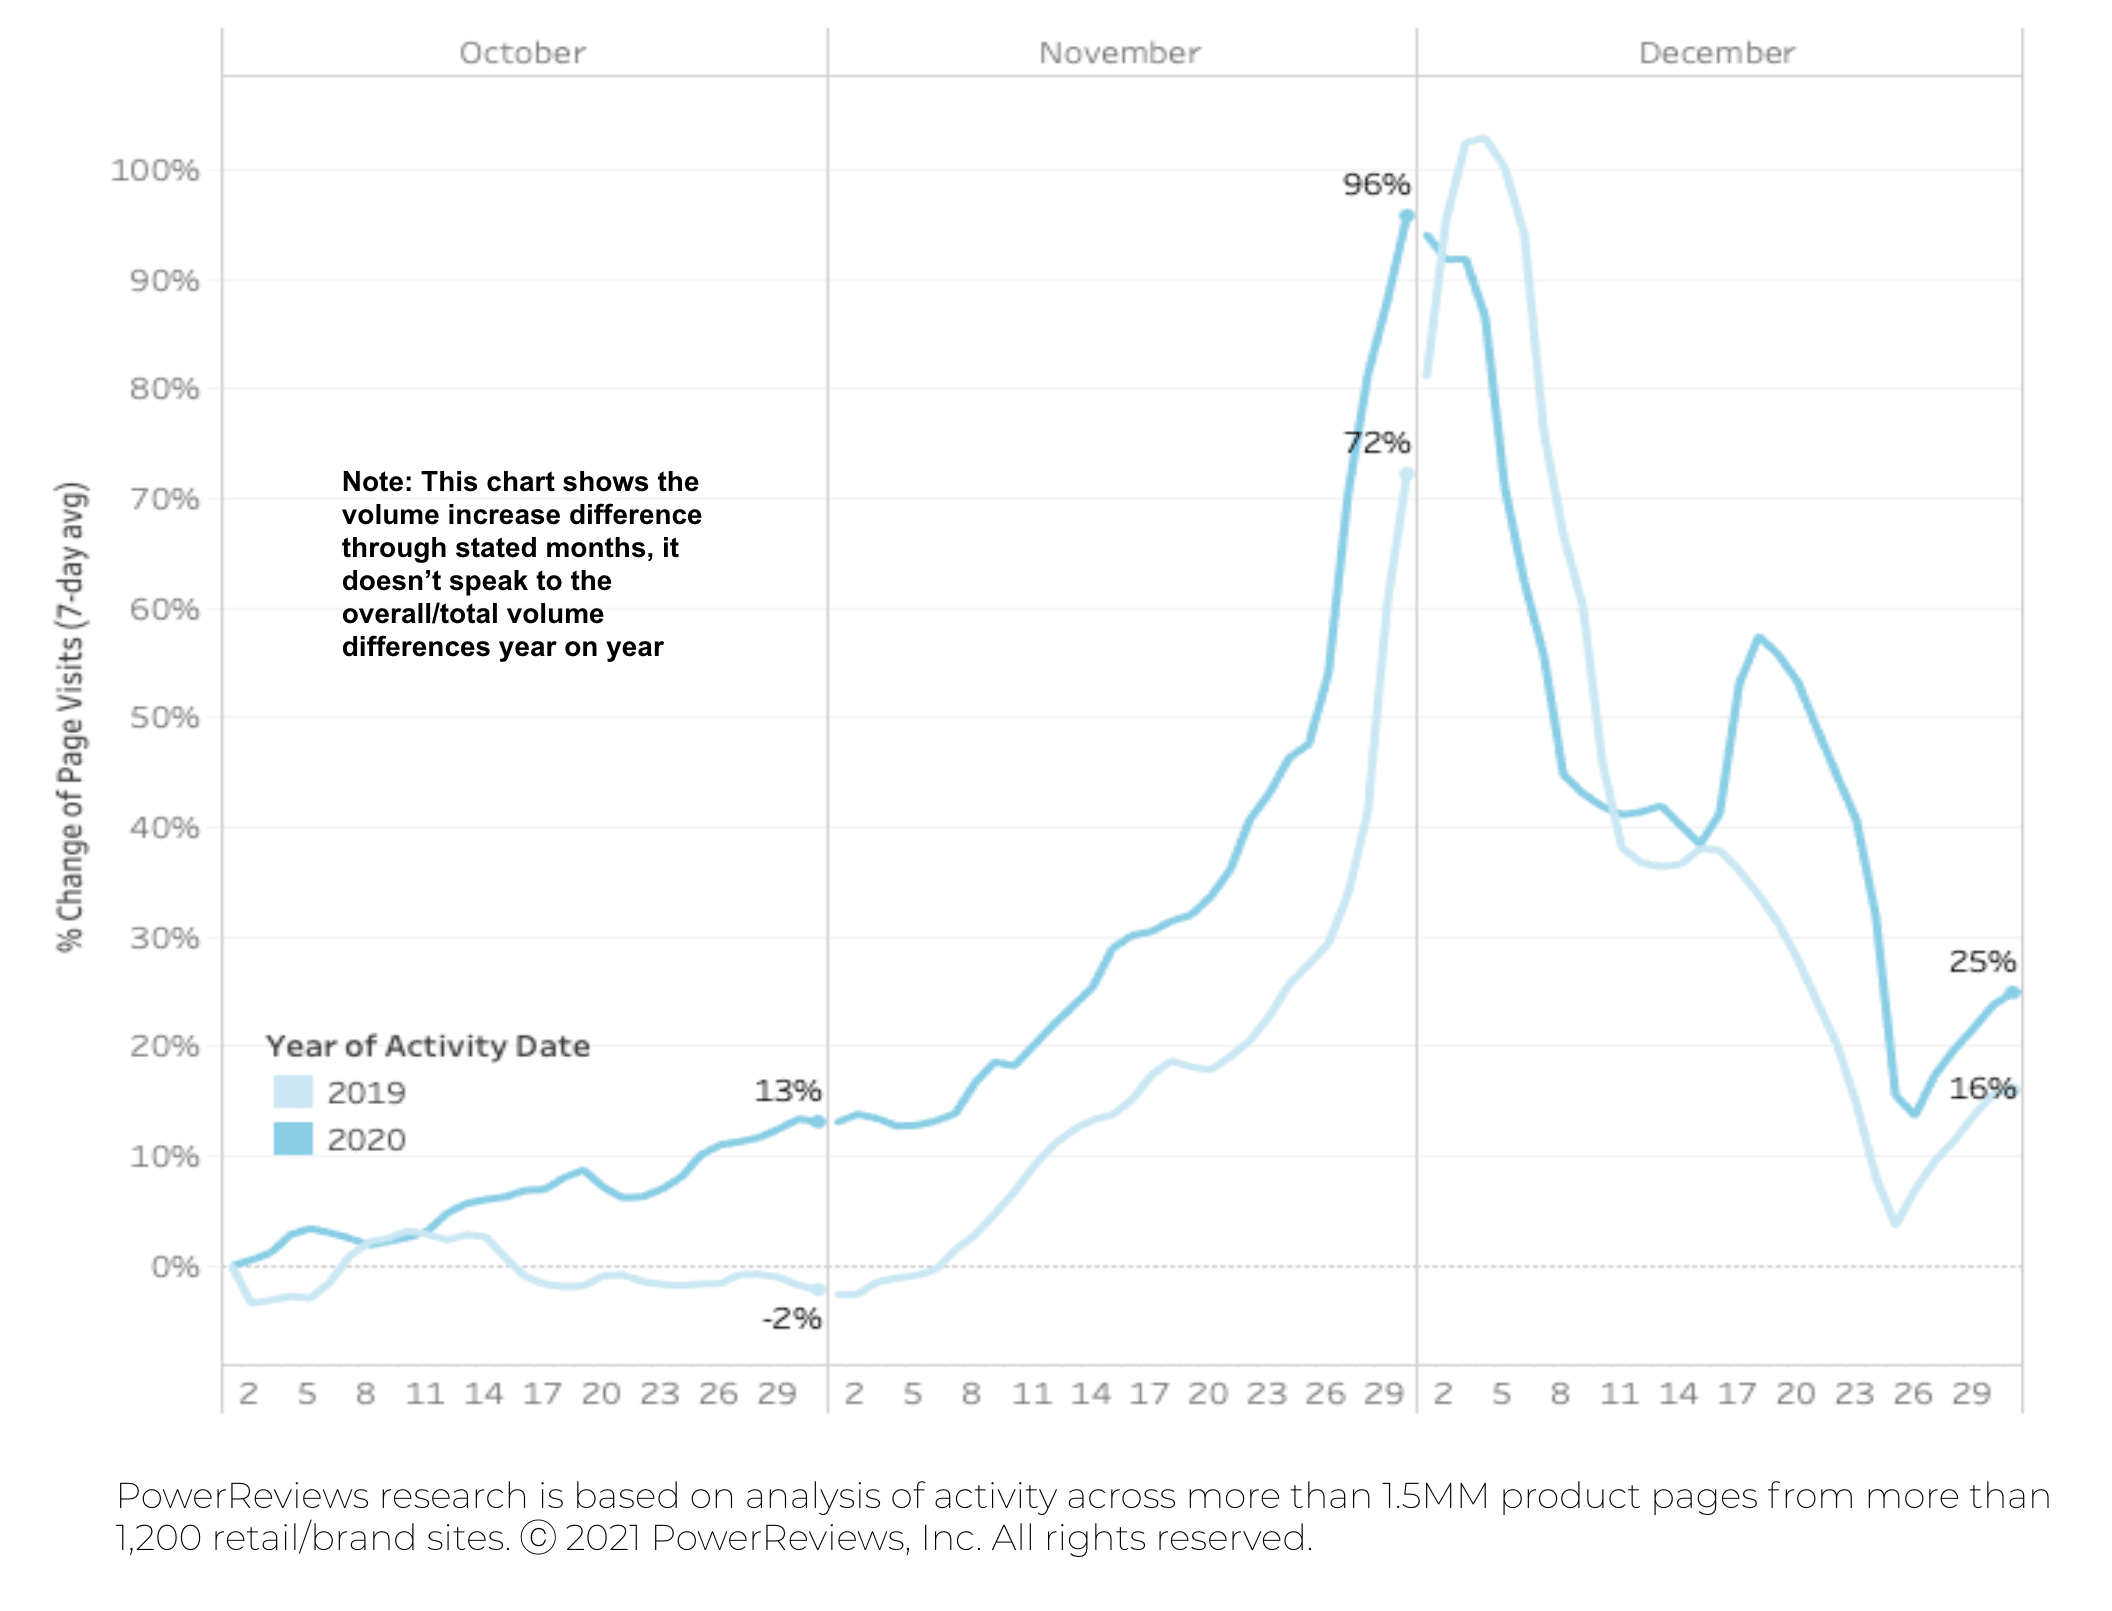
Below we compare the increase in online purchase and traffic volumes for the Cyber 5 weekend over the past two years.
Last month, we commented how surges in purchase volumes were more pronounced in 2020 than 2019. This proved to be a little premature. The relative increase (from pre-Holidays to the Holidays) was actually higher in 2019 than 2020. But – again – this jump is coming off a baseline of between roughly 1.4x and 1.7x higher in 2020. The post-Holiday drop off proved consistent year-on-year.
Relative to the 1st of October, there was a bigger spike in the first week of December in 2019 vs 2020. Purchase volumes were consistently higher year-over-year prior to that date, indicating that shopping was happening earlier and consistently higher during holiday 2020. The spike in last minute December shoppers seen in 2019 wasn’t as pronounced in 2020.
After reporting a significant leap in review submission levels from April to May, we subsequently highlighted a consistent drop through to September to the point where levels were on par with what we saw pre-pandemic.
In last month’s snapshot, we again reported little change but noted that this would be one to watch post Cyber 5 weekend. Our theory being that a leap in overall purchase volumes in this period would be reflected in review submission volumes in the days and week afterwards.
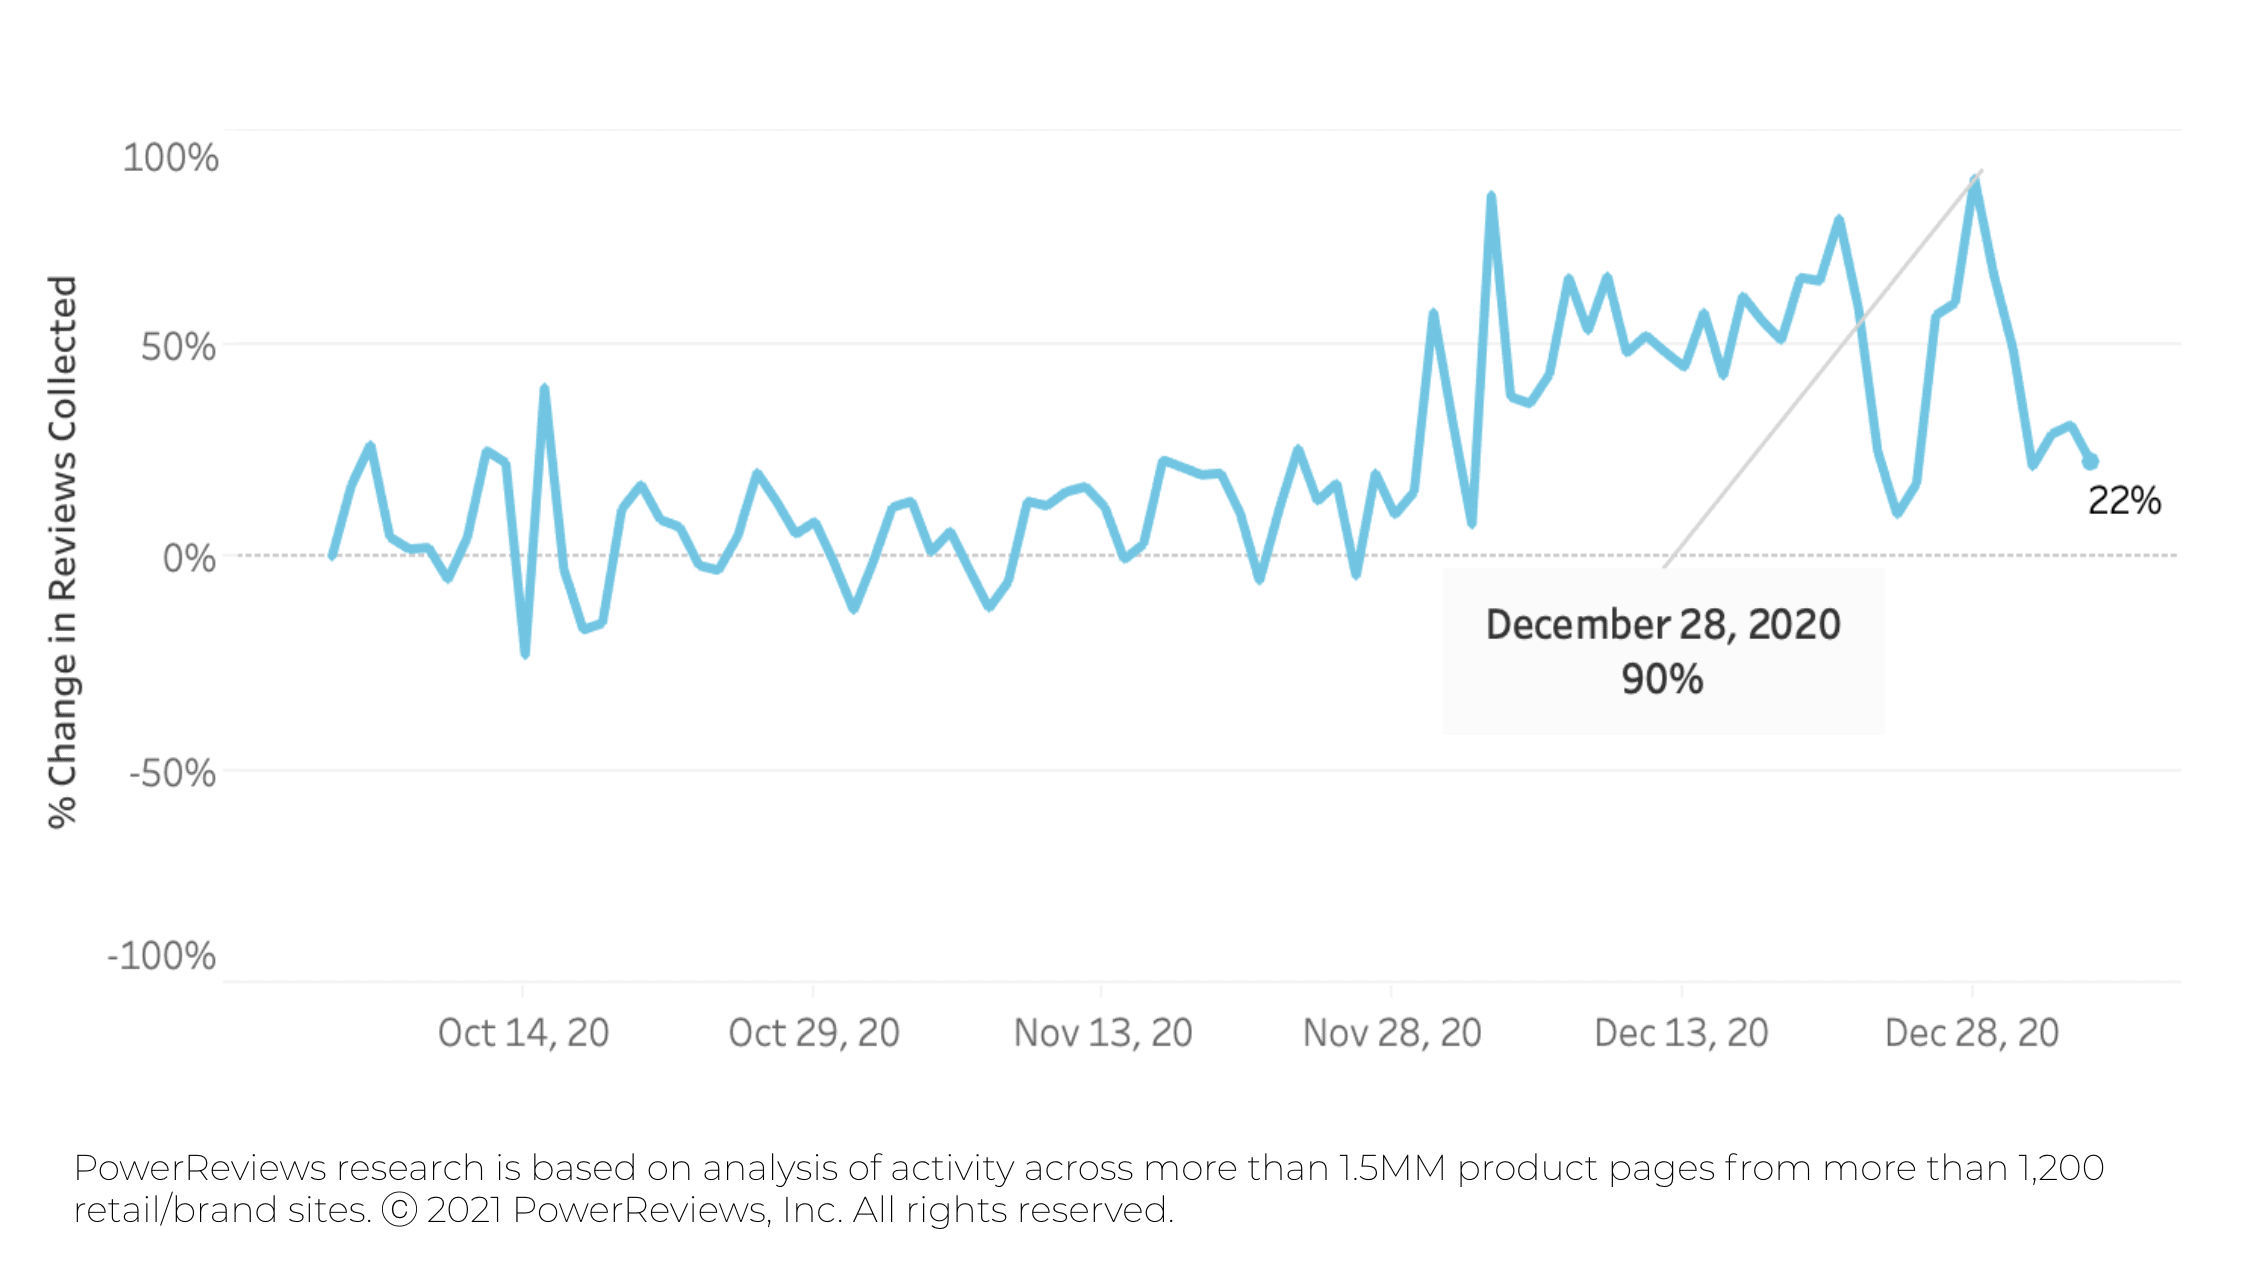
This conclusively proved out, with a giant surge evident at the end of November. This trend – broadly speaking – held throughout the entire month of December – and on December 28 actually peaked at a level 90% higher than where it was at the start of October.
Notably but perhaps unsurprisingly, this was the biggest and most significant increase in review submission volumes we saw all year.
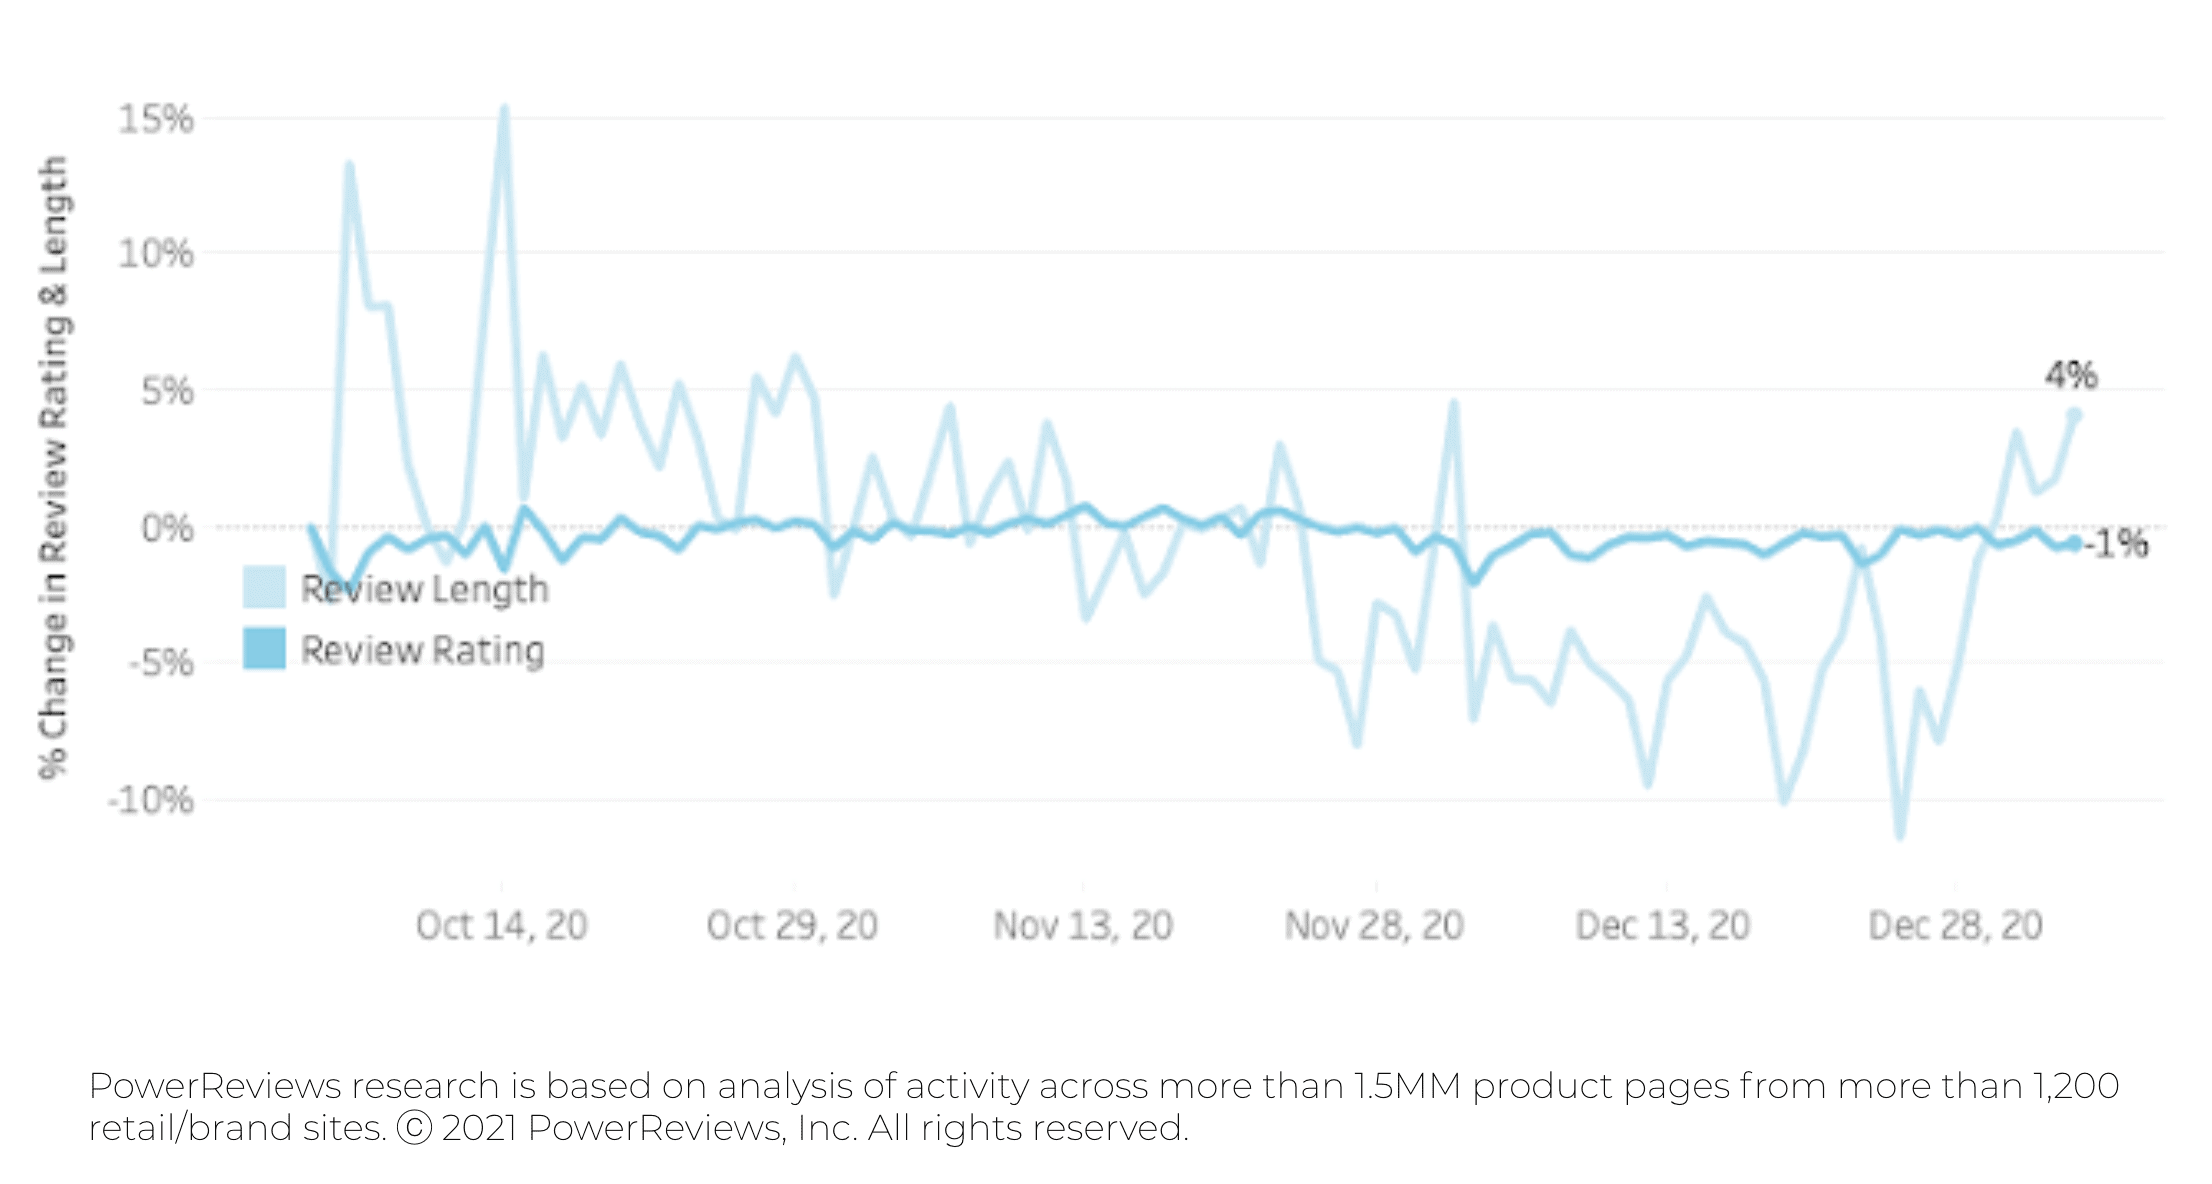
Despite the increase in volumes, trends evident in review length and sentiment were broadly consistent with everything we saw throughout 2020. However, there was a very slight dip in length – peaking at -10% – during this period.
Last month, we did a deep dive into the impact of review content on the buyer journey – paying particularly close attention to year-on-year comparisons over the Cyber 5 weekend.
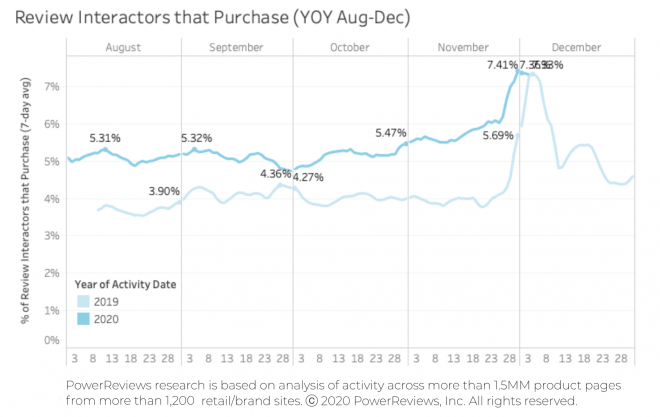
To recap, the charts in this section highlight the percentage of online shoppers who go onto purchase after they’ve interacted with review content (i.e. searched, filtered, clicked to extend the review from preview to view entire content etc.)
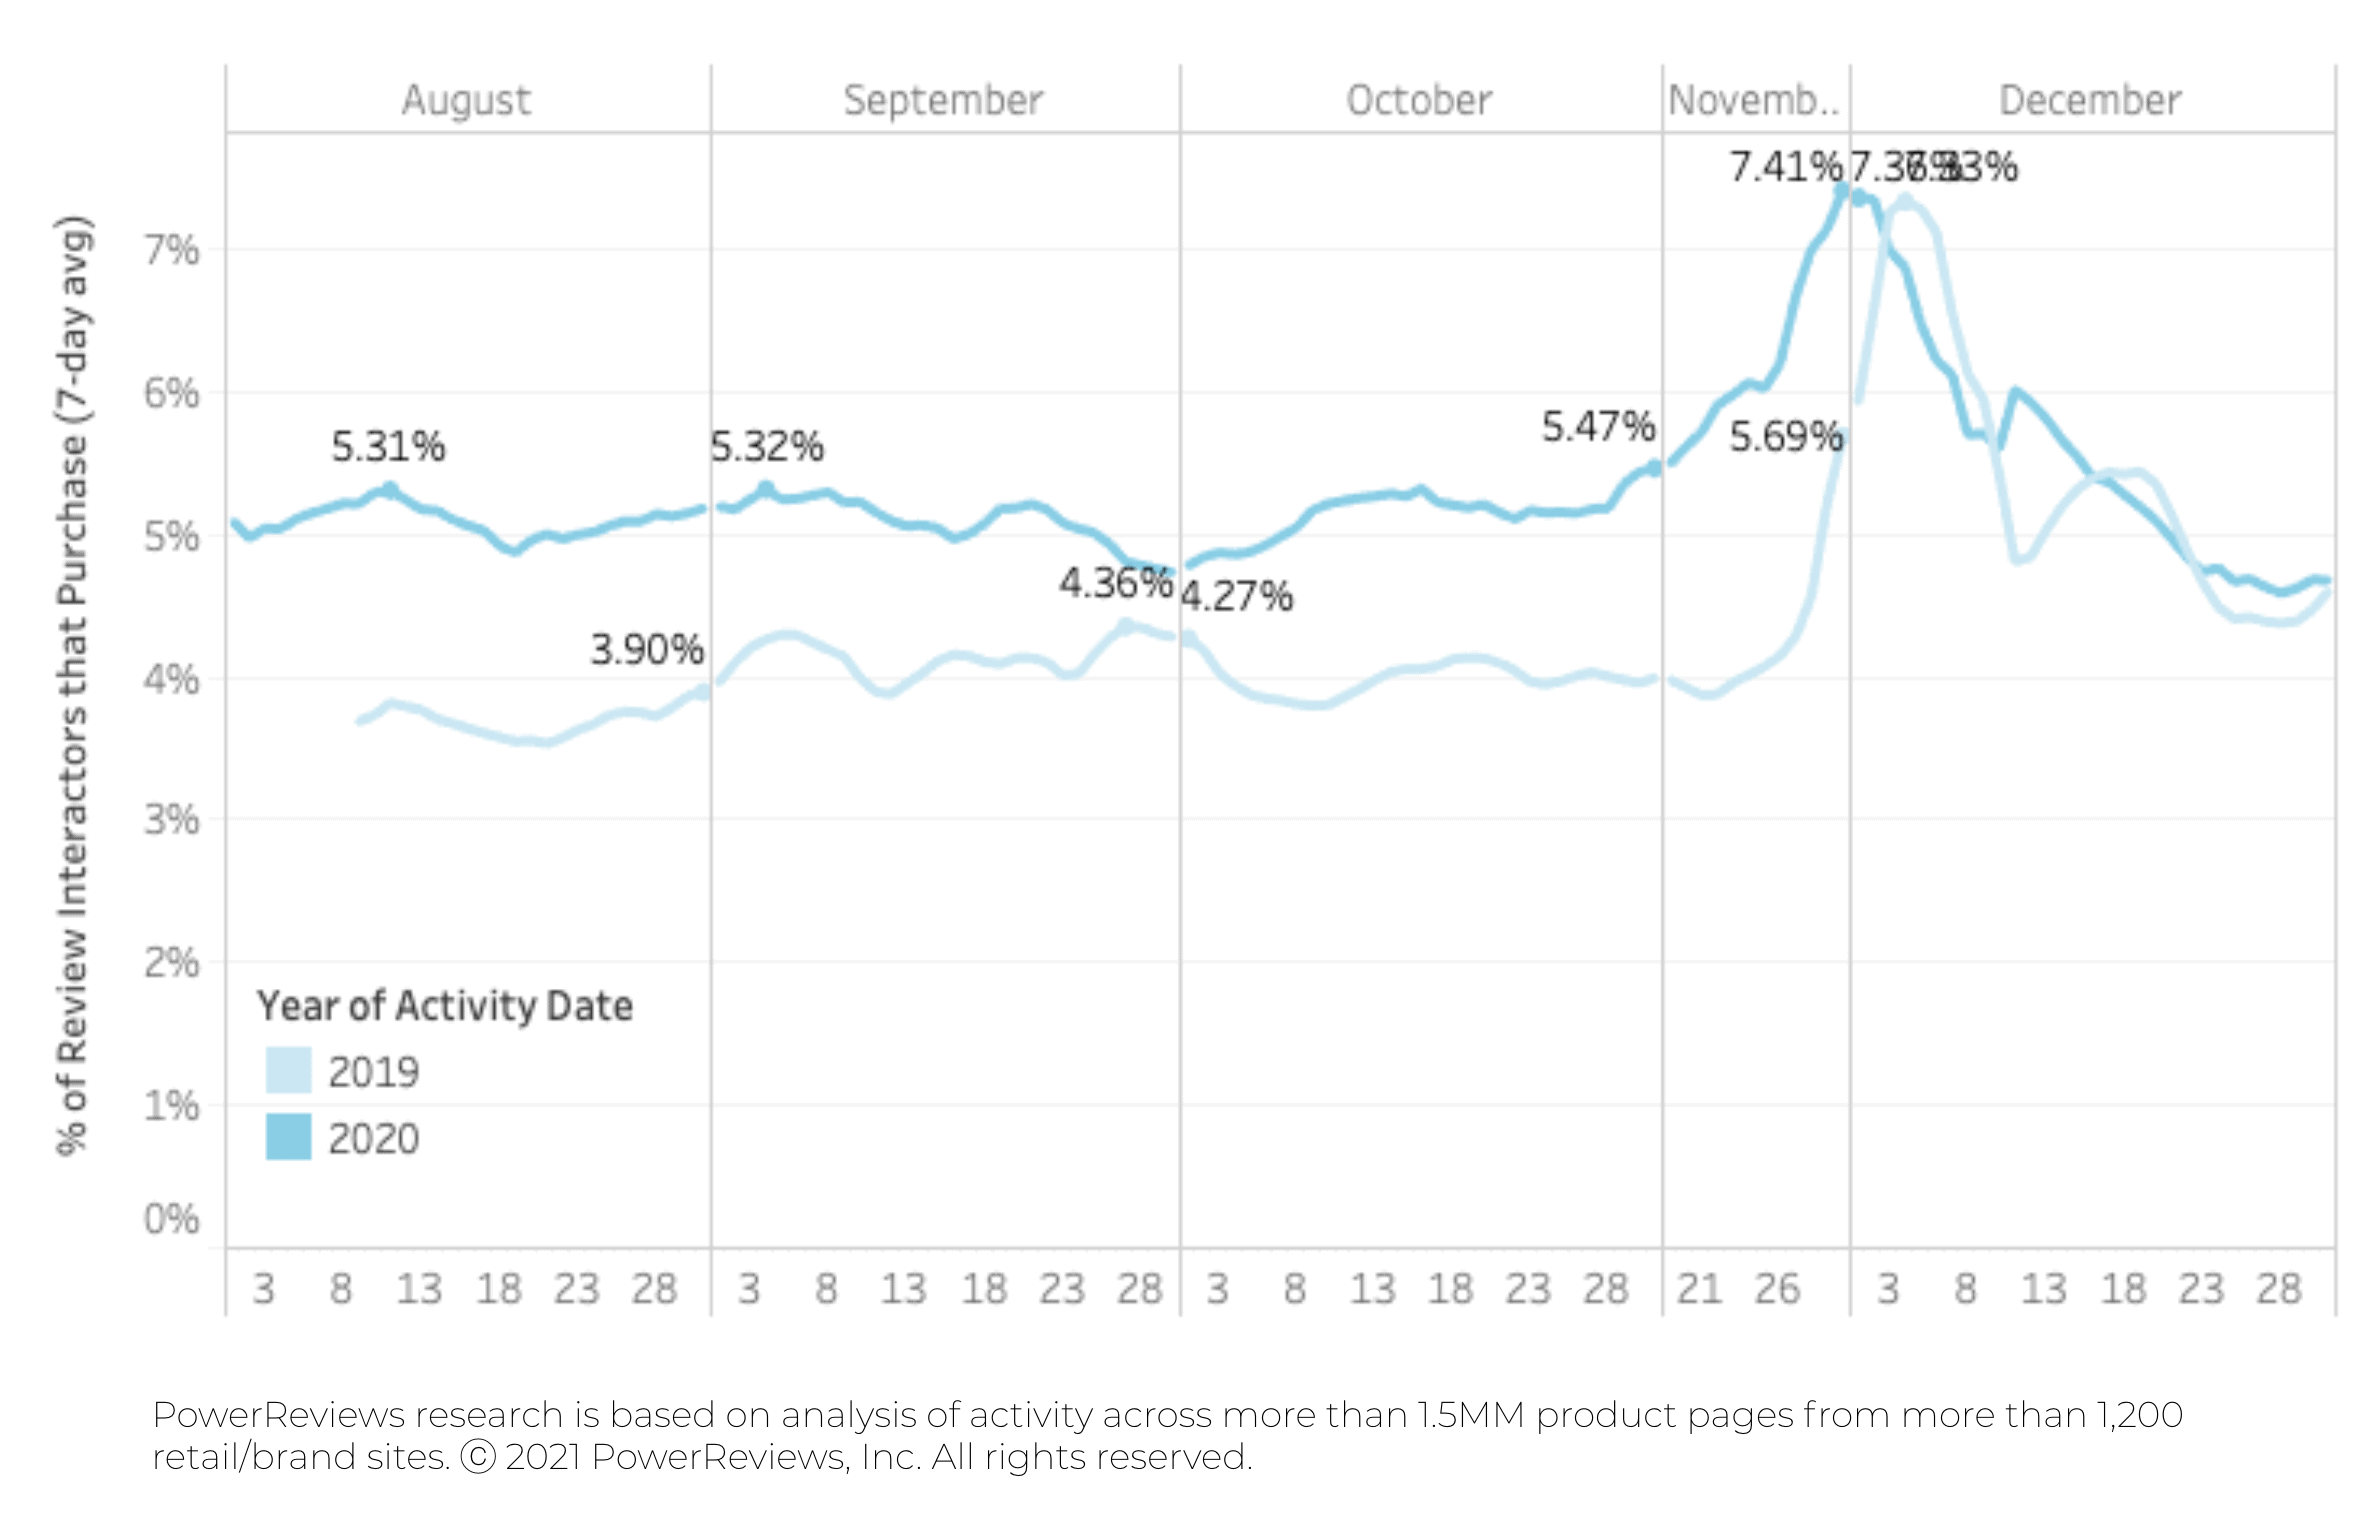
We found that review interactors were consistently converting at around a 25% higher rate than they were a year previously (the conversion figure is typically around 5.25% in the three months prior to Black Friday, compared to around 4.25% in the same period for in 2019).
For context, this figure had come down from its COVID peak (as also demonstrated below) of 6.85% in April. This is in line with when we saw the highest ecommerce purchase volumes (when they hit a peak of 210% above where they were pre-COVID at this time).
However, the influence of reviews surged to their highest rate of the year during the Cyber 5, with 7.41% of review interactors going on to purchase (an increase of 30%). As you can see from the charts, this is entirely in line with typical trends. Reviews always become more impactful on the buyer journey during the Holidays.
But – interestingly and despite their generally increased importance during COVID – they topped out at an almost identical level to for the same period in 2019. Given the clear long-term trends evident in the data indicates a clear trend both this and last year, we would expect stabilization at the 5.25% level we’ve consistently seen throughout 2020 as we move out of the Holiday period.
Fast forward to the end of December and review interaction is back at comparable levels year-on-year. Because this runs counter to what we saw throughout the entirety of 2020, we would hesitate to call this a long-term trend. The bottom line is: reviews have become a more influential factor in the buyer journey than before the pandemic.
Having pulled this data at the end of December, these results provided a clear picture of the entire Holiday period.
Ecommerce purchase volumes and traffic have been consistently trending at levels between 1.4x and 1.7x above where they were at the start of the pandemic. What this ultimately meant: a less pronounced Holiday-generated increase in 2020 than 2019. Remember this does not speak to the overall difference in volumes, just how much they changed during the Holidays.
Notably, review submission volumes surged on the back of Holiday purchases. For brands and retailers, this post-Holiday period represents an unrivaled opportunity to generate user-generated content.
This is the Cyber 5 special edition of our monthly snapshot, an analysis of consumer activity on the weekend from Thanksgiving thru Cyber Monday across more than 1.5MM online product pages from more than 1,200 retail/brand sites.
This is old news but worth reiterating due to knock-on Holiday impact: the effect of Covid on ecommerce activity has been immense.
To recap, a huge initial surge led to an overall 3x increase in online purchase volumes between February (pre-pandemic) to May. However, the subsequent four months through to October led to a steady decline and then stabilization, with purchase volumes consistently between 40% and 70% higher than they were pre-pandemic (we actually re-aligned our reports to three month periods due to this stabilization).
We then saw a slight uptick in preparation for the Holidays (remember: shopping was expected to start early this year).
We expected shopping volumes to be much higher over the Black Friday – Cyber Monday weekend. But due to the unprecedented nature of Covid, we had no idea how much higher.
So let’s see what our data said about the recent Cyber 5 weekend.
Prior to the Holidays, consumer behavior has clearly become more predictable, with purchase volumes consistently at around 1.4x to 1.7x where they were at the start of the pandemic (this was after a giant surge in April, May and June). So remember that is the baseline we’re dealing with in the chart below.
Why? At the risk of using a very overused Covid phrase, this is most likely because the entire population has settled into a “new normal”. People are no longer buying in the bulk they were because they have confidence in the supply chain and product availability.
But the Holidays brought us into uncharted territory. Typically, we can predict online shopping volumes will increase but this Holiday period is completely unprecedented for obvious reasons.
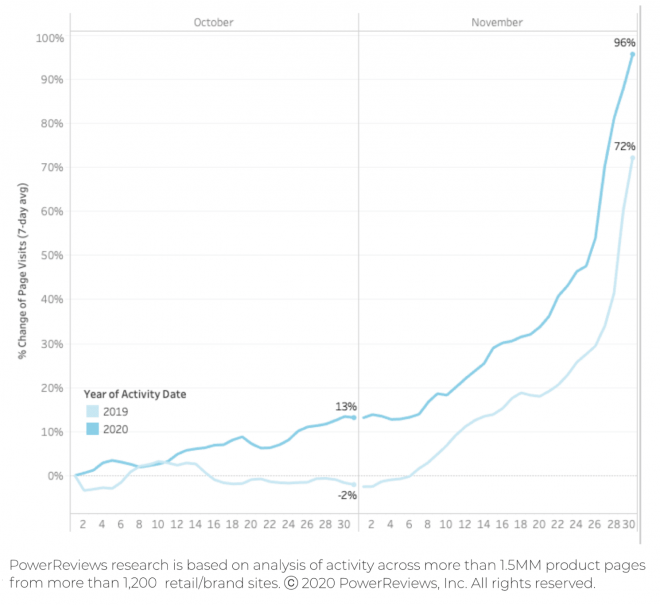
Below we compare the increase in online purchase and traffic volumes for the Cyber 5 weekend (again: bear in mind this jump is coming off a baseline of between roughly 1.4x and 1.7x higher in 2020 than in 2019).
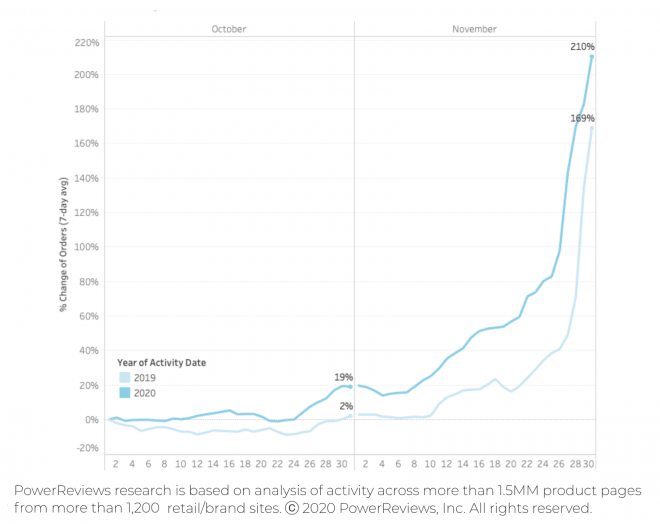
The increase was significantly higher in this period in 2020 in comparison to 2019, with purchase volumes surging 210% this year compared to 169% last. This represented a vivid Covid-driven difference.
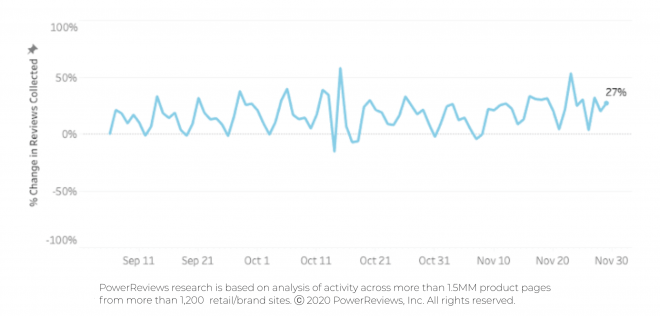
After reporting a giant 2.3x leap in review submission levels from April to May, we subsequently highlighted a consistent drop through to September to the point where levels are now consistent with what we saw pre-pandemic. The Black Friday-Cyber Monday weekend had little impact on review submission volumes or length.
This makes sense: review submission typically lags behind purchase. We would therefore expect these to start rising in mid December.
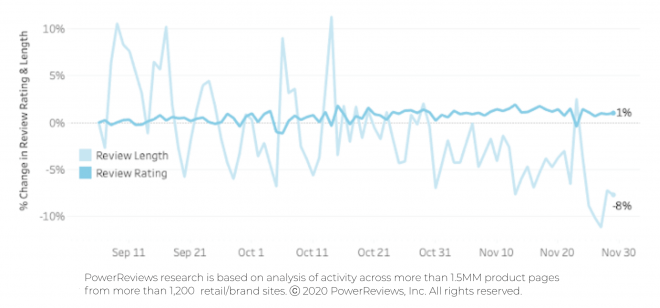
In terms of the actual content of reviews, there have not been any huge shifts over the past seven months. Product rating is consistently flat. This is probably because the products themselves don’t change significantly.
The fluctuations in length of review content submitted are only very modest (bear in mind the scale here is between +10% and -10%). This has been consistent since we started measuring back in April.
Last month, we did a deep dive into the impact of review content on the buyer journey.
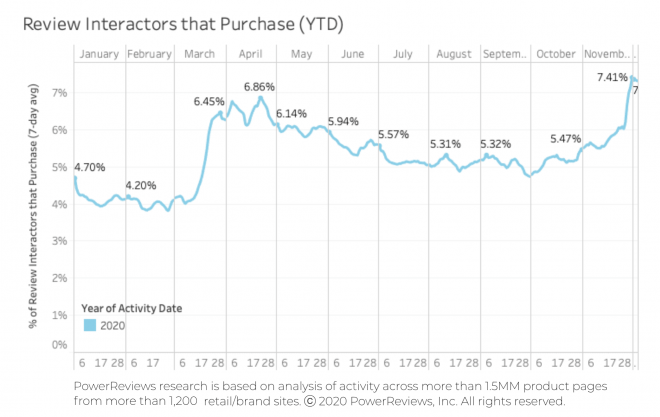
The charts in this section highlight the percentage of online shoppers who go onto purchase after they’ve interacted with review content (i.e. searched, filtered, clicked to extend the review from preview to view entire content etc.)
We found that review interactors were consistently converting at around a 25% higher rate than they were a year ago (the conversion figure is typically around 5.25% in the three months prior to Black Friday, compared to around 4.25% in the same period for in 2019).
For context, this figure had come down from its Covid peak (as also demonstrated below) of 6.85% in April. This is in line with when we saw the highest ecommerce purchase volumes (as mentioned, they hit a peak of 210% above where they were pre-Covid at this time).
However, the influence of reviews surged to their highest rate of the year during the Cyber 5, with 7.41% of review interactors going on to purchase (an increase of 30%). As you can see from the charts, this is entirely in line with typical trends. Reviews always become more impactful on the buyer journey during the Holidays.
But – interestingly and despite their generally increased importance during Covid – they topped out at an almost identical level to for the same period in 2019. Given the clear long-term trends evident in the data, we would expect stabilization at the 5.25% level we’ve consistently seen throughout 2020 as we move out of the Holiday period.
Analysts speculated extensively about the potential Covid impact on ecommerce Holiday trends. Well, now the results are in.
There were significant surges in both online purchase volumes and traffic, the likes of which we only saw right at the start of the pandemic (when the 3x increase came off a lower baseline figure). It being the Holidays, this increase was more expected. But the extent and velocity of the surge is still breathaking.
Ratings and reviews have become more influential on the buyer journey throughout the pandemic. In fact, interactors with review content have consistently converted at around a 25% higher rate than in 2019.
The Holidays is also historically a time when consumers rely more on ratings and reviews to make purchase decisions. This year was no exception, with 7.41% of review interactors going onto purchase (compared to 5.41% at the end of October). This is an almost identical Cyber 5 peak to 2019.
However, we don’t expect this to alter the overall trend we’ve seen throughout this year. More people are spending more money online – and they rely more on ratings and reviews to make their purchase decisions than ever before.
Eight ways brands turn UGC insight into action to improve products, identify new audiences, and more.
User‑generated content (UGC) plays a critical role in influencing purchase decisions in today’s shopper‑centric commerce environment, and its value extends far beyond traffic and sales.
Ratings, reviews, photos, videos, and Q&A do more than build trust at the point of purchase: UGC contains rich, product‑level insights that can inform pricing, product development, messaging, merchandising, and marketing strategy.
Our eBook, “The Insider’s Guide to Analyzing User‑Generated Content to Drive Business Growth,” explores how brands and retailers can unlock the full value of UGC by analyzing it strategically and turning insight into action across your organization.
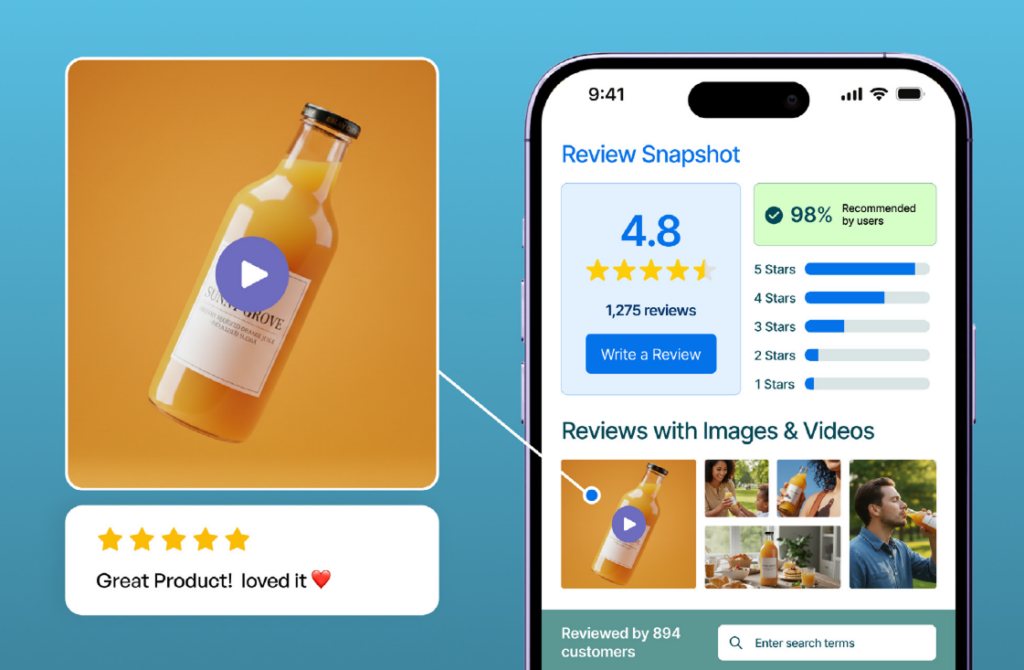
Learn how UGC data supports smarter decisions company‑wide.
Why manual reviews fall short and how analytics delivers insights.
Authentic, product‑specific, context‑rich insights that traditional feedback misses.
This is the eighth edition of our monthly snapshot, an analysis of consumer activity across more than 1.5MM online product pages from more than 1,200 retail/brand sites.
The impact of COVID on ecommerce has been fairly clear to pinpoint. A huge initial surge led to an overall 3x increase in online purchase volumes between February (pre-pandemic) to May. However, the subsequent four months through to September led to a steady decline and then stabilization, with purchase volumes consistently between 40% and 70% higher than they were pre-pandemic.
Due to this stabilization, we re-aligned our reports to three month periods. In this report, we wanted to see whether the early start to Holiday shopping that consumers had indicated in our survey had borne out.
Our data reveals a clear uptick towards the end of October, which is in somewhat line with these findings.
This month, we also take a closer look at the impact of consumer reviews on shopper buying decisions – and specifically compare our findings year-on-year.
Generally, consumer behavior has clearly become more predictable, with purchase volumes consistently at around 1.4x to 1.7x where they were at the start of the pandemic.
Why? At the risk of using a very overused COVID phrase, this is most likely because the entire population has settled into a “new normal”. People are no longer buying in the bulk they were because they have confidence in the supply chain and product availability.
But the Holidays bring us into uncharted territory. Typically, we can predict online shopping volumes will increase but this Holiday period is completely unprecedented for obvious reasons.
In our recent survey, 92% said they would start Holiday shopping either earlier or at the same time as last year.
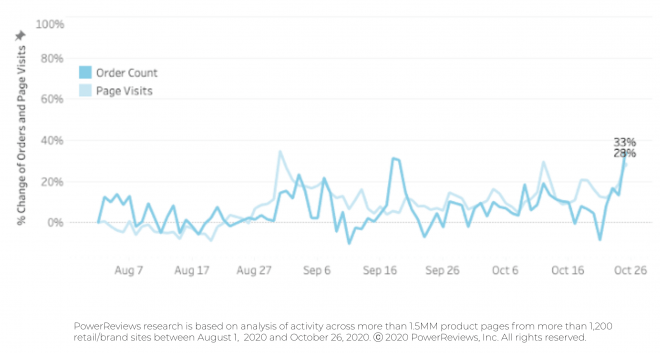
Toward the end of October, there was clear evidence of an uptick in activity. However, this isn’t especially any earlier than we’d normally expect to see it. And for the most part, both traffic and sales volumes are relatively consistent with where they’ve been since June 2020. So, although consumers were saying they’d spend more earlier this Holiday, this is only partly reflected in our data.
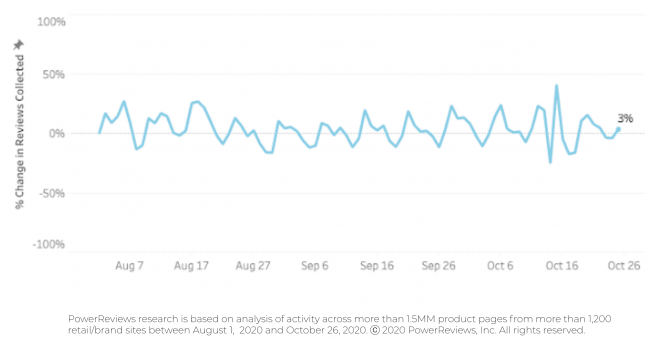
After reporting a giant 2.3x leap in review submission levels from April to May, we subsequently highlighted a consistent drop through to September to the point where levels are now consistent with what we saw pre-pandemic. This again continued for the last month.
We hypothesized previously that this is most likely because consumers have now got to the point where they are no longer buying items they hadn’t tried before. Instead, they now have established product preferences so are less inclined to be motivated to submit reviews.
In terms of the actual content of reviews, there have not been any huge shifts over the past six months. Product rating is also consistently flat. This is most likely because the products themselves don’t change significantly.
The fluctuations in length of review content submitted are more pronounced. Due to some fairly significant peaks and troughs, it’s difficult to pinpoint a clear trend here. But this is one we’ll continue to monitor in future months.
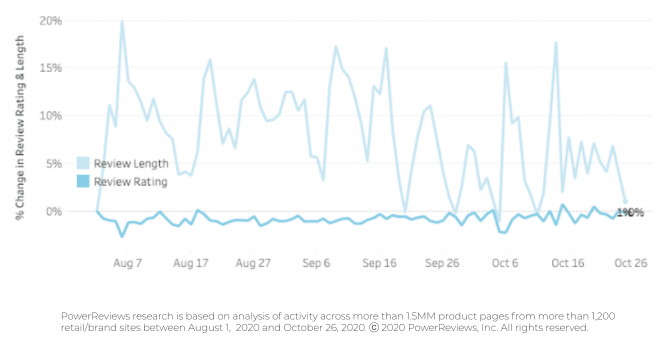
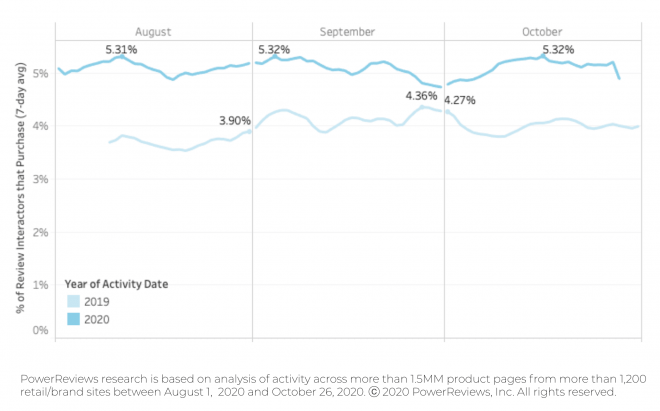
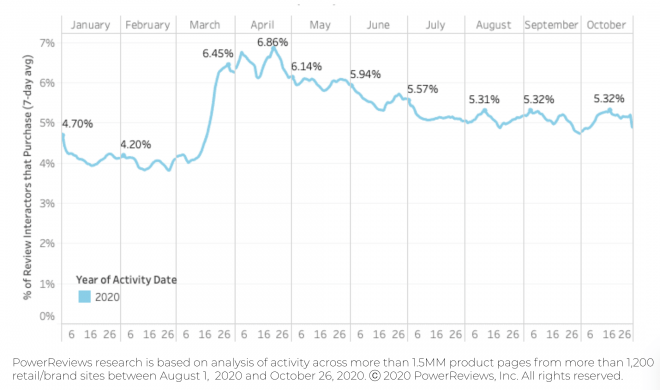
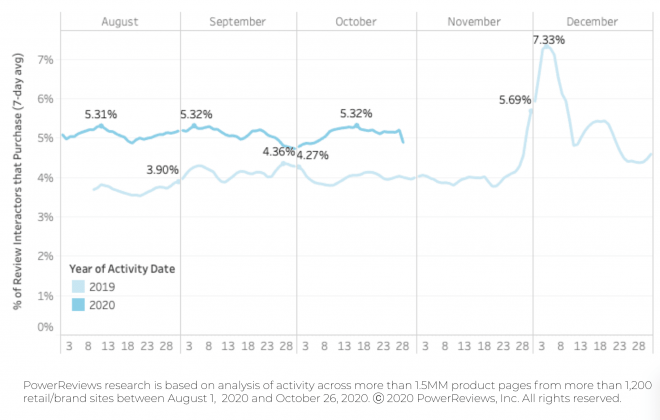
This month, we wanted to dive deeper into the impact of review content on the buyer journey. The three charts in this section highlight the percentage of online shoppers who go onto purchase after they’ve interacted with review content (i.e. searched, filtered, clicked to extend the review from preview to view entire content etc.)
Bottom line: review interactors are converting at around a 25% higher rate than they were a year ago.
According to the first chart below, the conversion figure is consistently around 5.25% over the last three months. A year ago, the same figure was consistently around 4.25%.
For context, this figure has come down from its COVID peak (as also demonstrated below) of 6.85% in April. This is in line with when we saw the highest ecommerce purchase volumes (as mentioned, they hit a peak of 210% above where they were pre-Covid at this time).
Looking ahead, reviews typically become even more influential in the buying process during the holidays. Our chart highlights how they soared in late November/early December last year. We anticipate the same happening this time out. Based on what we’ve seen so far this year, we’d expect them to be even more important during the imminent Holiday period.
At the start of October, we saw continued stabilization. As the month wore on, purchase volumes did pick up – a trend we expect to continue in the build-up to the Holidays.
As we all know, the Holidays are the biggest time of year for ecommerce and retail. And our research indicates, predictably, that this will actually be the biggest Holiday season ever for ecommerce. We are therefore anticipating a huge surge in traffic and purchase volumes throughout November.
In this report, we explored the growth in the impact of review content on the buyer journey. Significantly, this is now roughly a quarter more important in driving sales on ecommerce product pages than a year ago – a notable shift. With this impact typically surging to its annual peak during the Holidays, ratings and reviews look set to be more important than ever for shoppers during the Cyber 5/BFCM and beyond.

We know that 88% of consumers specifically look for visuals (such as photos or videos) submitted by other consumers prior to making a purchase. It’s key to provide these shoppers with the information they’re looking for, or else you risk losing them to a competitor that does.
A simple way to generate more user-generated visual content for your home, category, gallery, and product detail pages (and other marketing materials) is to gather it from where it’s already being shared and posted by your customers — on Instagram.
In this guide, you’ll find best practices to put to use during each stage of your social collection campaign.

The first step to success when curating social content is to plan for success. The biggest component of this is selecting the right campaign hashtag to promote and follow on Instagram.
Why is this so important? Because choosing the right hashtag allows you to generate content that’s most relevant to your brand and your products. Plus, it can help you sort through the thousands of images you collect as you choose the UGC that will look best on your site.
Be sure to choose one that relates to the lifestyle of your customers and stays true to your brand’s image. General hashtags (think #OOTD) will generate millions of photos. But many of those photos won’t include your products, and they might even include products from your competitors.
On the other hand, a more targeted hashtag will generate less content, but the content will be way more relevant. This will save your team time in the long run as they won’t have to sift through a high volume of often irrelevant content.
If you want to save even more time and resources, and don’t want to sift through all of the content generated by your campaign hashtag on your own, leverage a specialist provider. The best practice approach of these vendors incorporates the moderation capabilities necessary to match and quality control the content you collect. At the same time, it will also ensure this content is on brand while being displayed quickly on your product, category, gallery and home pages.
Here’s how some of our friends are getting creative with their hashtags:


Here are some things to keep in mind when choosing the right hashtag for your campaign:
Don’t forget!
Work with your marketing team to make sure your campaigns and outreach flow with other marketing initiatives. For example, is your marketing planning to run a Holiday campaign? If so, collaborate and plan ahead so that the hashtag and your outreach don’t interfere with other initiatives.
The first step to success when curating social content is to plan for success. The biggest component of this is selecting the right campaign hashtag to promote and follow on Instagram.
Why is this so important? Because choosing the right hashtag allows you to generate content that’s most relevant to your brand and your products. Plus, it can help you sort through the thousands of images you collect as you choose the UGC that will look best on your site.
Be sure to choose one that relates to the lifestyle of your customers and stays true to your brand’s image. General hashtags (think #OOTD) will generate millions of photos. But many of those photos won’t include your products, and they might even include products from your competitors.
On the other hand, a more targeted hashtag will generate less content, but the content will be way more relevant. This will save your team time in the long run as they won’t have to sift through a high volume of often irrelevant content.
If you want to save even more time and resources, and don’t want to sift through all of the content generated by your campaign hashtag on your own, leverage a specialist provider. The best practice approach of these vendors incorporates the moderation capabilities necessary to match and quality control the content you collect. At the same time, it will also ensure this content is on brand while being displayed quickly on your product, category, gallery and home pages.
Here are some things to keep in mind when choosing the right hashtag for your campaign:
Here’s how some of our friends are getting creative with their hashtags:
Your shoppers won’t use your hashtag or tag your account if they don’t know what hashtag to use or what your handle is. So make sure you promote your campaigns.
Include language in your campaign promotions reminding customers of your hashtag and Instagram handle. Let them know you want to see how they’re using your products, and explicitly ask them to share photos and videos using your products on Instagram, communicate the hashtags you want them to use and request they tag you.
Don’t forget!
Be sure your most engaged and influential followers are aware of your campaigns. If you have a community of influencers (and don’t forget about the influence micro influencers can have), make sure to add their handles to your list of Approved contacts, so their content is automatically approved and displayed.
Engaging influencers will also help increase the reach of your campaign by getting in front of your influencers’ followers as well — a great way to get more content, faster, at the start of your campaigns.
You’ll need to get permission from consumers before using their photos or videos across your website or in other marketing materials.
Make sure you have all legal language crafted and approved before the start of your campaign, so you can start collecting approved content as soon as possible. Establish a terms and conditions page — somewhere users can go if they have questions — and link to this page when asking for permission. Once a user gives permission to use their content in marketing materials, make sure to attribute the content to them. Say something along the lines of “Photo courtesy of [insert Instagram handle].”

In order to leverage user-generated images and videos in your marketing initiatives, you’ll need to get the creator’s permission (at PowerReviews, we know how important this process is so we seamlessly incorporate it into our technology).
Best practice:
Tailor the permission messages you send for your different customer groupings and profiles.
Not all your customers are the same, so think about how best to motivate each individual to grant you permission to repurpose their content. Your messages won’t always be one-size fits all.
For example, a sporting goods company’s customers can span from beginners to more advanced athletes — both of which could respond in different ways. Beginners will be more excited to share photos of themselves learning a new skill, while advanced users might want to show more close up photos of the products they’re using to train.
Take note of who grants image rights and note which messaging works best for different users.


Your shoppers won’t use your hashtag or tag your account if they don’t know what hashtag to use or what your handle is. So make sure you promote your campaigns.
Include language in your campaign promotions reminding customers of your hashtag and Instagram handle. Let them know you want to see how they’re using your products, and explicitly ask them to share photos and videos using your products on Instagram, communicate the hashtags you want them to use and request they tag you.

After your campaign is over, take a look at its performance. Look at who is sharing content and what kind of content they’re sharing.
For example, are the images being shared poor quality? If so, you might need to provide your users with more direction on what you’re looking for.
In addition, take note of who your UGC creators are. You’ll find interesting insights into what products are being featured, and the style of content being created. With this information, your brand can learn more about how a product is being used, who’s using it, and what type of content resonates with different types of shoppers. Note what worked, and what you can change for the next campaign.
Dig even deeper
With PDP Site Analytics, track the actual sales impact of visual content on your site. PowerReviews data across all our customers shows visitors that interact specifically with visual UGC have a conversion lift of 81% over general visitors who don’t interact with visual UGC.
This information specifically applied to your own UGC and Social Curation programs helps you iterate, improve and optimize for bigger impact. Find out what imagery and video resonates best at what point in the journey, then seek to generate and display more of this.
Include language in your campaign promotions reminding customers of your hashtag and Instagram handle. Let them know you want to see how they’re using your products, and explicitly ask them to share photos and videos using your products on Instagram, communicate the hashtags you want them to use and request they tag you.
Authentic user-generated visual content shared on social media provides compelling social proof to shoppers on your site. Brands and retailers are increasingly leveraging this content at high impact points of their digital experience to nurture and convert traffic – whether this is on their homepages, product pages or in their marketing materials.
The key is being able to collect and display this content at scale.
The PowerReviews Social Curation platform enables just this, by providing unique capabilities to cultivate, surface and showcase social media postings to accelerate the path to purchase.

A critical and very evident trend to emerge as part of the COVID-19 pandemic: brands that previously relied on selling their products in person have had to shift online and go “Direct to Consumer”.
A comprehensive UGC program – including ratings, reviews, images, video and Q&A content – is now an ecommerce must-have, with 97% of consumers consulting product reviews before making a purchase.
So many brands are seeking to implement UGC quickly as part of this transition.
This is the seventh edition of our monthly snapshot, an analysis consumer activity across more than 1.5MM online product pages from more than 1,200 retail/brand sites.
The impact of COVID on ecommerce has been fairly clear to pinpoint. A huge initial surge led to an overall 3x increase in online purchase volumes between February (pre-pandemic) to May. However, the subsequent four months through to September led to a steady decline and then stabilization, with purchase volumes consistently between 40% and 70% higher than they were pre-pandemic.
Due to this stabilization, we re-aligned this month’s report to show the last three months.
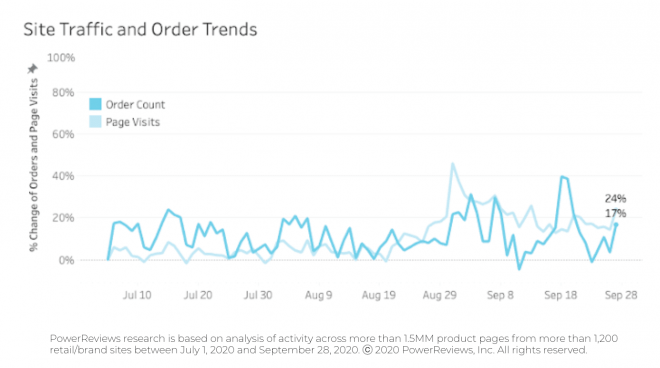
The general story is yet more month-on-month stabilization, as we would see in more “normal” years. This means ecommerce sales volumes are higher than where we would typically expect them to be pre-pandemic, but there are also no real major fluctuations indicative of major market shifts.
With this being the case, the Holidays is likely to be the next major event on the horizon when we see any meaningful change.
Consumer behavior has clearly become more predictable, with purchase volumes consistently consistently at around 1.4x to 1.7x where they were at the start of the pandemic.
Why? Most likely because the entire population has settled into a “new normal”. People are no longer buying in the bulk they were because they have confidence in supply chain and product availability. They know they will be able to source whatever items they need at short notice. Pandemic life has become normal. We are now used to buying our groceries and other everyday items online. This is reflected in our recent survey, which highlighted how 33% of consumers say their shopping habits have changed forever.
We expect the next major shift to be the Holidays. It’s difficult to predict what these will look like this year but – and this is perhaps not the most groundbreaking observation – we are predicting significantly more spending occurring online than in previous years. In fact, the survey highlighted above illustrated how 64% will spend more online than the last Holiday season. Perhaps of more significance is the timing of this Holiday spend. Our survey also shows that three-quarters will start Holiday shopping earlier than they usually do. So we anticipate notable increases in activity to start over the next month.
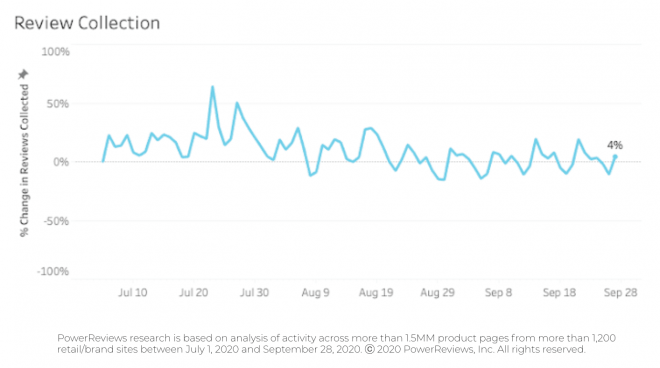
After reporting a giant 2.3x leap in review submission levels from April to May, we subsequently highlighted a consistent drop through to August to the point where levels are now consistent with what we saw pre-pandemic. This again continued for the last month.
We hypothesized previously that this is most likely because consumers have now got to the point where they are no longer buying items they hadn’t tried before. Instead, they now have established product preferences so are less inclined to be motivated to submit reviews.
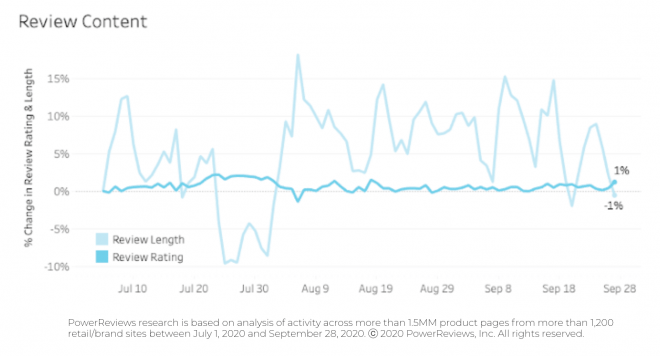
In terms of the actual content of reviews, there have not been any huge shifts over the past six months. Both have been unaffected by the pandemic, which is unsurprising because overall product catalogs themselves will not have shifted too significantly.
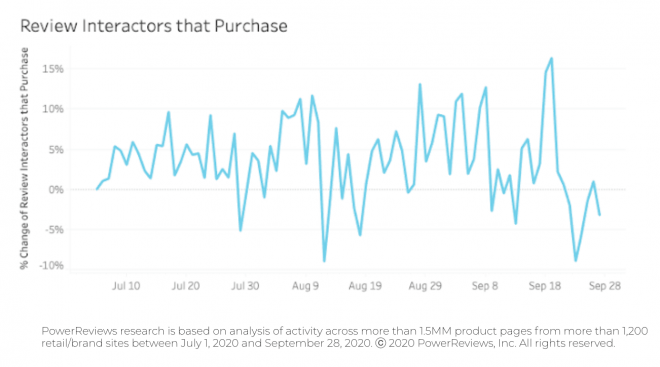
Review content is more influential in driving purchase decisions than it was before the pandemic. A higher proportion of those who interact with reviews are going on to purchase than were doing so pre-COVID.
The August high of 45% above pre-COVID levels was virtually identical to the July high (43% above). As you will note from the scale of this chart, we saw similar numbers through September.
As thoughts turn to the Holidays, this trend is only likely to be accentuated. Our Holiday Survey highlights how 37% of shoppers will pay more attention to ratings and reviews this year than last when making purchases.
When we segmented out consumers who will increase spend this year, this trend was even more pronounced. 25% of this group will be more influenced by ratings and reviews this Holiday season (this is compared to the 19% who say they will increase spend overall).
The story for the October snapshot is that it has proven to be the fourth month of continued stabilization. Trends are now very flat so we can confidently say we are now in a COVID-driven “new normal”.
However, the Holidays – the biggest time of year for ecommerce and retail – loom large. Our research indicates, predictably, that this will be the biggest Holidays ever for ecommerce.
Two other key findings in our Holiday report are particularly worth noting though:
With this being the case, we expect ecommerce traffic and sales to increase through October in the run-up to the Holiday season.
Our consumer survey of 650 Canadian shoppers highlights spending plans for the Holiday season, factors driving purchase decisions, likelihood of shopping online vs in-store and much more.
