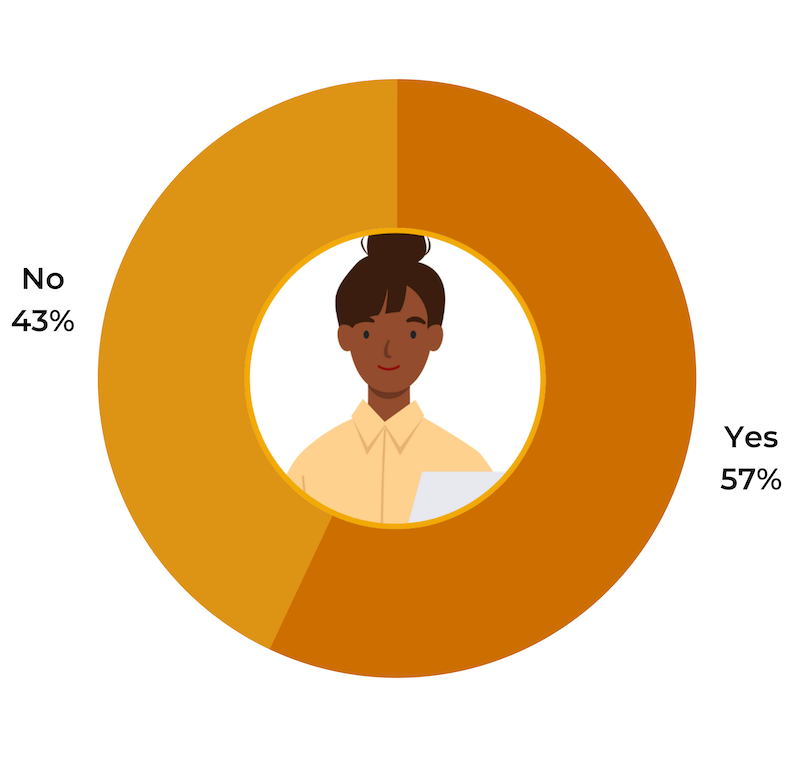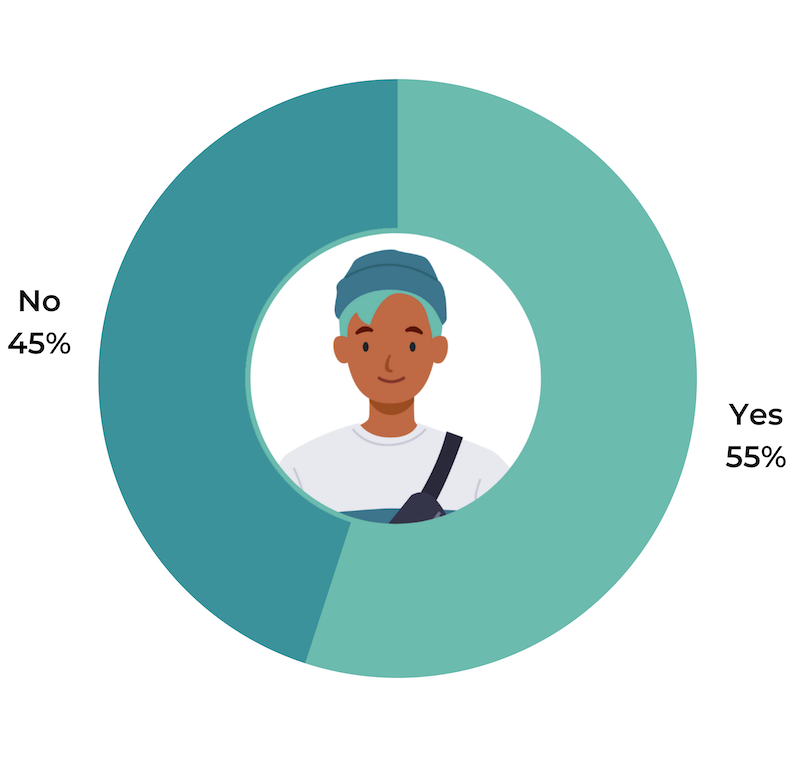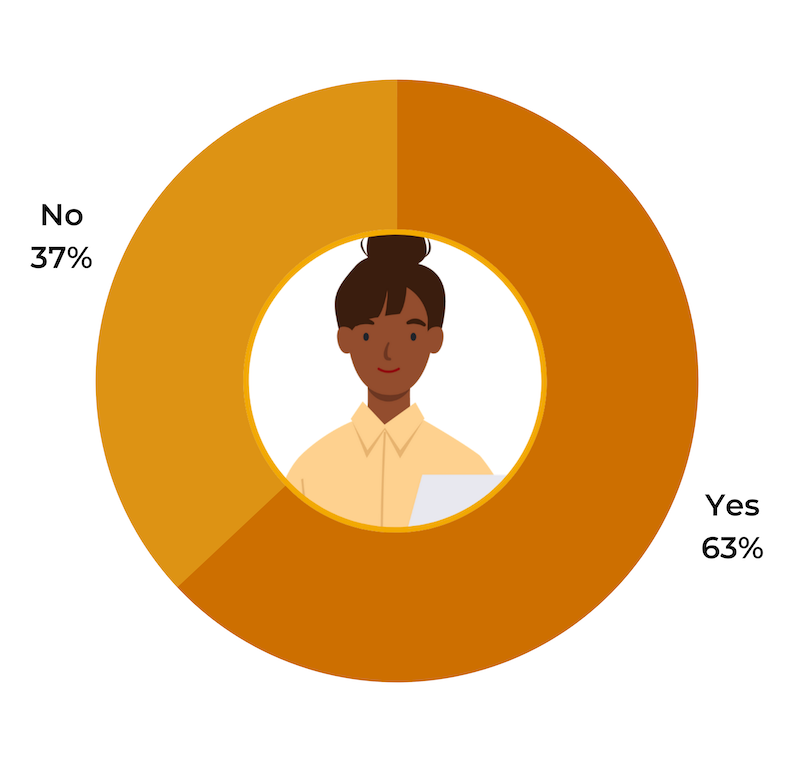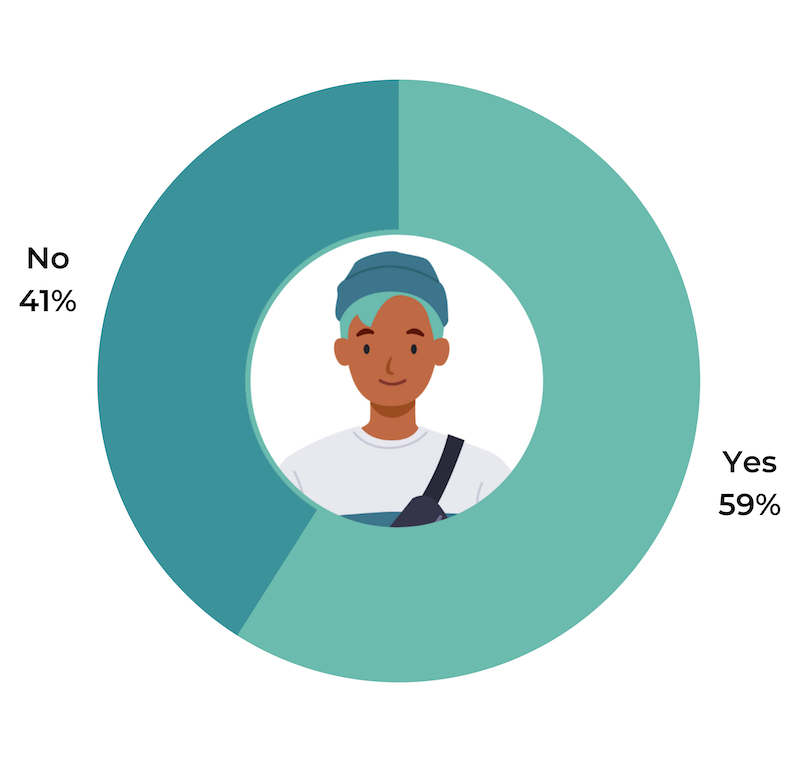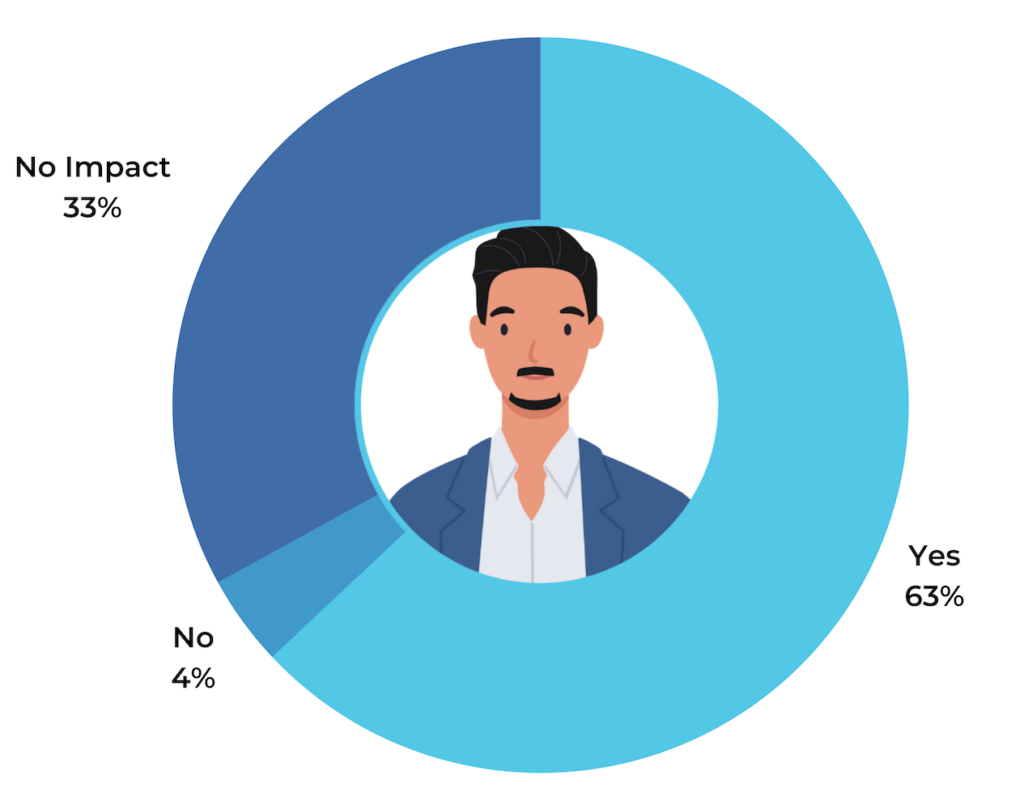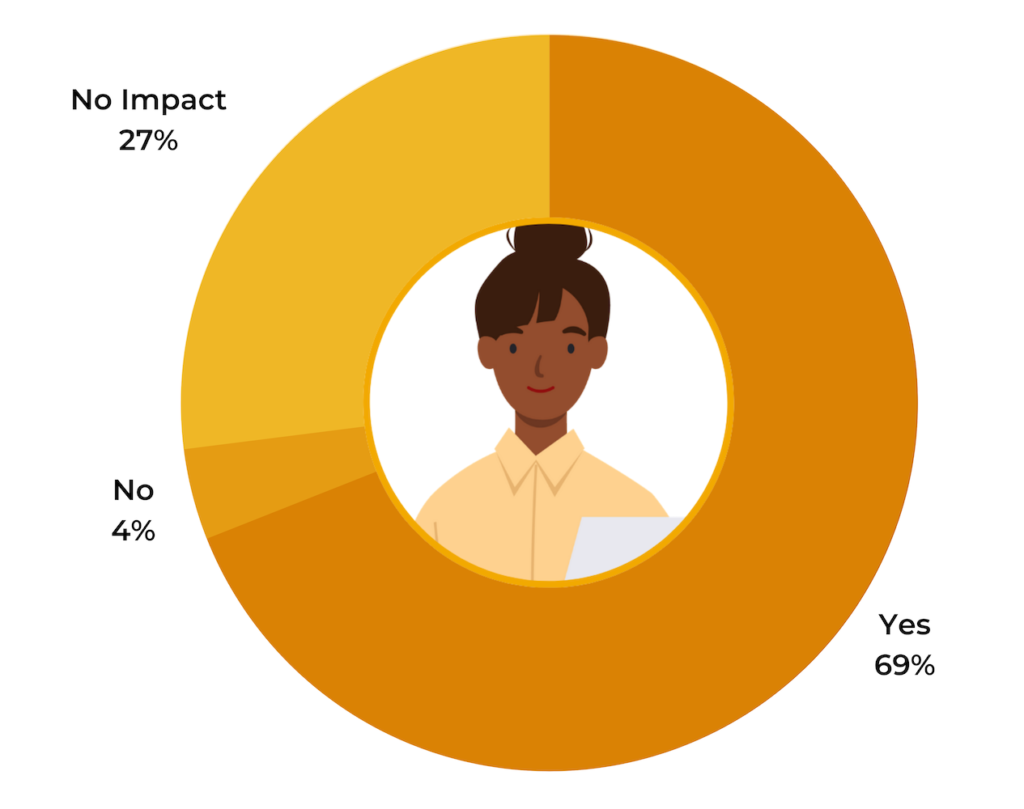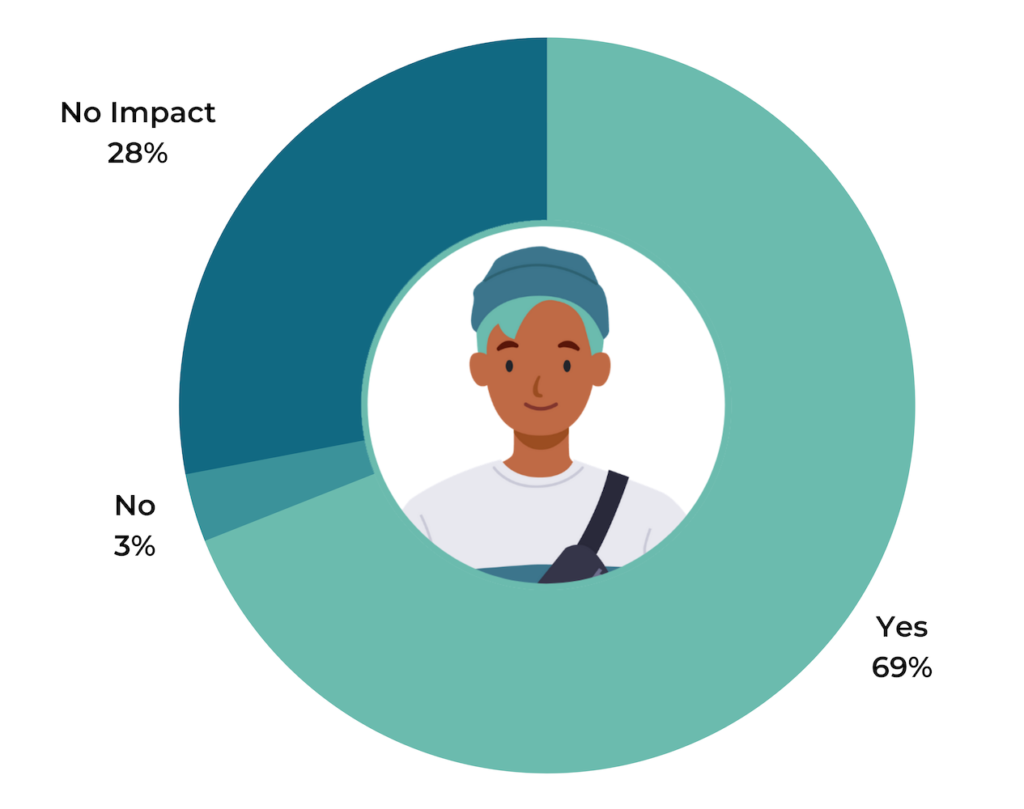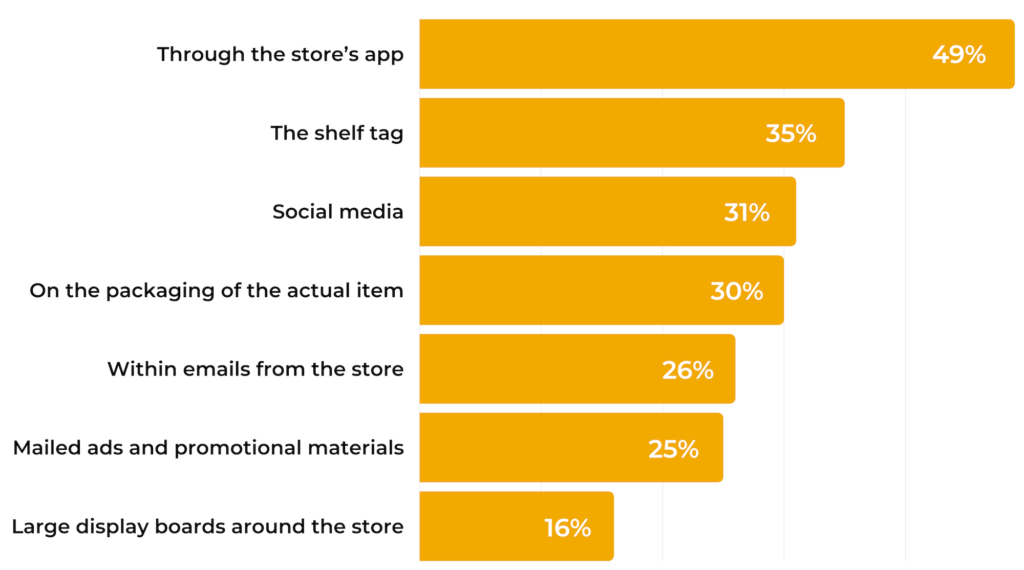
Consumers ready to get back to stores after pandemic

Survey at a Glance:

  • Over 70% of consumers have no concerns about returning to in-store shopping, a 2.4x increase from our September 2020 holiday data.

  • The top three measures retailers can implement to make shoppers feel more comfortable shopping in-store include frequent sterilization of store premises, curbside pickup, and requiring associates to wear masks.

  • Younger consumers expressed a stronger preference for BOPIS, curbside pickup, and contactless payment options.

  • 64% of shoppers said a negative in-store experience would prevent them from shopping with a retailer again in the future.

  • 84% of shoppers would feel a moderately or significantly stronger affinity for a retailer if asked to participate in a secret shopper mission to improve their customer experience.

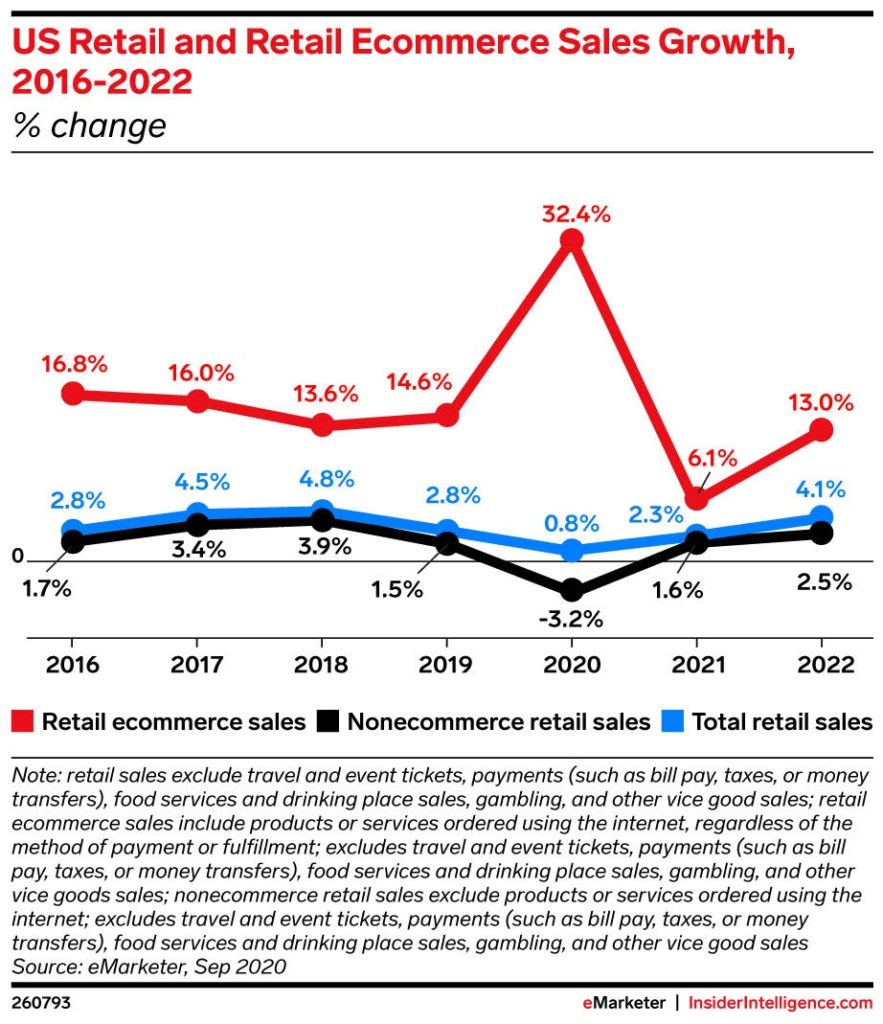
We all know that ecommerce skyrocketed in 2020, thanks to the COVID-19 pandemic. Forrester reported gains of 30% year over year for ecommerce sales.

With this backdrop on top of clear and consistent year-on-year ecommerce growth the norm prior to the pandemic, it’s hard to forget just how dominant the store was and continues to be in US retail.

So what’s the long-term outlook for brick and mortar retail? Healthier than ever, also according to Forrester. The market research firm predicts in-store shopping will continue to dominate retail, accounting for 72% of all sales in 2024.

To capture their slice of the sales, retailers must provide an in-store experience that makes customers feel safe and valued. The pandemic introduced several changes to the in-store experience, many of which shoppers would like to continue.

To help retailers succeed, we surveyed 7,668 shoppers from age 18 to 80 to see how they really feel about going back to the store — and what retailers can do to earn their loyalty, and their dollars.

Are Consumers Ready to Return to In-Store Shopping?
The Data Says Yes.

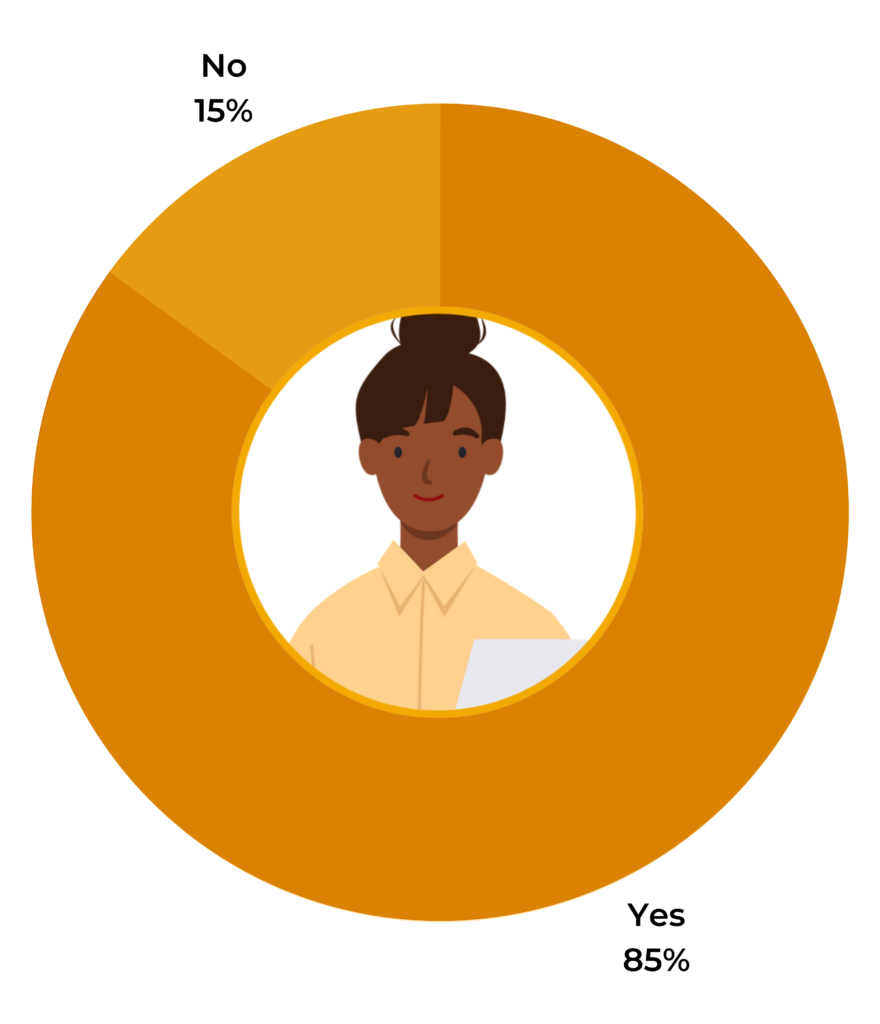
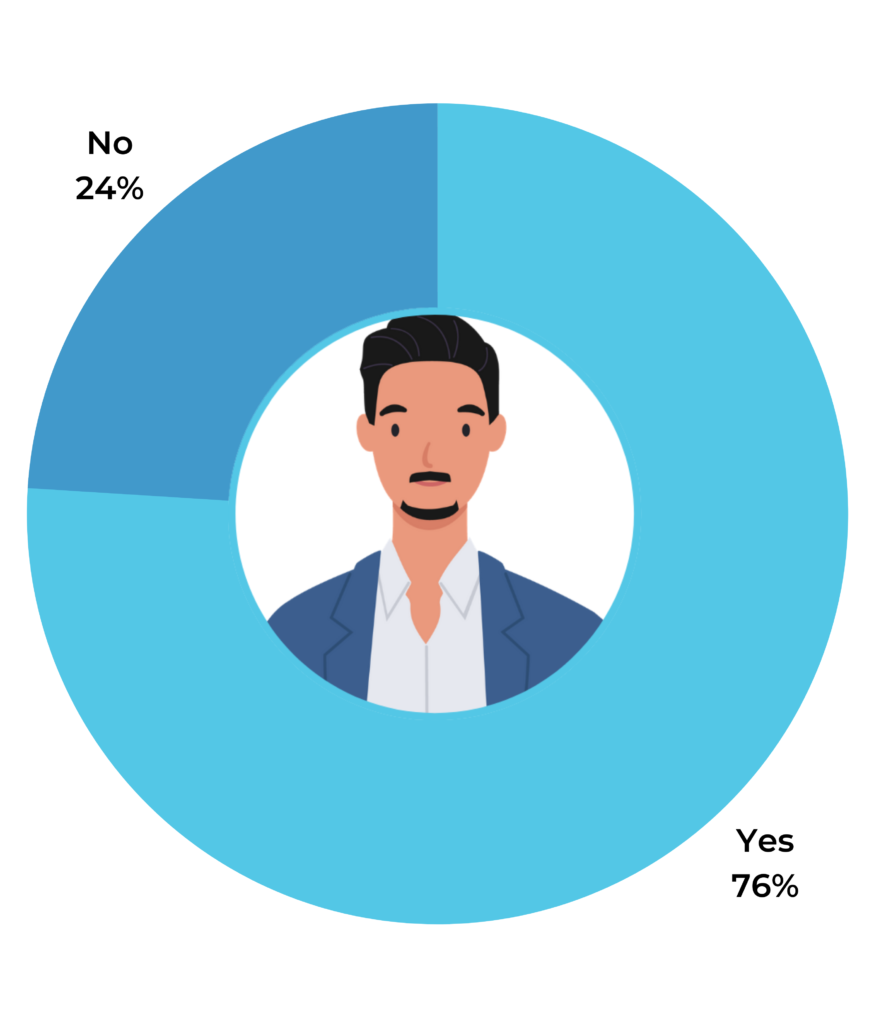
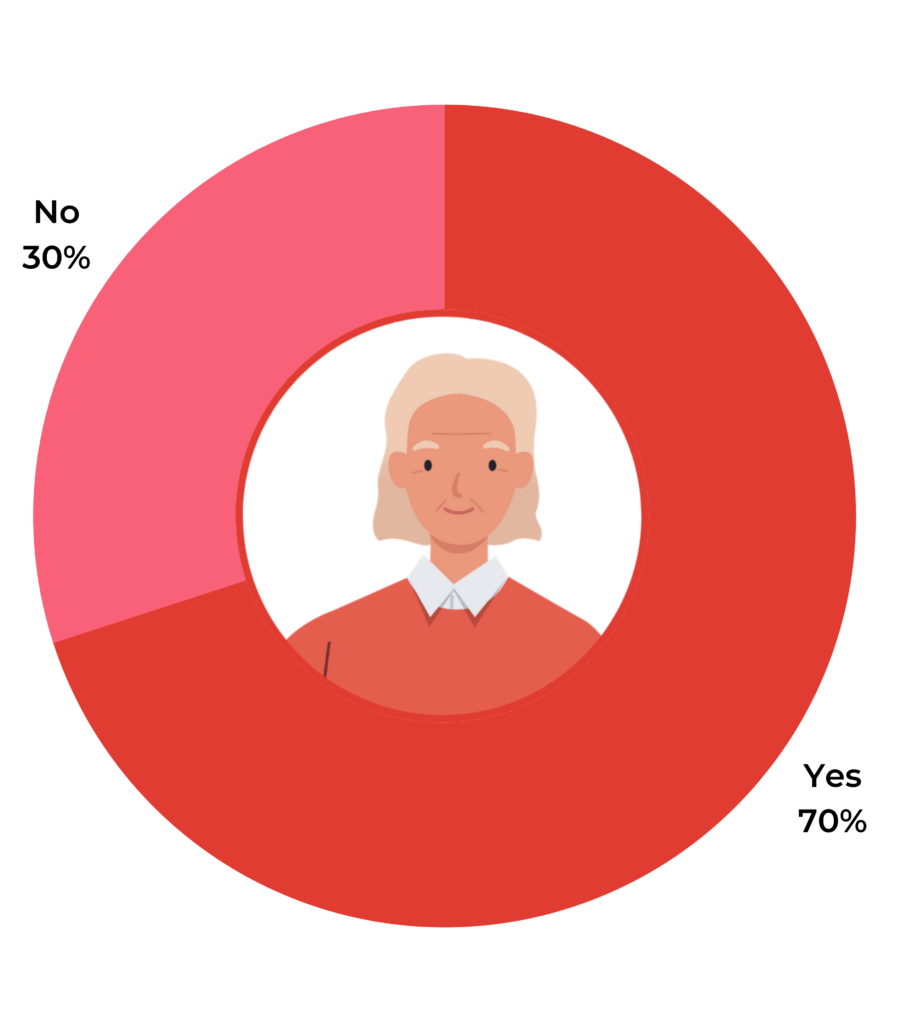
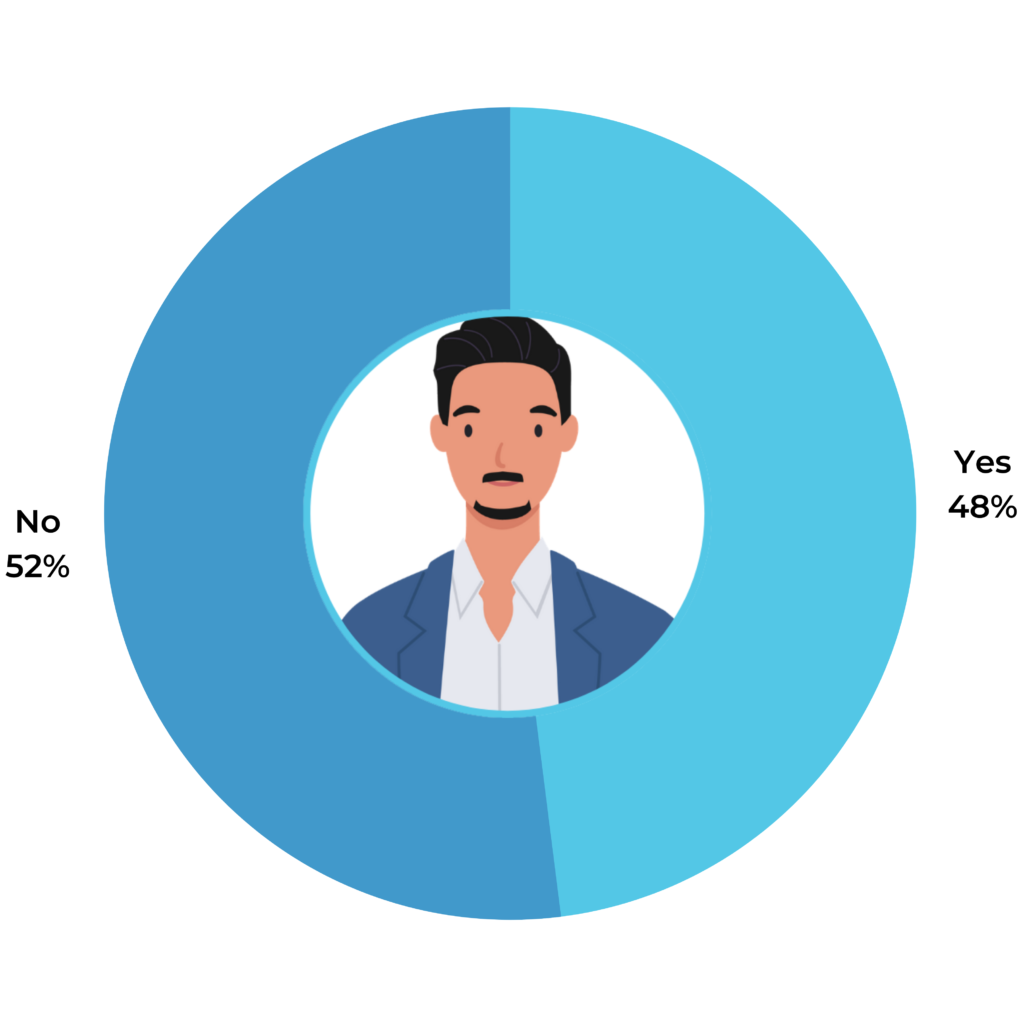
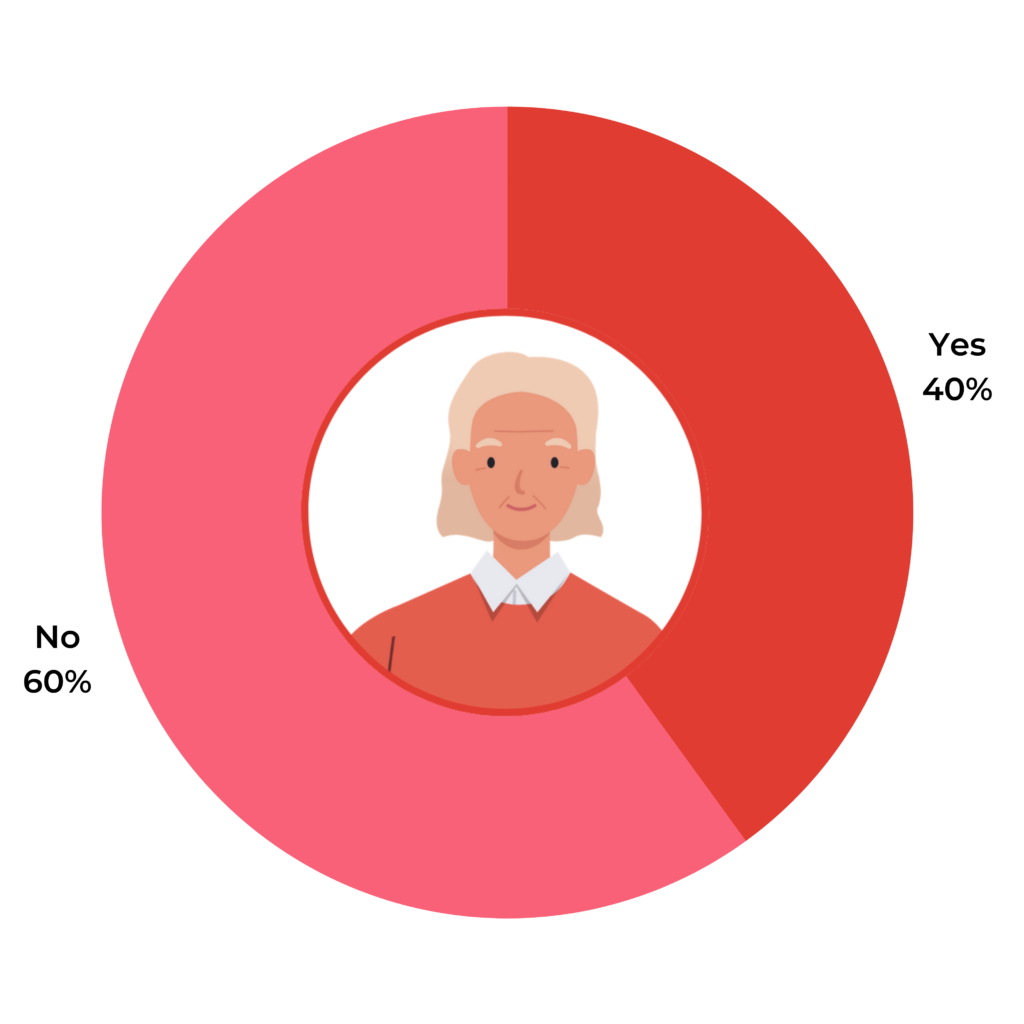
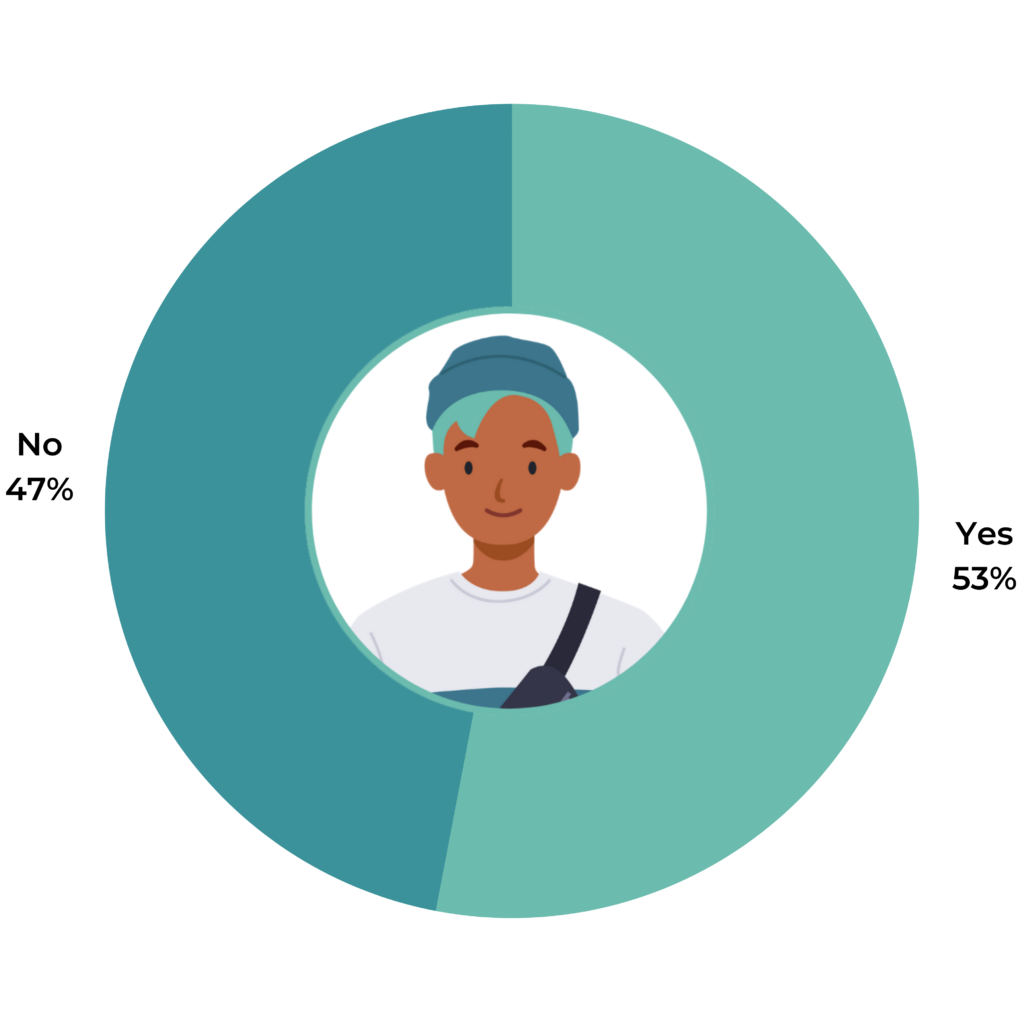
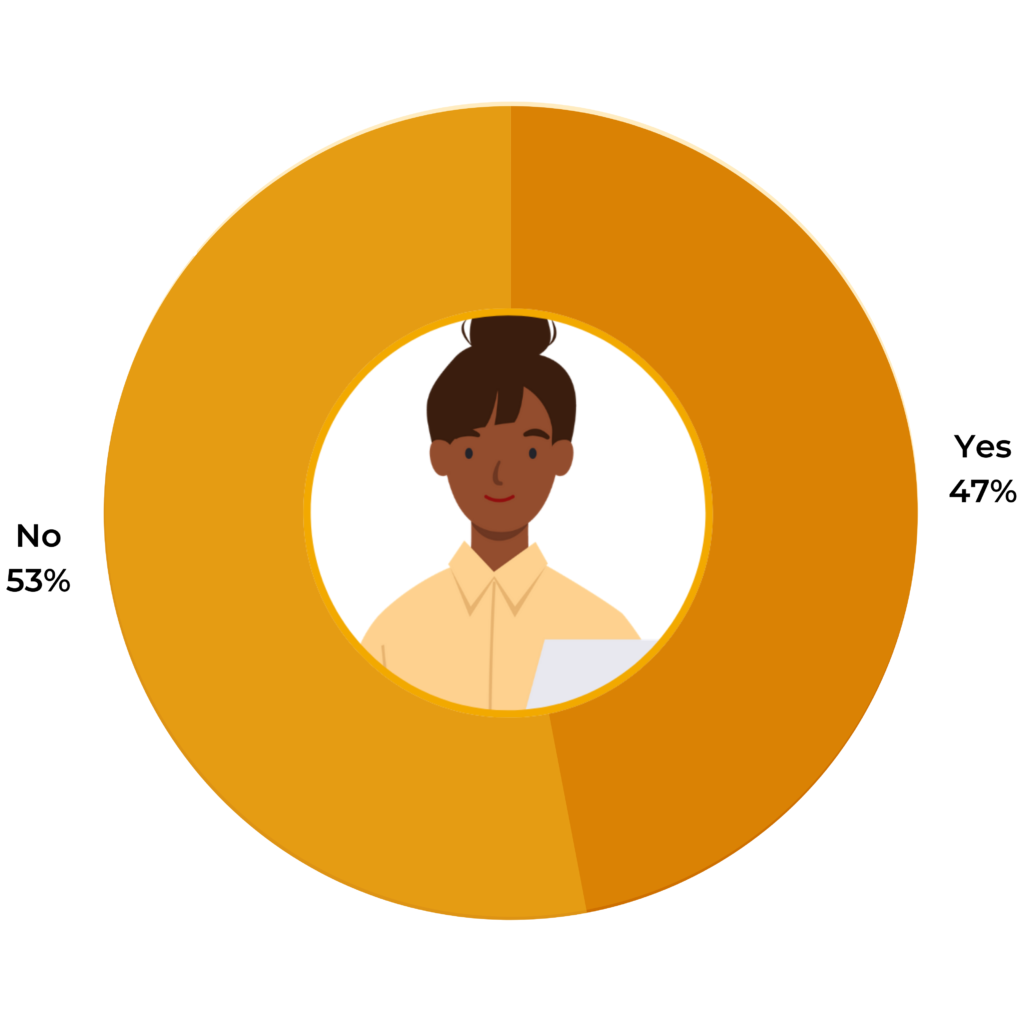
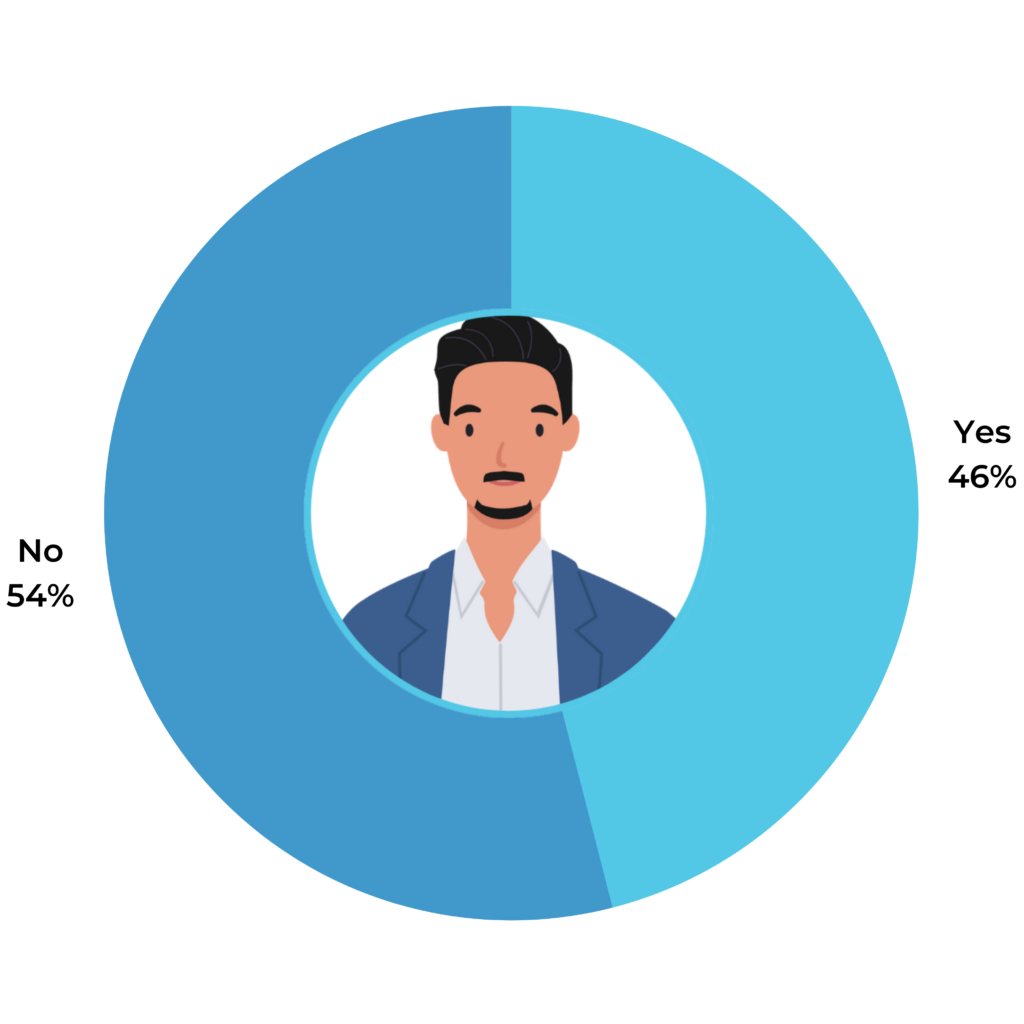
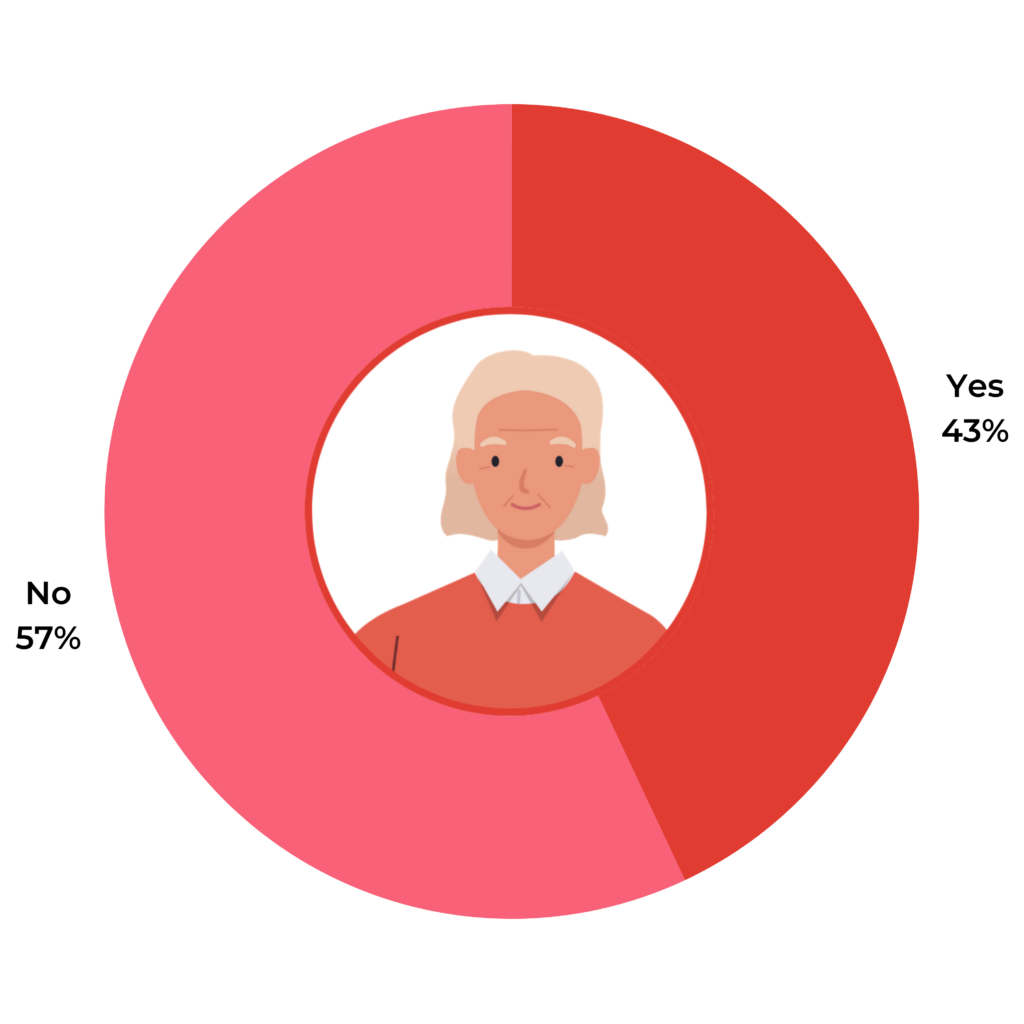
In a stark reversal from our Holiday Consumer Survey from September 2020, when only 30% of shoppers were comfortable shopping in-store, 71% of consumers now say they have no concerns about shopping in-store. That’s more than a 2x increase!
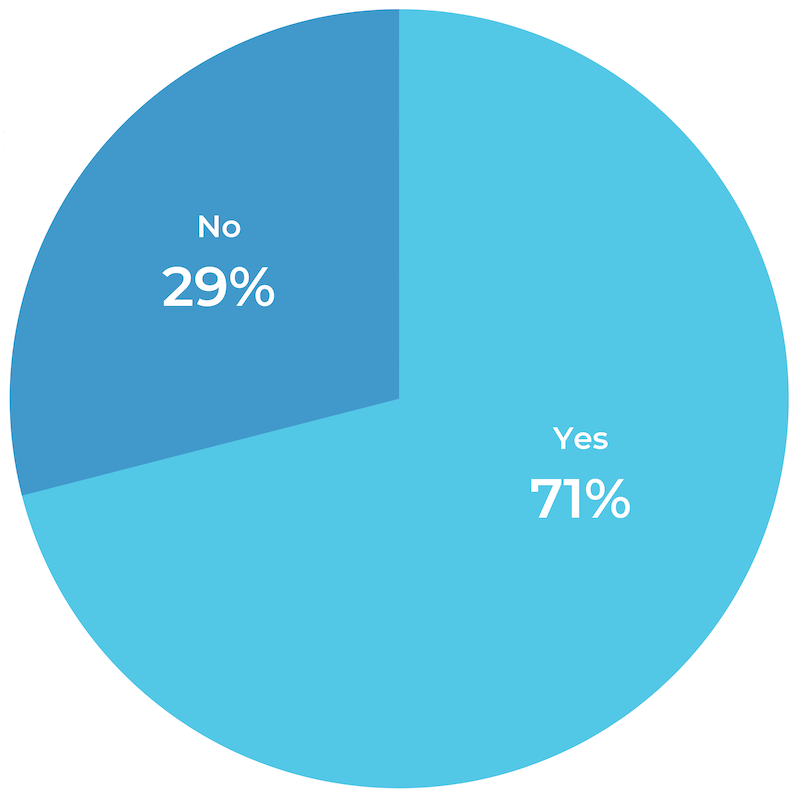
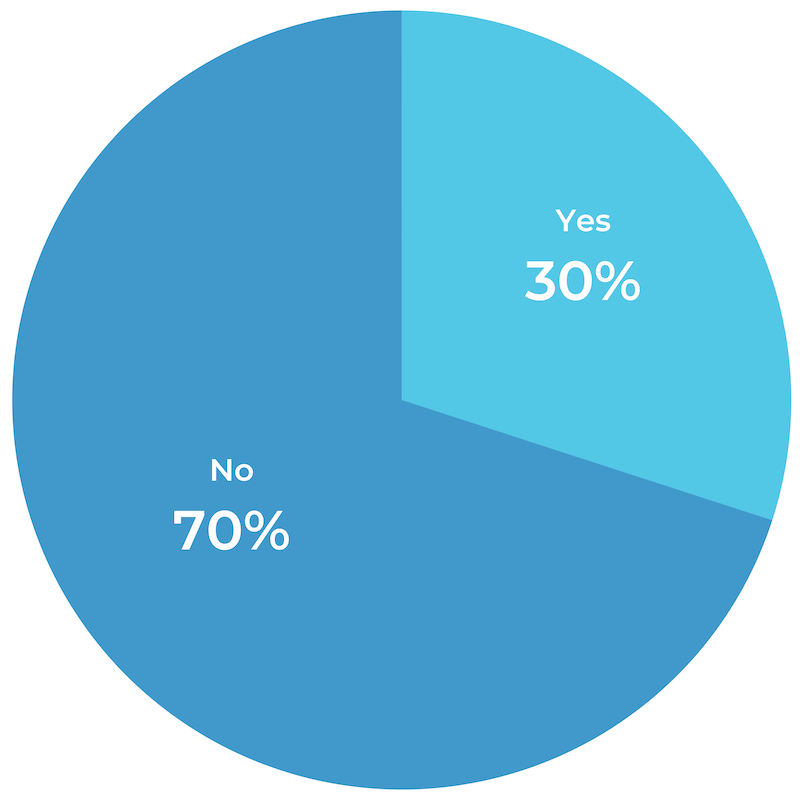
Comfort Levels Regarding In-Store Shopping
Are you concerned about shopping in-store due to the COVID-19 pandemic?
September 2020
June 2021

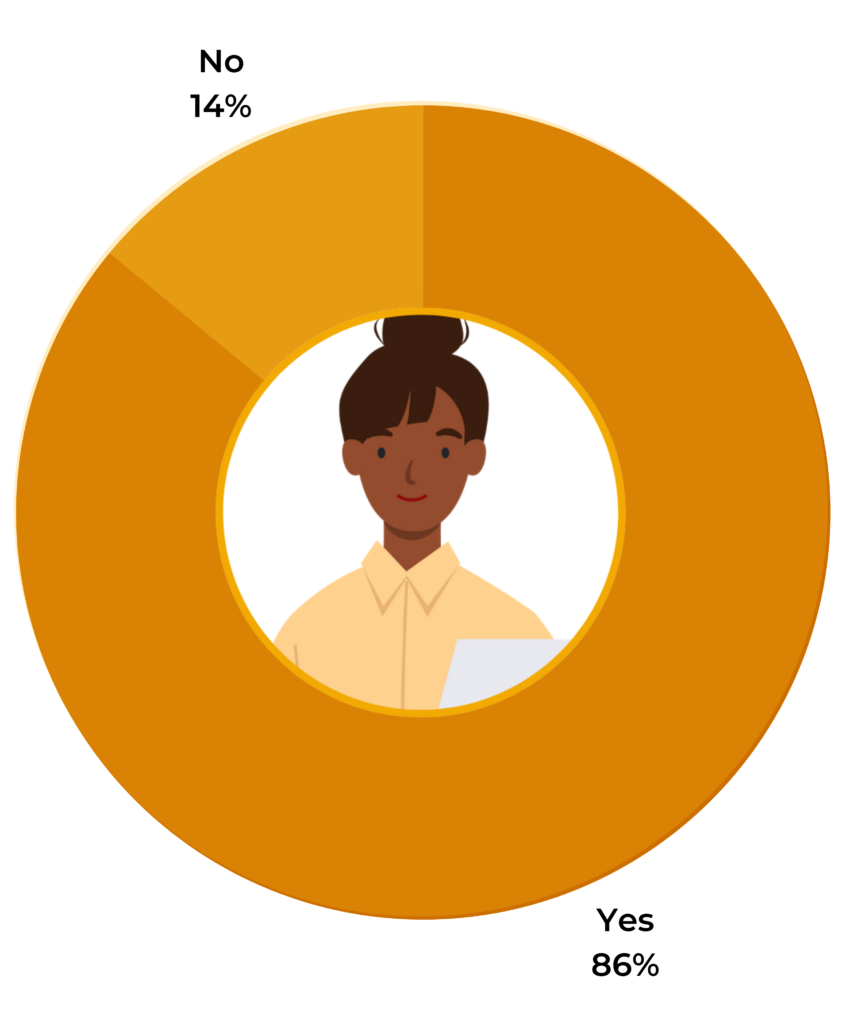
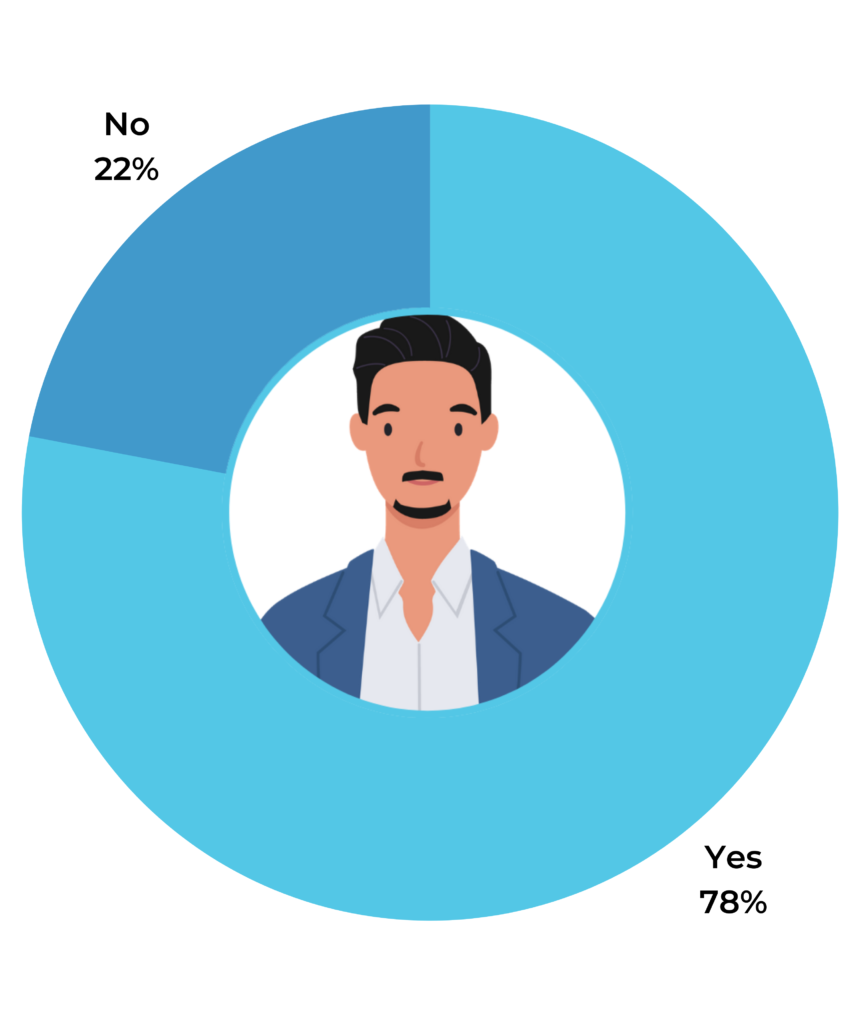
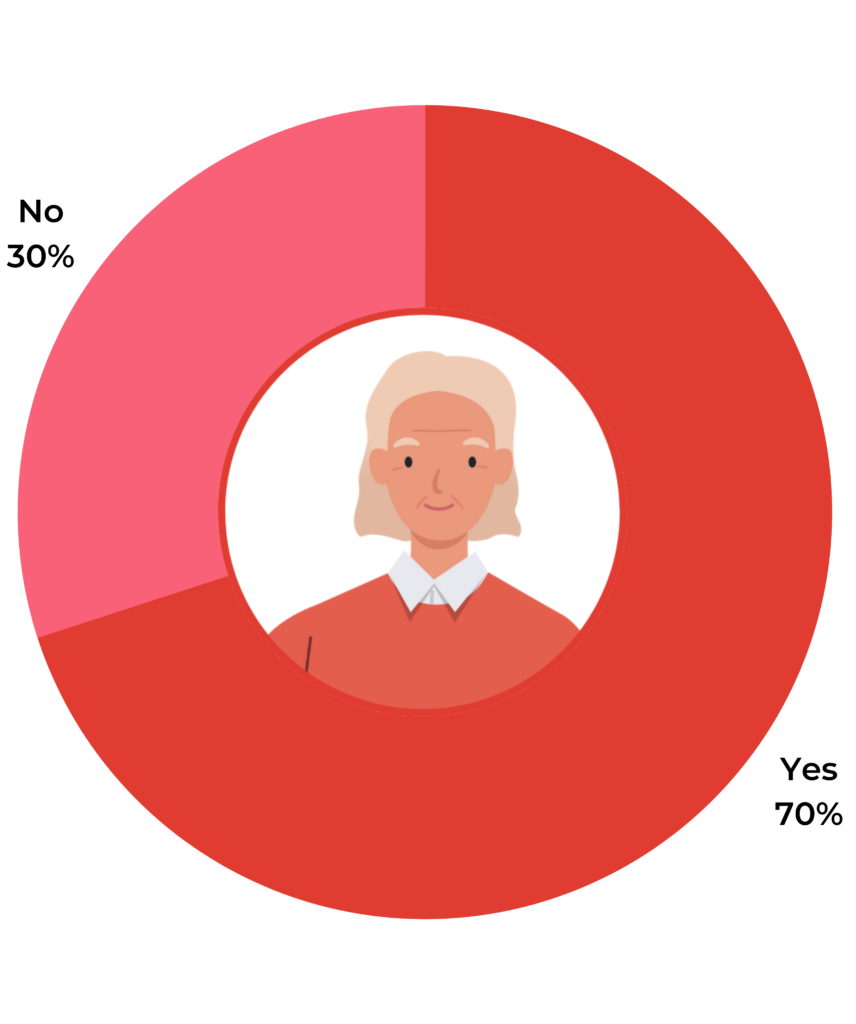
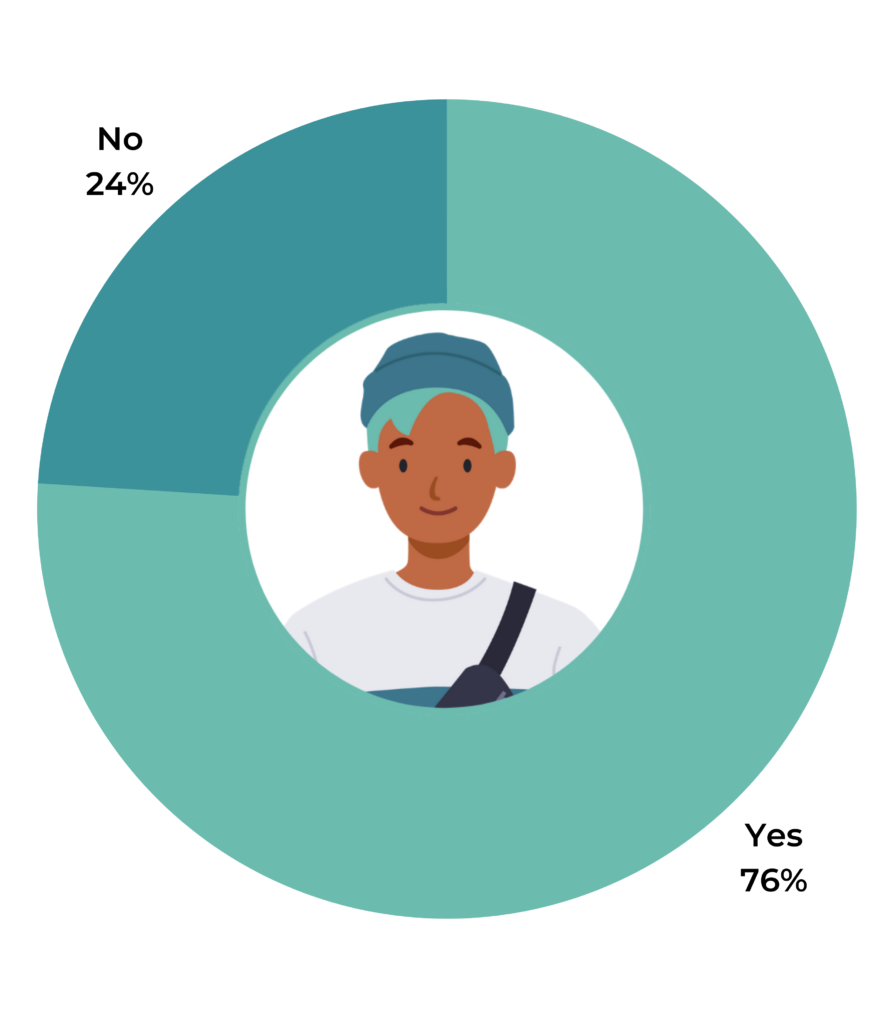
Across generations, Americans are ready to shop in-store again. There were more regional differences, however, with Midwest shoppers being the most eager to return to in-store shopping (75%) and Northeast shoppers being the least eager (67%).
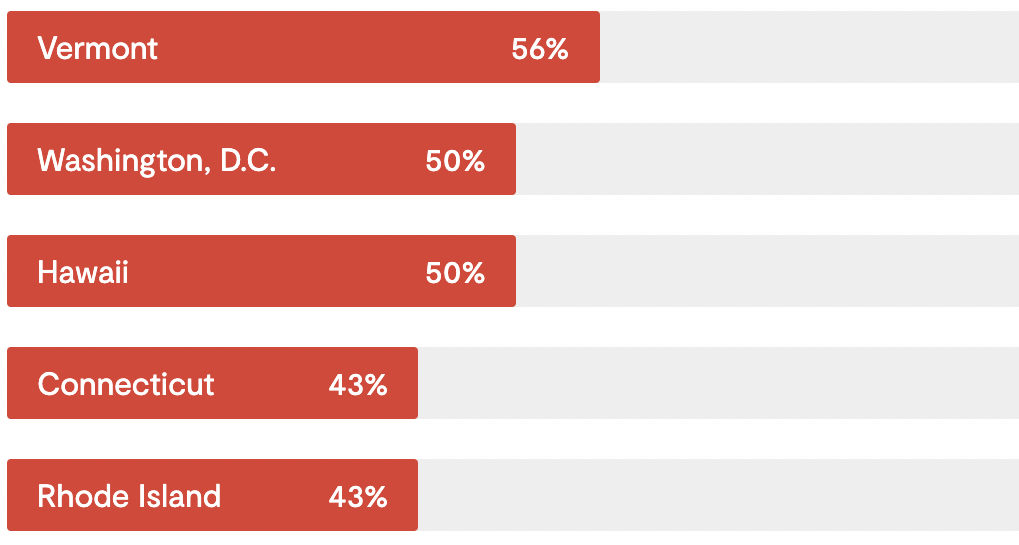
Top 5 States Most Concerned
Vermont 56%
Washington, D.C. 50%
Hawaii 50%
Connecticut 43%
Rhode Island 43%
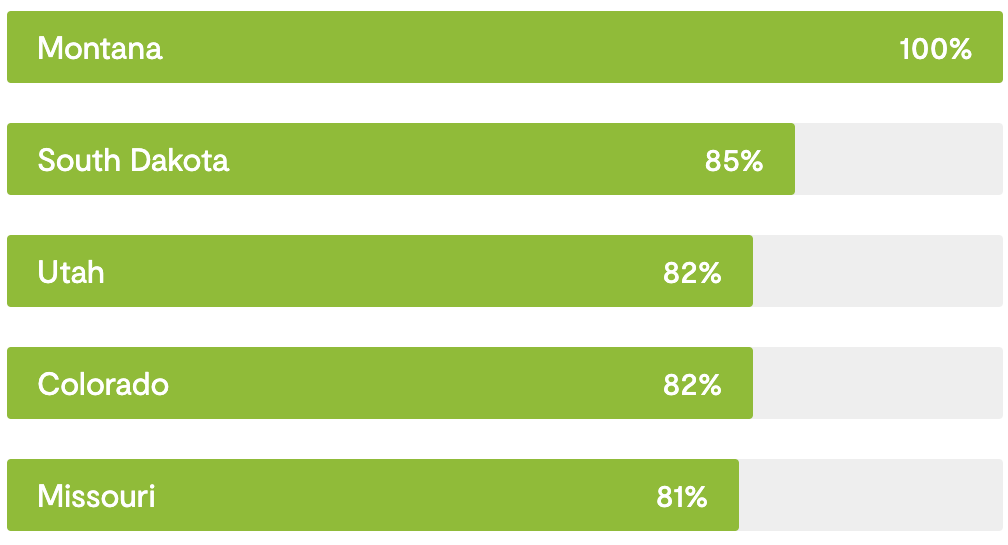
Top 5 States Least Concerned
Montana 100%
South Dakota 85%
Utah 82%
Colorado 82%
Missouri 81%

What Can Retailers Do to Make Shoppers Feel More Comfortable In-Store?

When asked what measures retailers needed to take to make them feel safe to return to shopping in store, 44% of shoppers said none are necessary (i.e. that they feel comfortable shopping in a typical pre-pandemic store environment without any safety measures).

For these shoppers, there’s nothing a retailer needs to do to convince them to return in-store – from a safety perspective at least. However, that still means over half (56%) of your customers would prefer you take at least some measures to ensure their safety and comfort. 

What are those measures, exactly? The top three most requested measures include frequent sterilization of store premises, curbside pickup, and associates wearing masks.

We asked consumers about these same measures in our Holiday Survey from September 2020. Across the board, all of these measures are less critical to consumers today. The biggest changes were in regards to measures for other customers. Today, only 25% of consumers still want retailers to restrict the number of customers in-store, a drop of 55% from last year’s survey.  And only 38% expect other customers to be required to wear masks, a drop of 43% from last year’s survey.
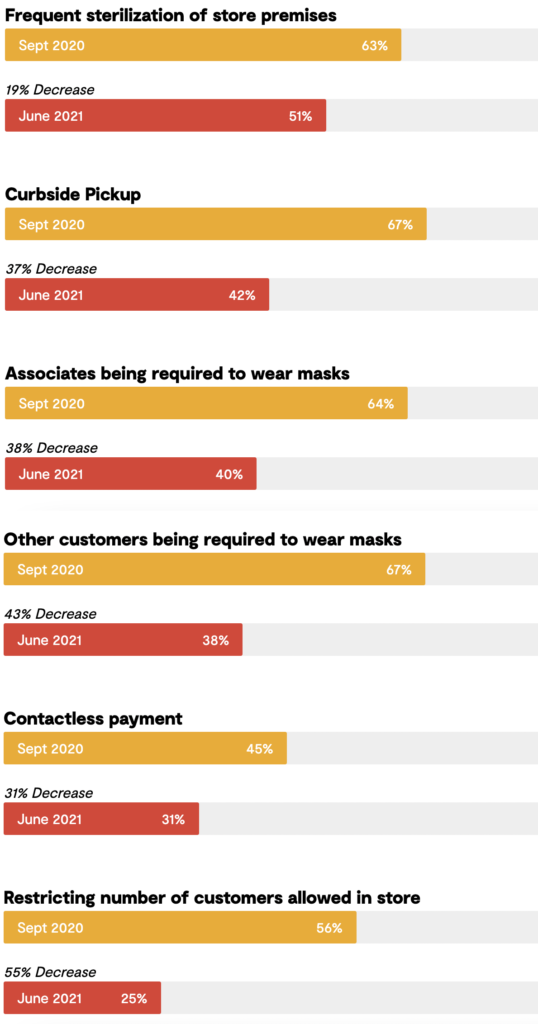
COVID-19 Safety Measures Are Less Critical to Consumers Today
Frequent sterilization of store premises
Sept 2020 63%
19% Decrease
June 2021 51%
Curbside Pickup
Sept 2020 67%
37% Decrease
June 2021 42%
Associates being required to wear masks
Sept 2020 64%
38% Decrease
June 2021 40%
Other customers being required to wear masks
Sept 2020 67%
43% Decrease
June 2021 38%
Contactless payment
Sept 2020 45%
31% Decrease
June 2021 31%
Restricting number of customers allowed in store at any one time
Sept 2020 56%
55% Decrease
June 2021 25%

In-Store Shopping Preferences by Generation

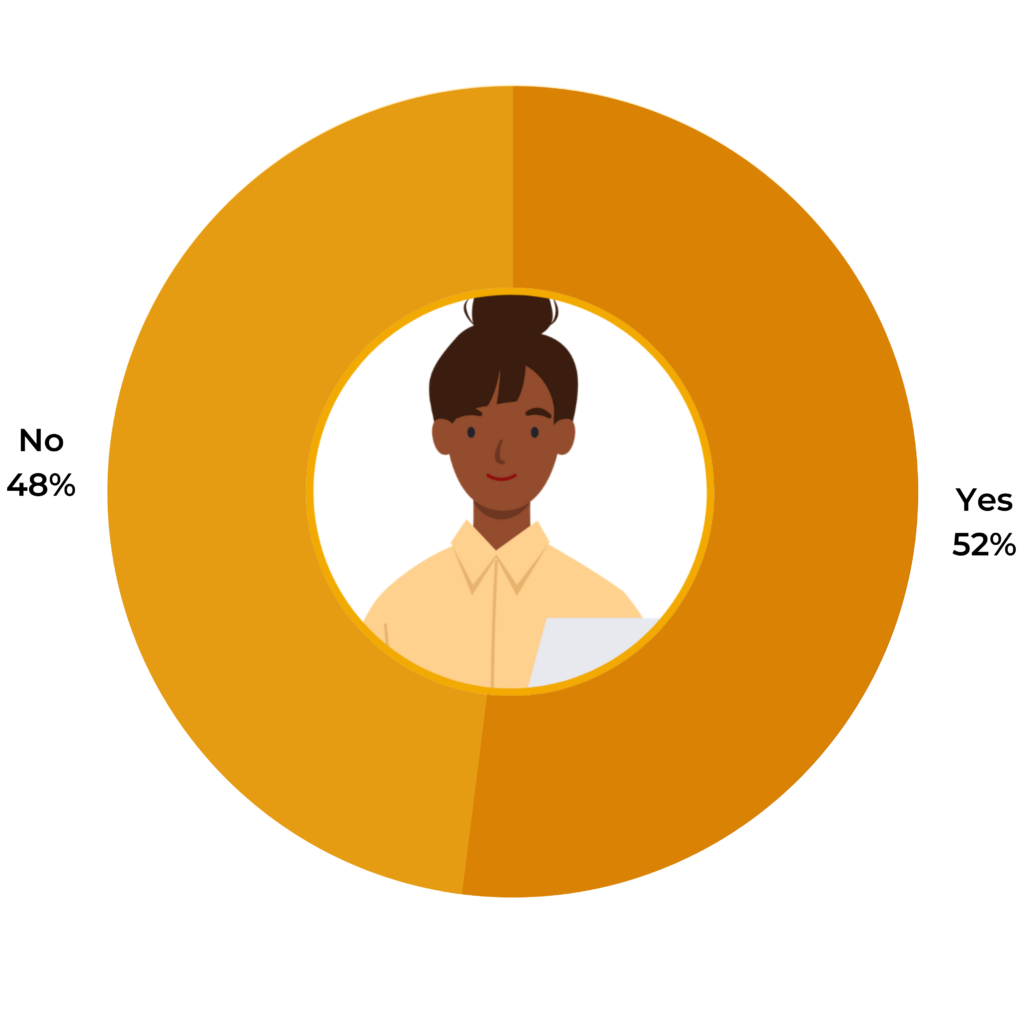
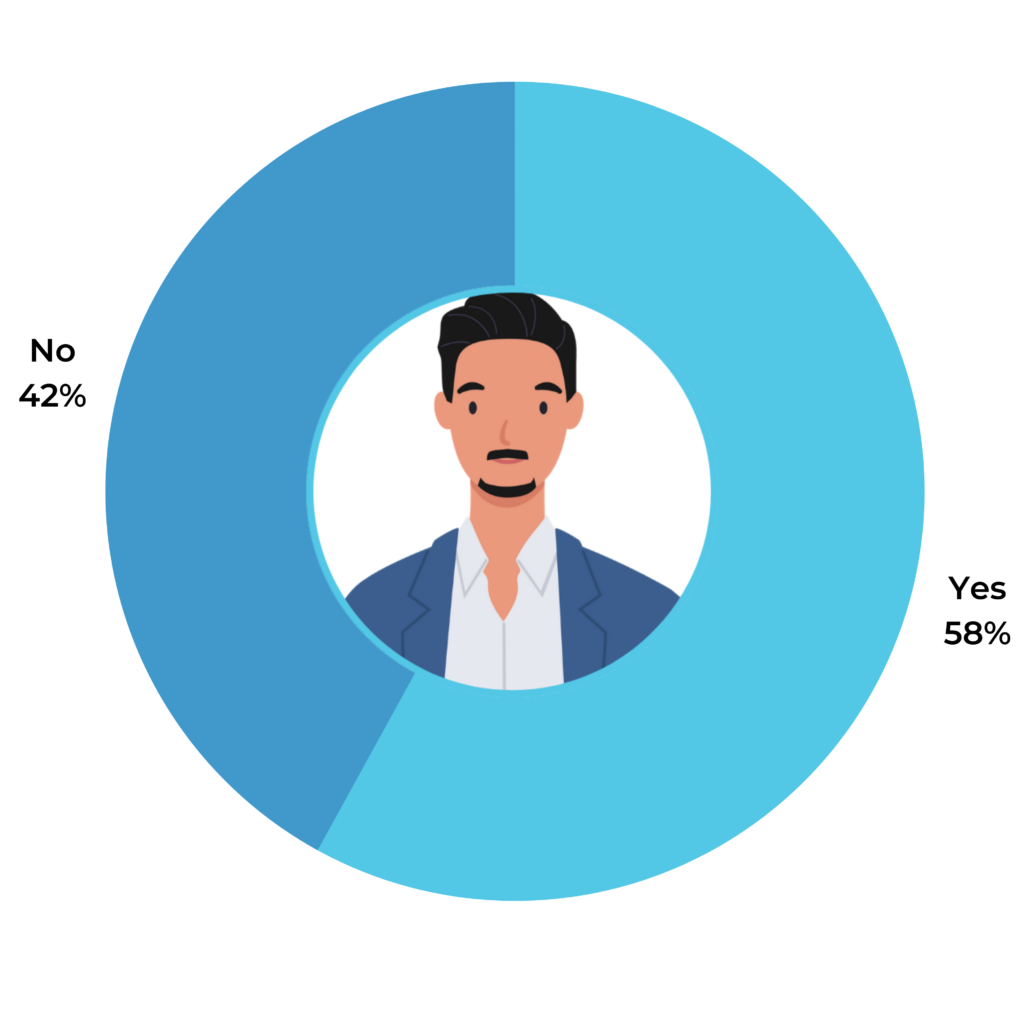
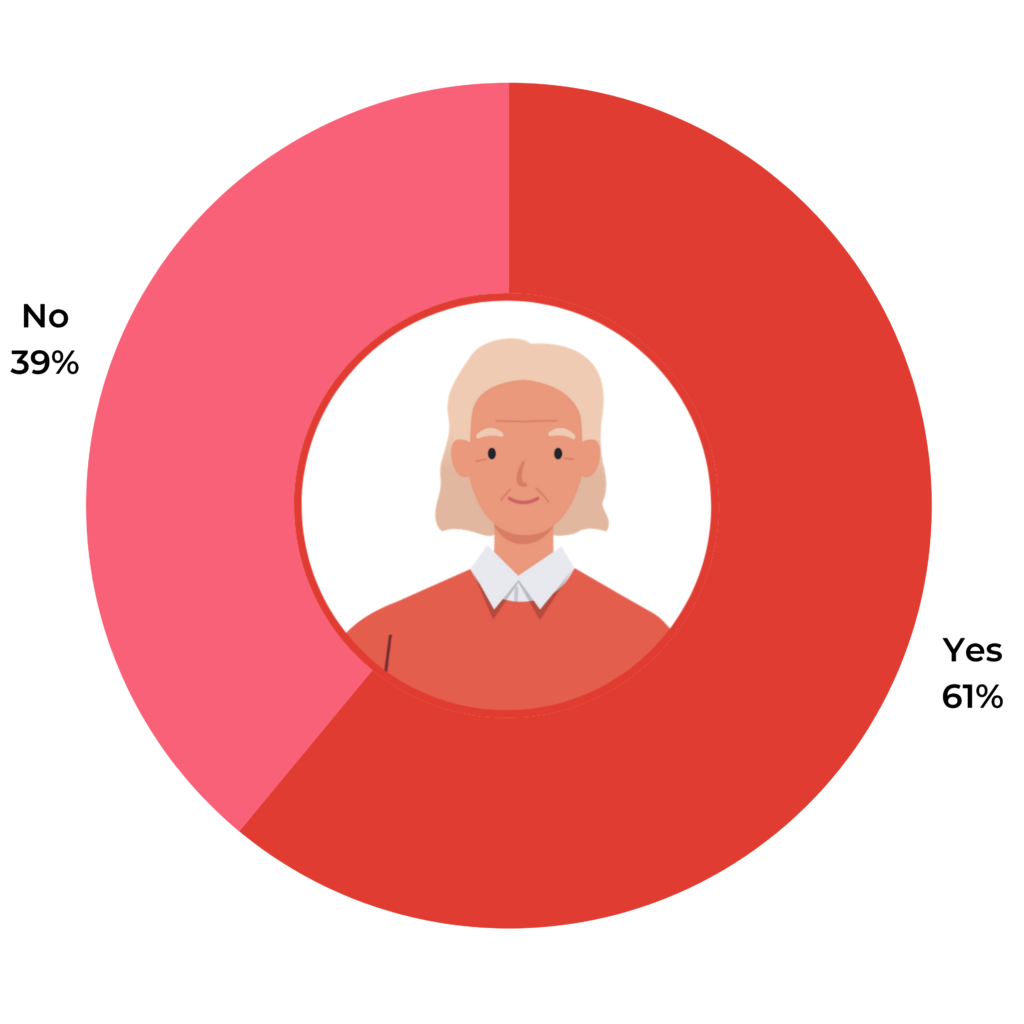
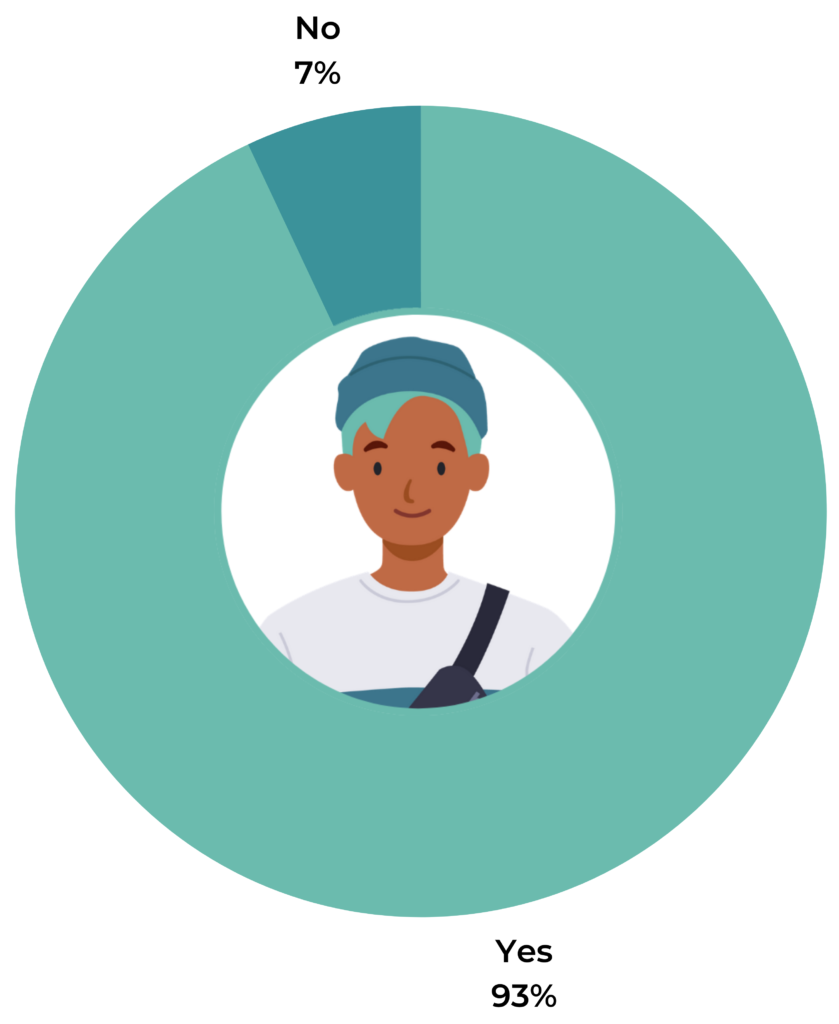
At 47%, Gen Xers were the most likely to say they feel completely safe returning to in-store shopping, while Boomers, at 41%, were the least likely.
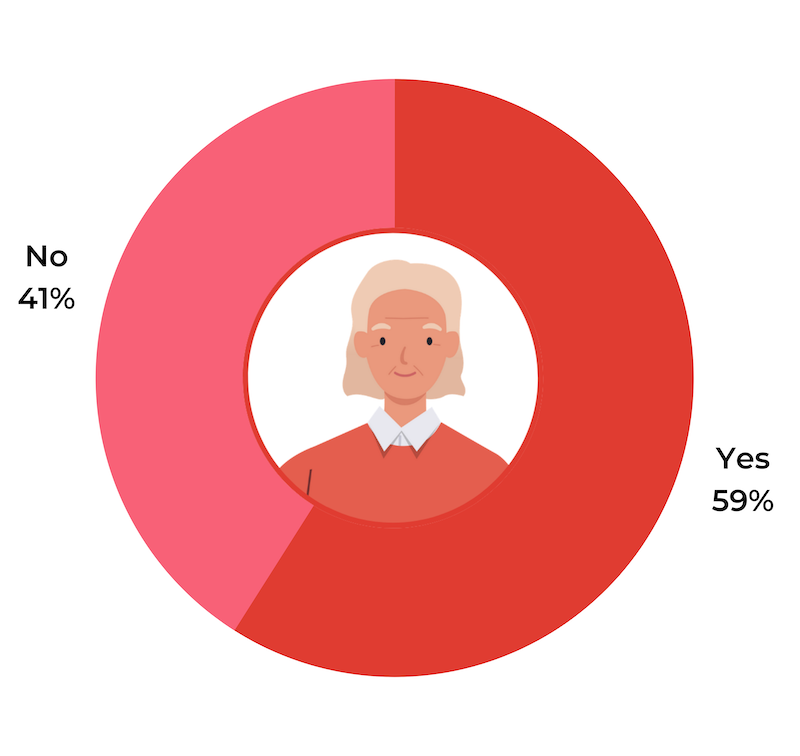
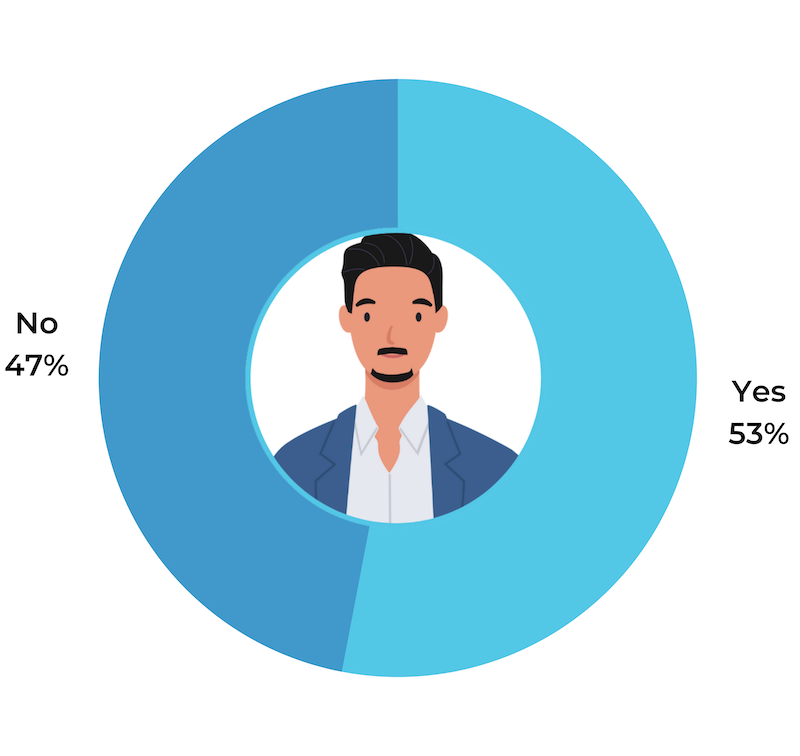
Generational Preferences for Safety Measures
Are some safety measures necessary for you to shop in-store?
Boomers
Gen X
Millennials
Gen Z

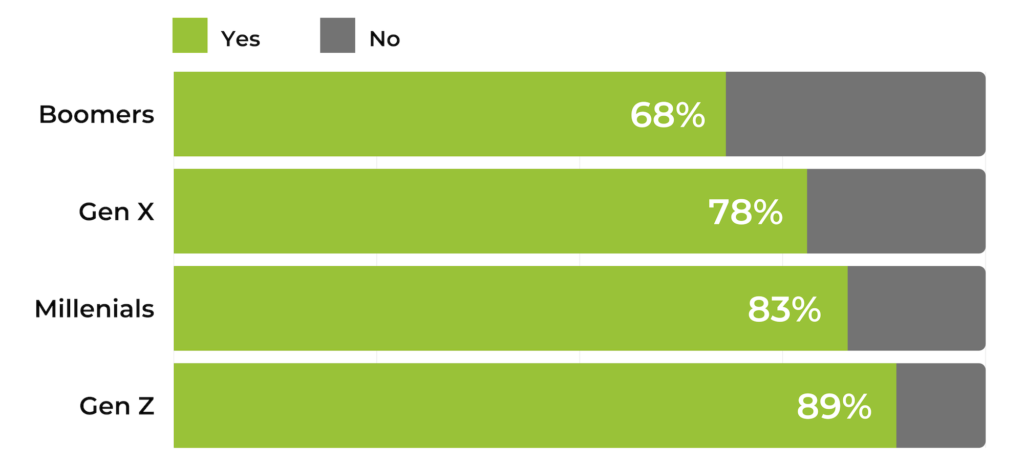
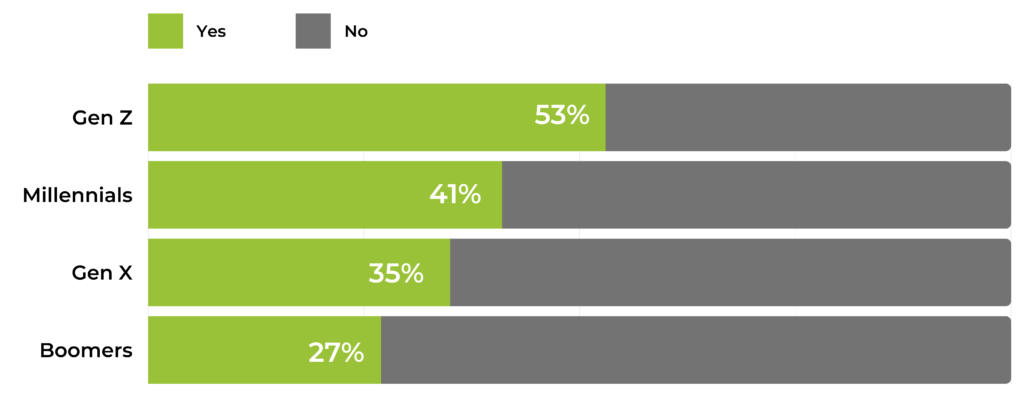
There’s a clear trend between consumer age and prefered safety measures, with younger consumers expressing a stronger interest in contact-free pickup options like Curbside Pickup and Buy Online Pickup in Store (BOPIS). For example, Millennials were 42% more likely to express interest in curbside pickup than Boomers, and more than 50% likely (53%) to express interest in BOPIS than Boomers.

Younger Consumers Have a Stronger Preference for Curbside Pickup & BOPIS
Curbside Pickup
Boomers 33%
Gen X 38%
Millennials 47%
Gen Z 42%
Overall 42%
BOPIS
Boomers 25%
Gen X 28%
Millennials 37%
Gen Z 36%
Overall 33%

Mask Up, Say Gen Z Consumers

Across generations, Gen Zers were most in favor of mask wearing, by both store associates and other customers. Gen Xers, on the other hand, were the least concerned about masks. Over 50% of Gen Zers want other customers to keep their masks on, making them 34% more likely than the overall average and 50% more likely than Gen Xers. Nearly half (48%) of Gen Zers would also like store associates to wear masks.
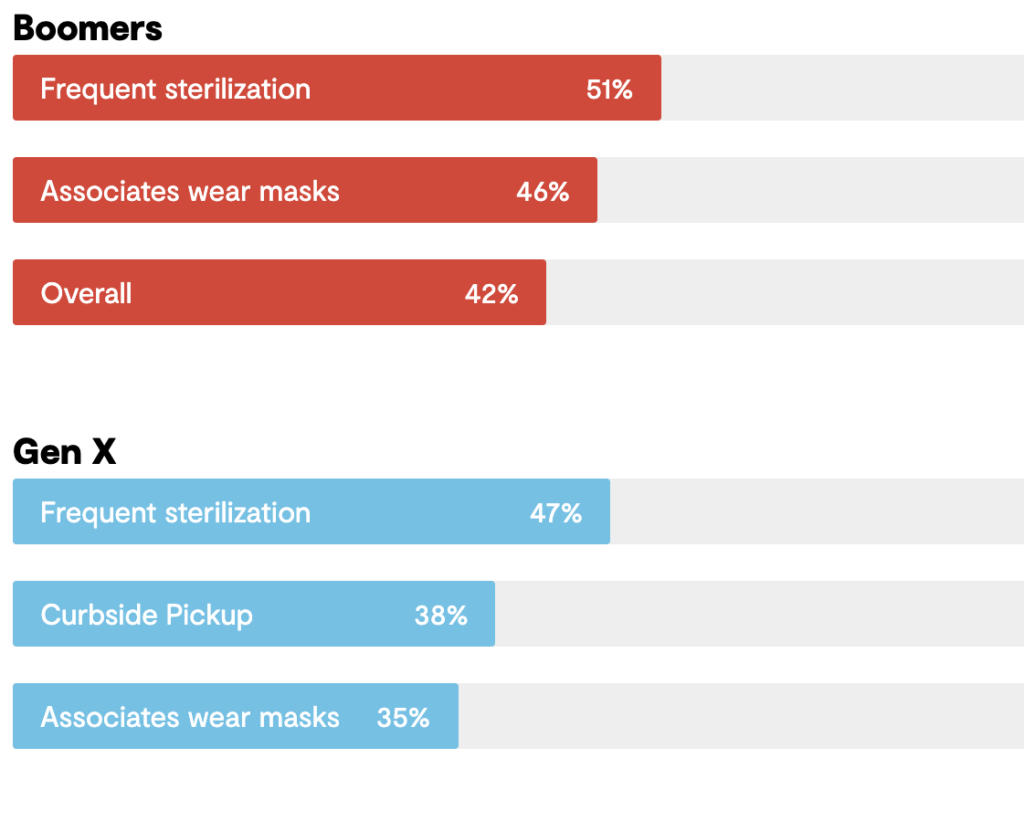
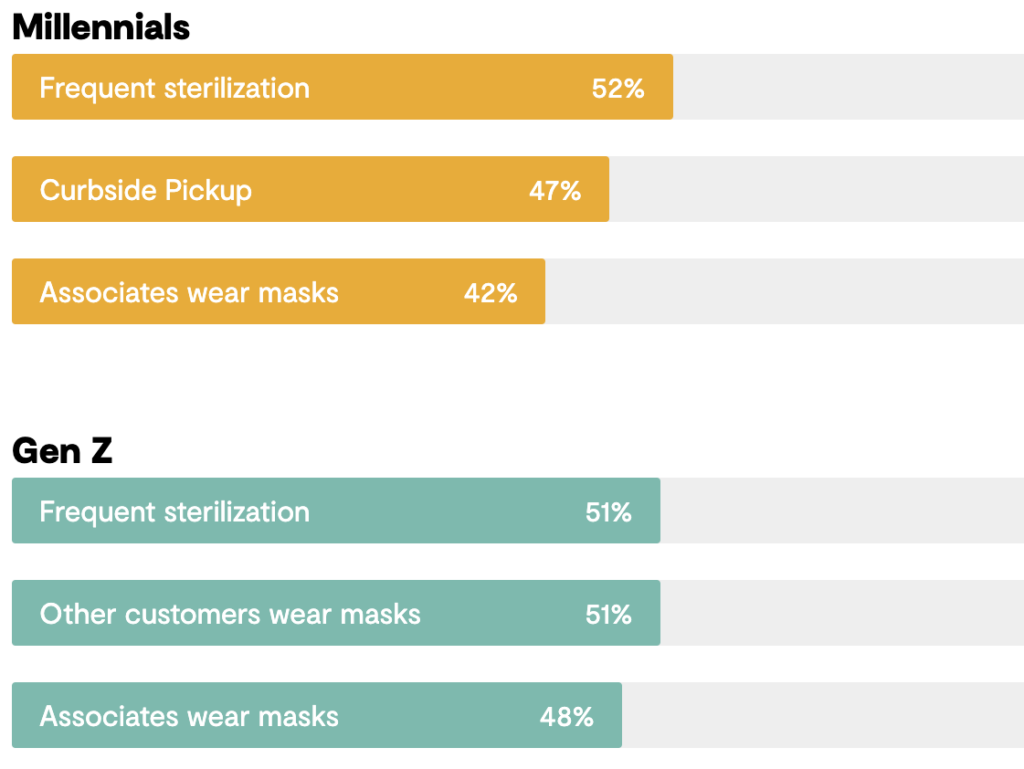
Most Requested In-Store Safety Measures by Generation
Boomers
Frequent sterilization 51%
Associates wear masks 46%
Overall 42%
Gen X
Frequent sterilization 47%
Curbside Pickup 38%
Associates wear masks 35%
Millennials
Frequent sterilization 52%
Curbside Pickup 47%
Associates wear masks 42%
Gen Z
Frequent sterilization 51%
Other customers wear masks 51%
Associates wear masks 48%

Contactless Payment a Hit With Millennials

Millennials were the biggest fans of contactless payment options, with 33% expressing interest, compared with 29% of Gen Xers, 29% of Boomers, and only 24% of Gen Zers. 

However, it is important to note that the preference for contactless payment may be a reflection of the overall shift towards convenient, frictionless, tech-enabled retail solutions. The safety concerns of the pandemic may have simply accelerated this trend.

Consumer Demand for BOPIS and Curbside Pickup Continues to Increase

What else can retailers do to bring shoppers back in-store? Offer flexible, convenient pickup options. 

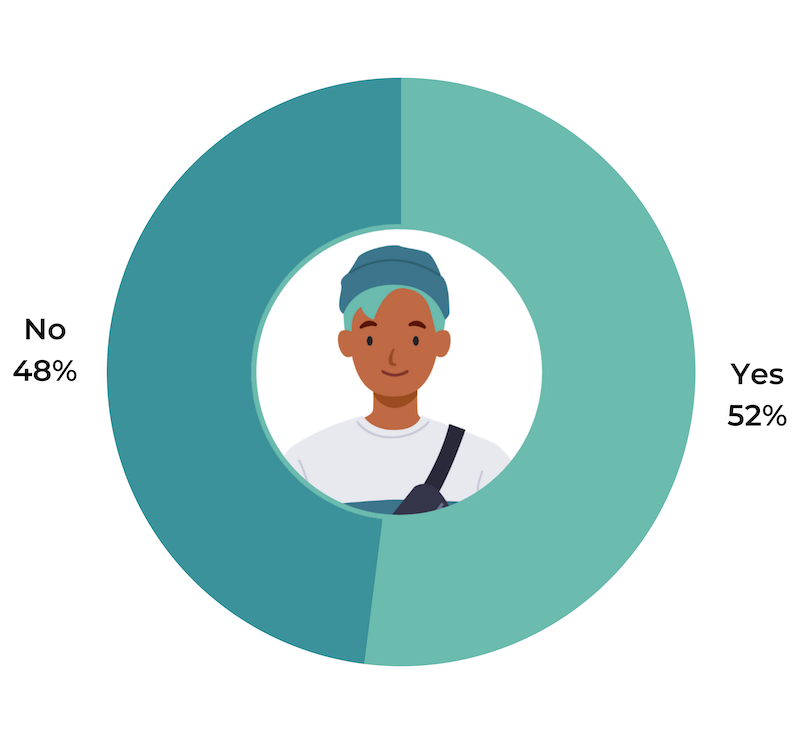
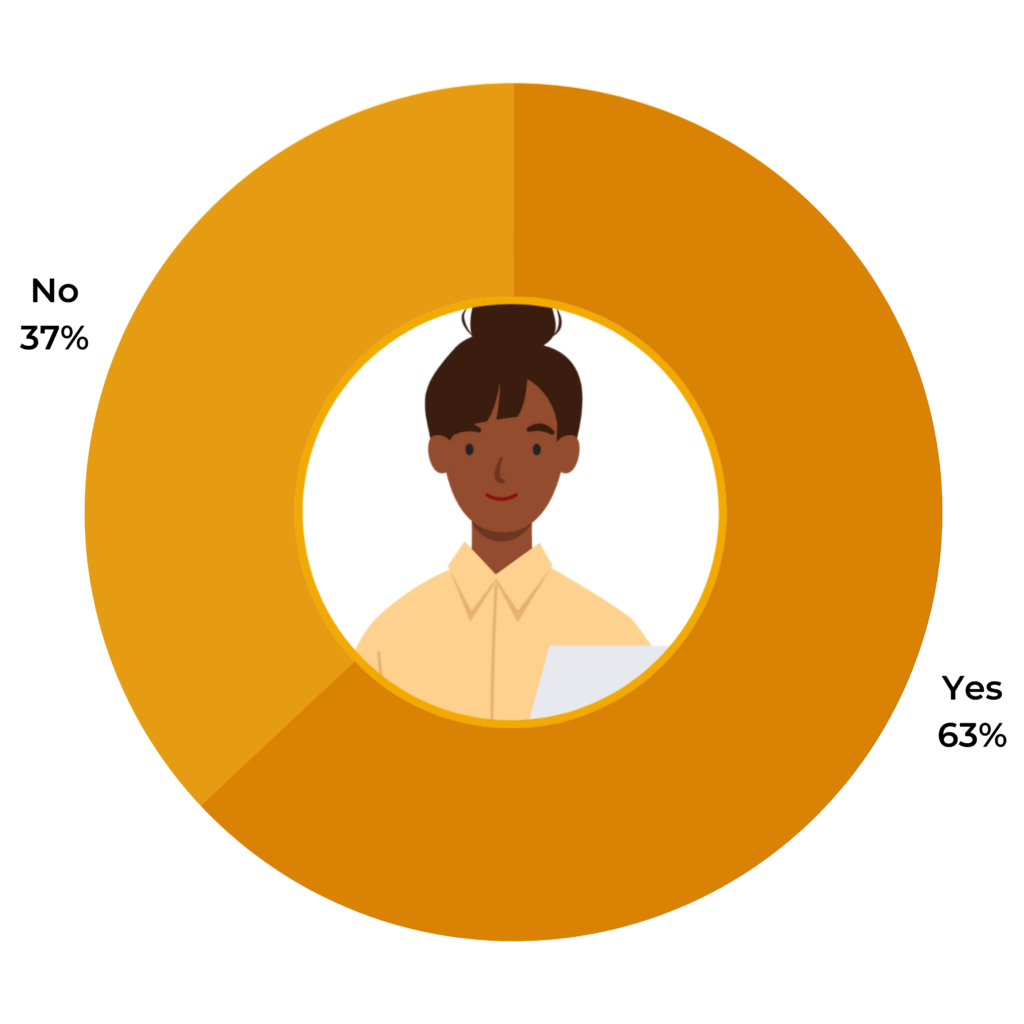
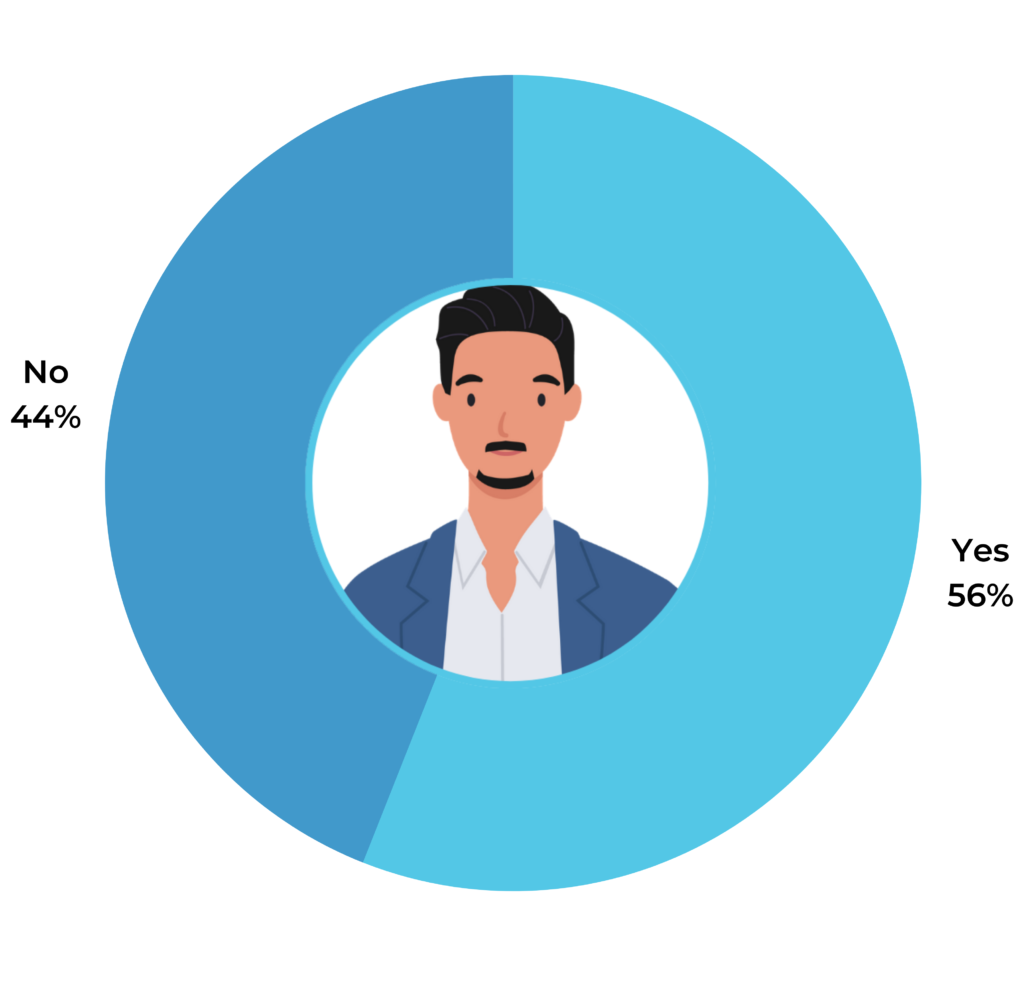
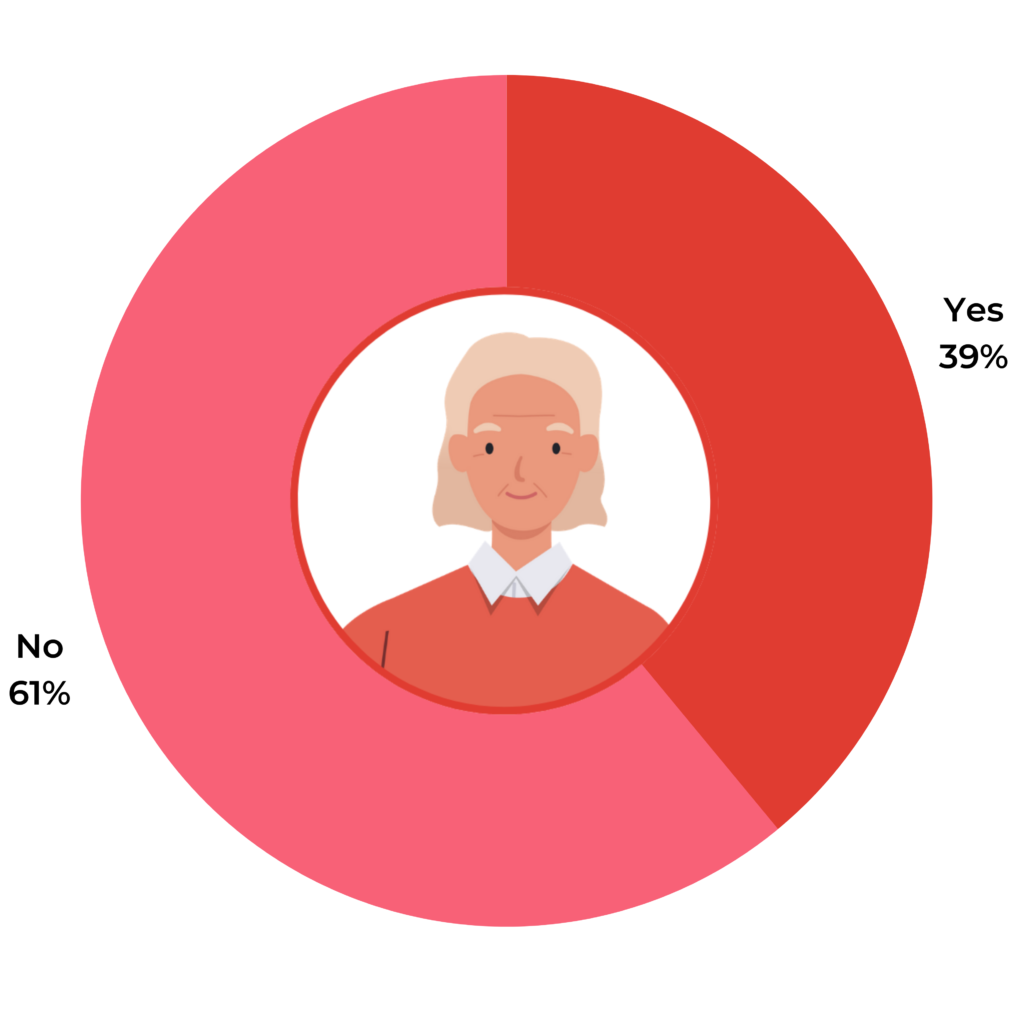
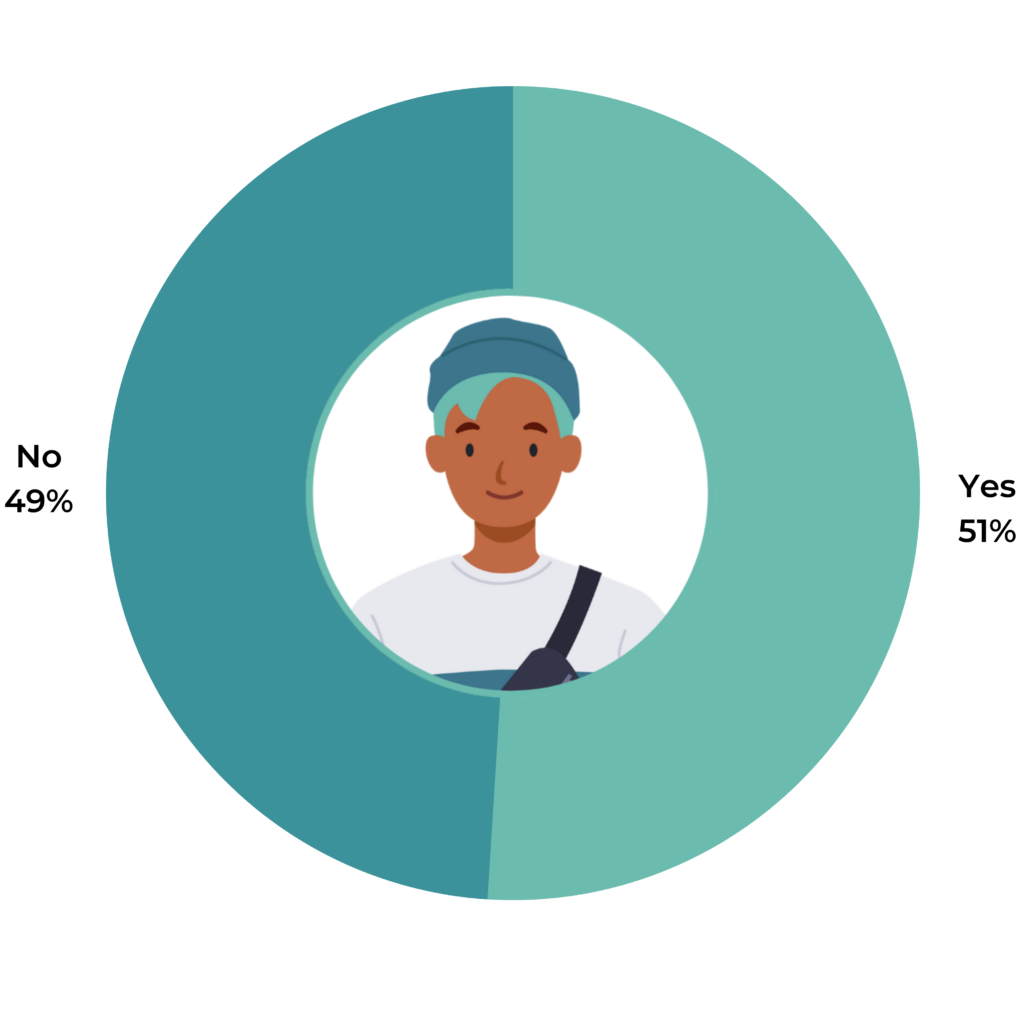
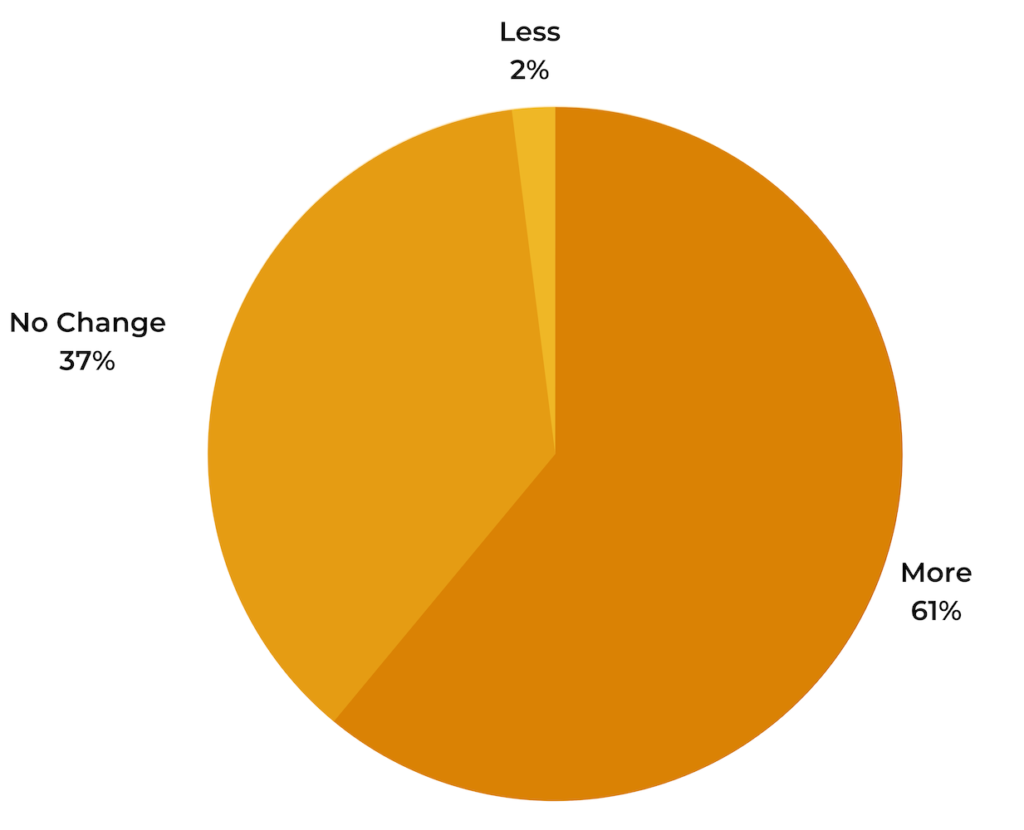
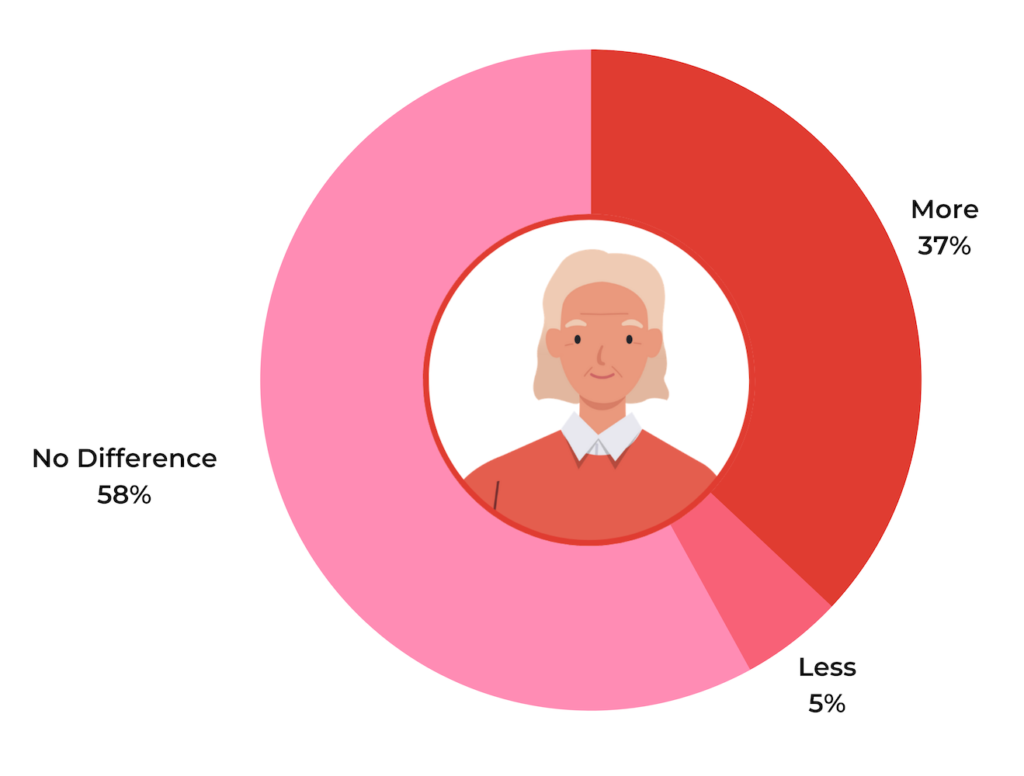
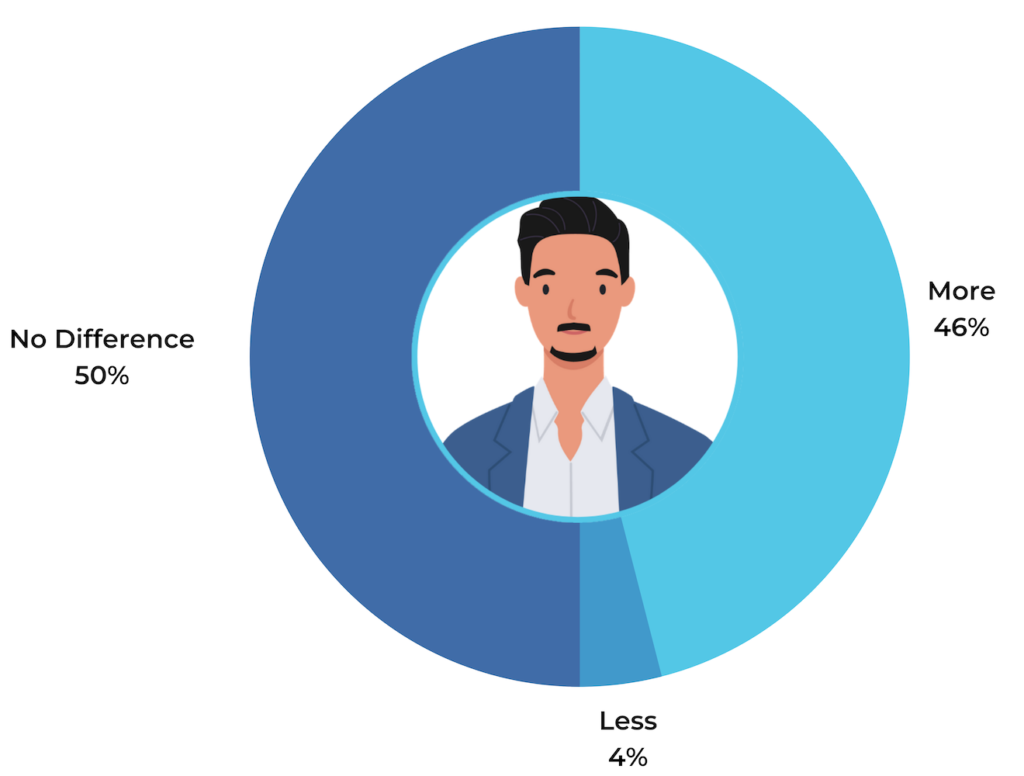
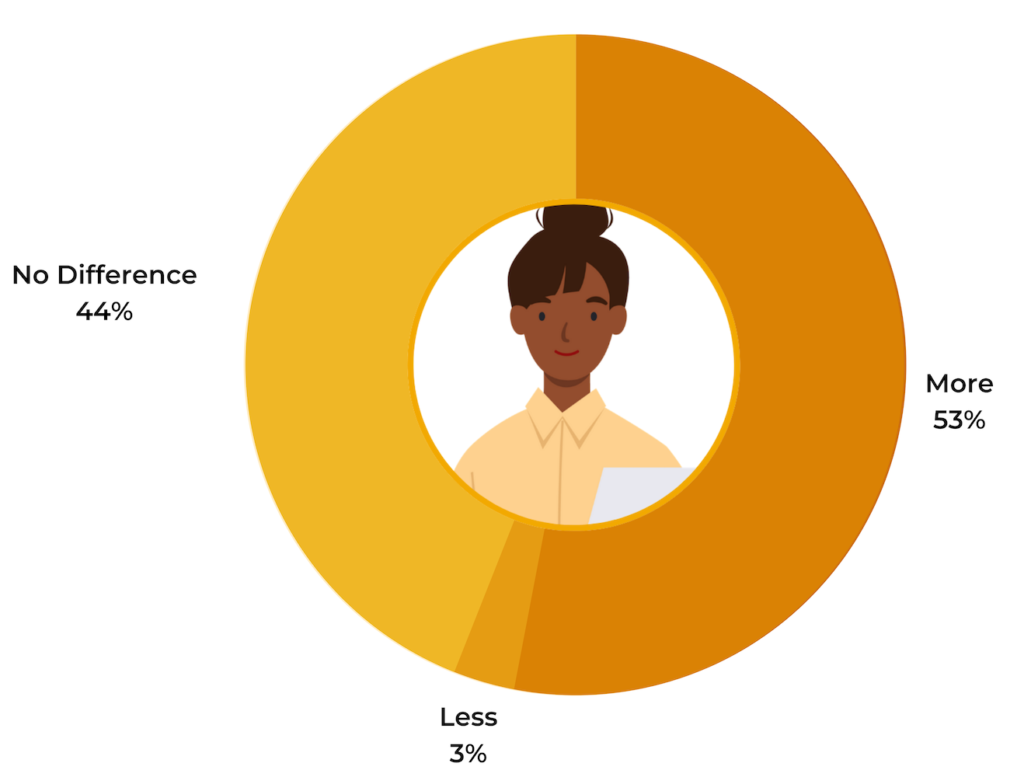
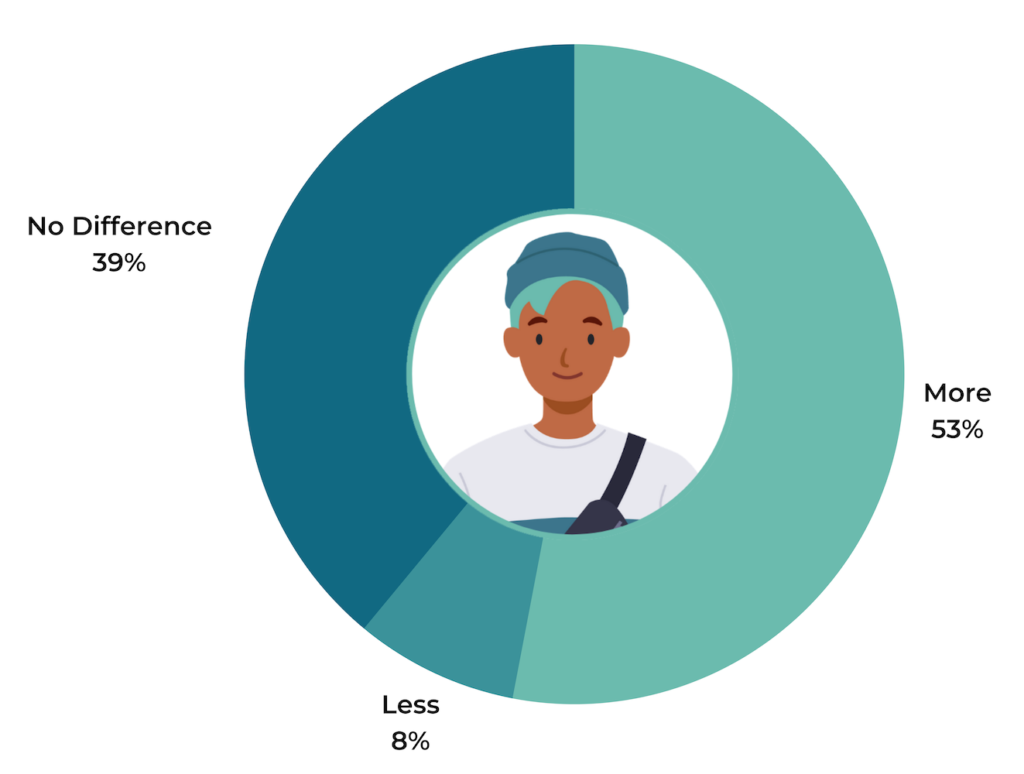
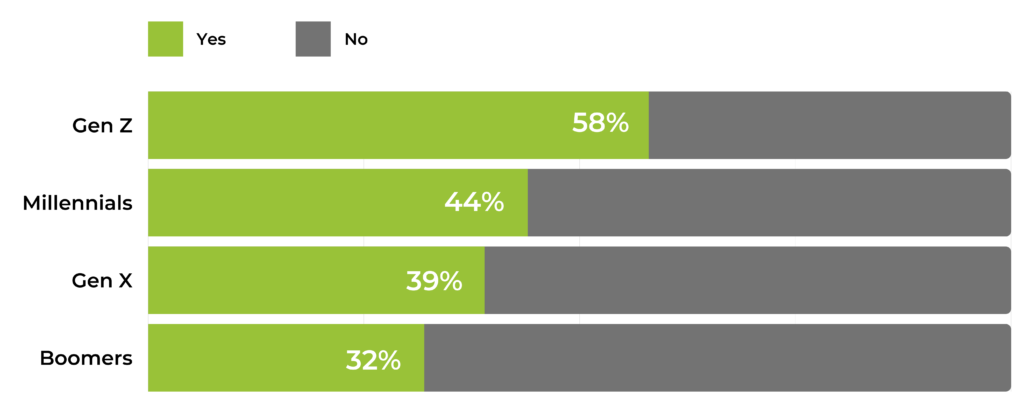
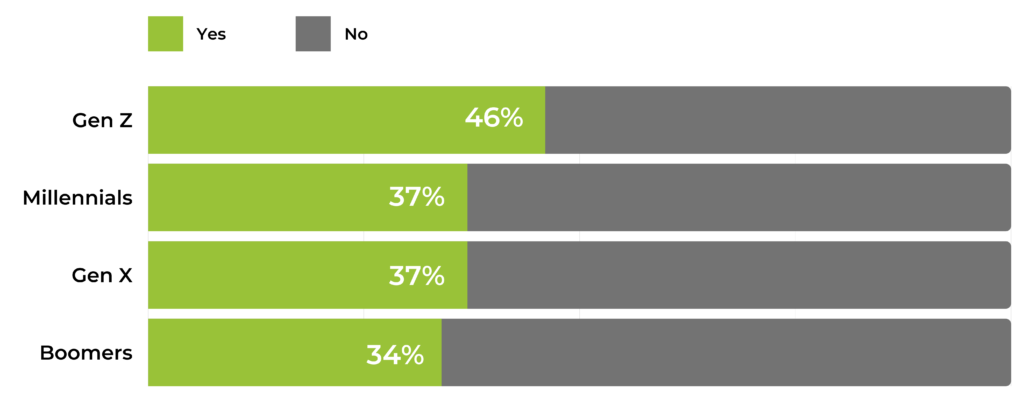
A clear majority of shoppers said that services like BOPIS (buy online, pickup in store) and curbside pickup made them more likely to visit a store.
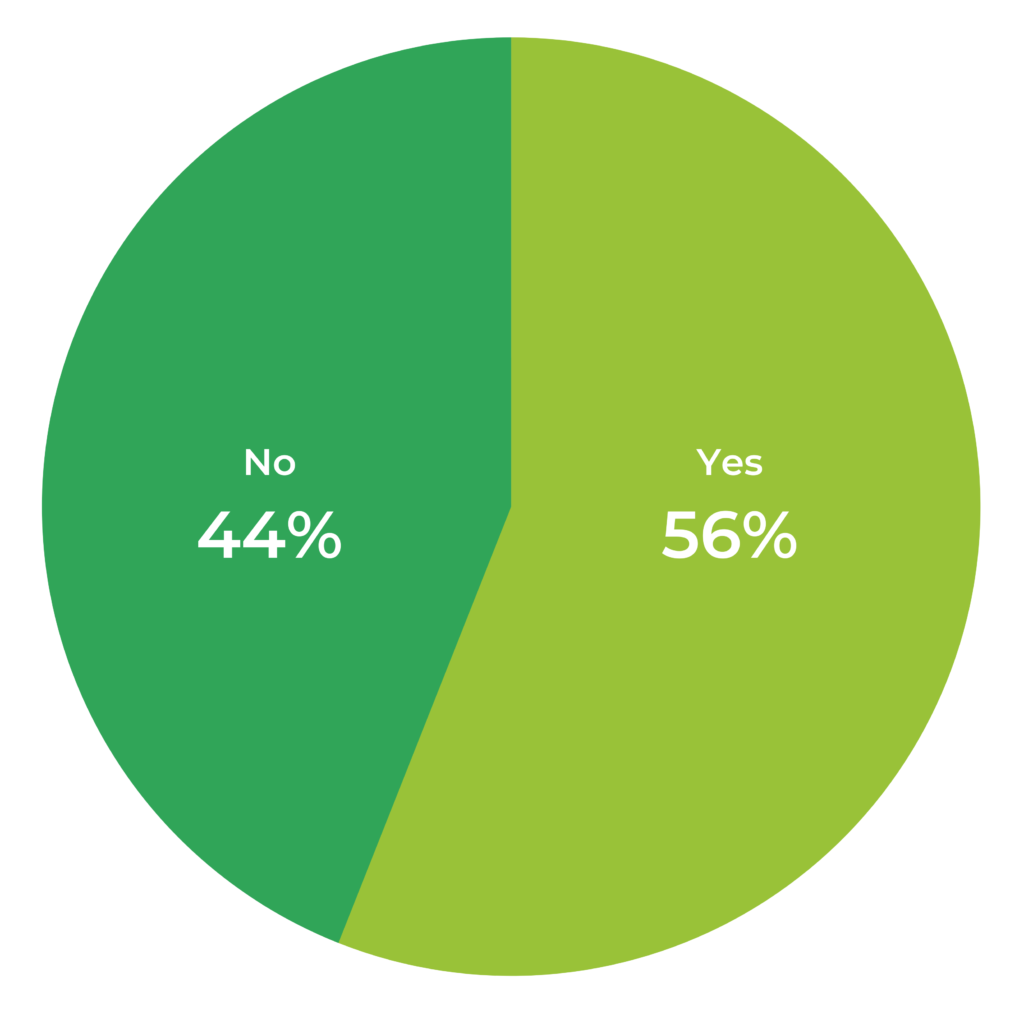
Consumer Demand for BOPIS and Curbside Pickup On the Rise
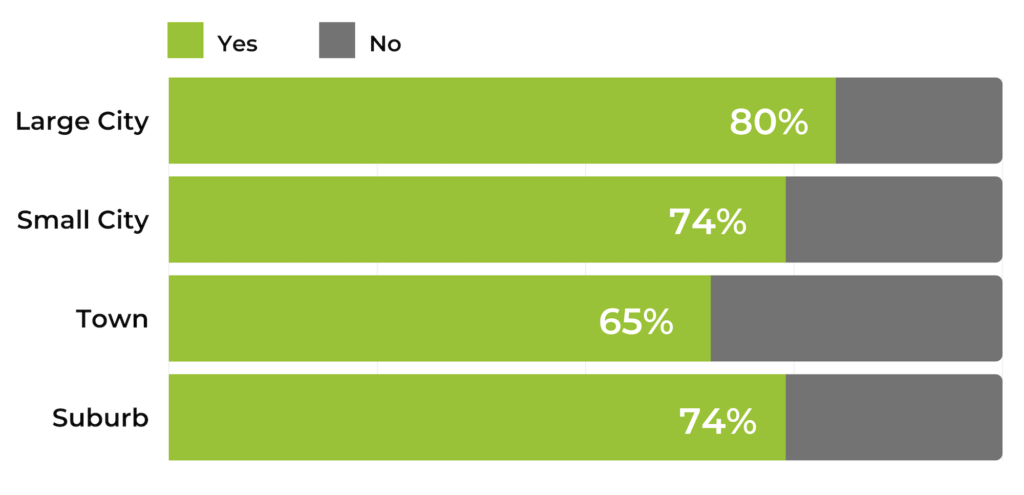
Do services such as BOPIS or Curbside Pickup make you more likely to visit a store?

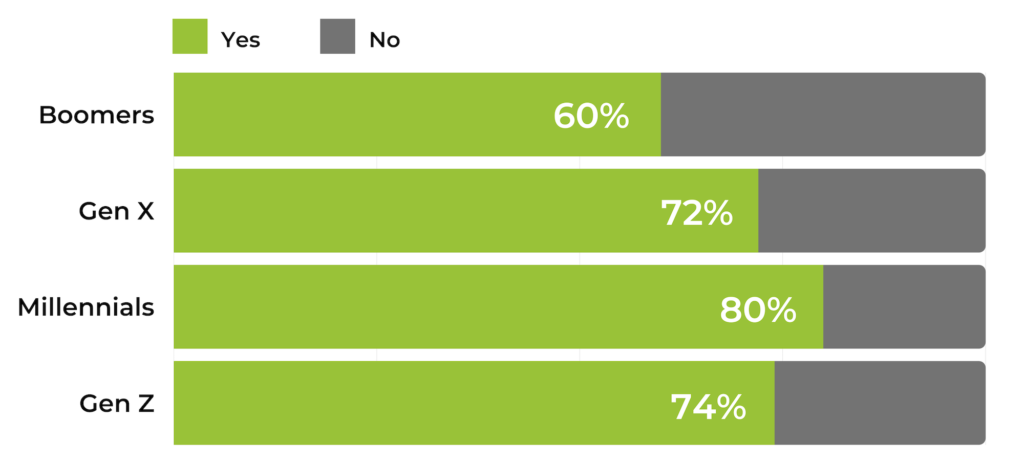
As we mentioned earlier, BOPIS and Curbside Pickup had the greatest pull for Millennials, with two in three (63%) of these shoppers expressing interest in these services, compared with only 39% of Boomers. However, considering that Millennials and Gen Z are poised to represent the majority of consumers in the very near future, retailers should take appropriate steps now to ensure they’re offering the services these shoppers demand.
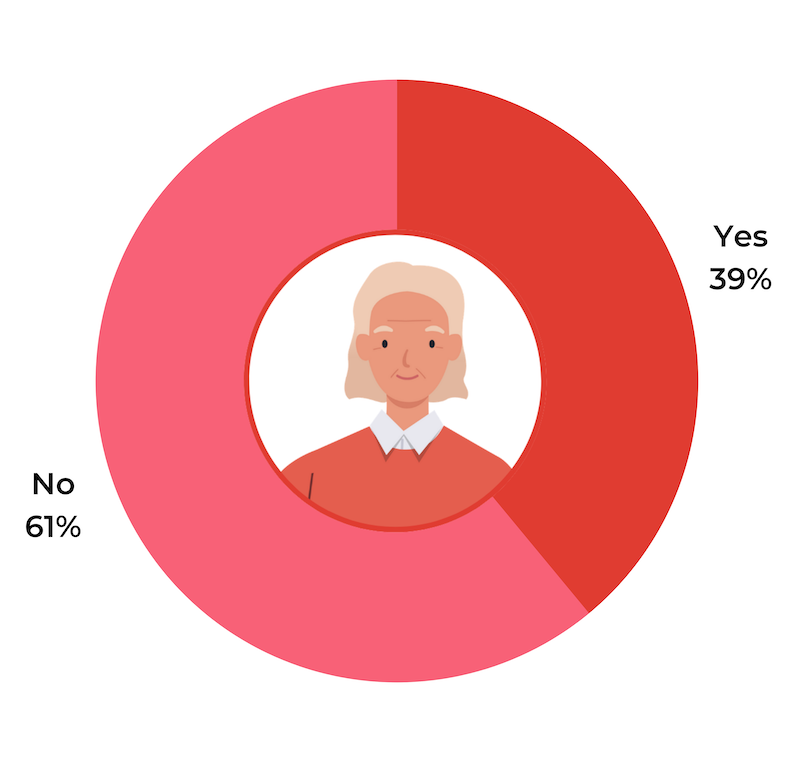
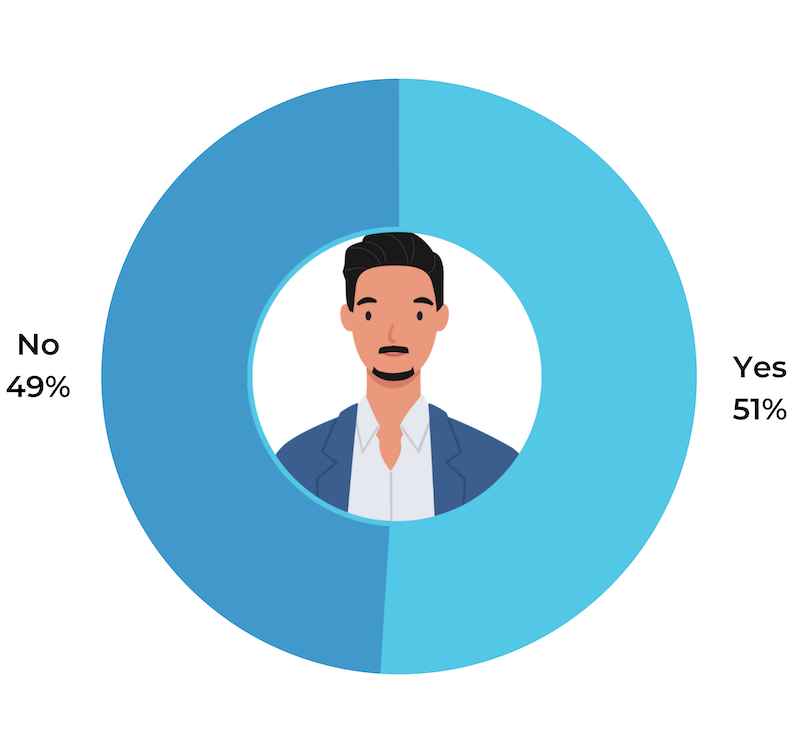
Demand for BOPIS and Curbside Pickup (By Generation)
Do services such as BOPIS or Curbside Pickup make you more likely to visit a store?
Boomers
Gen X
Millennials
Gen Z

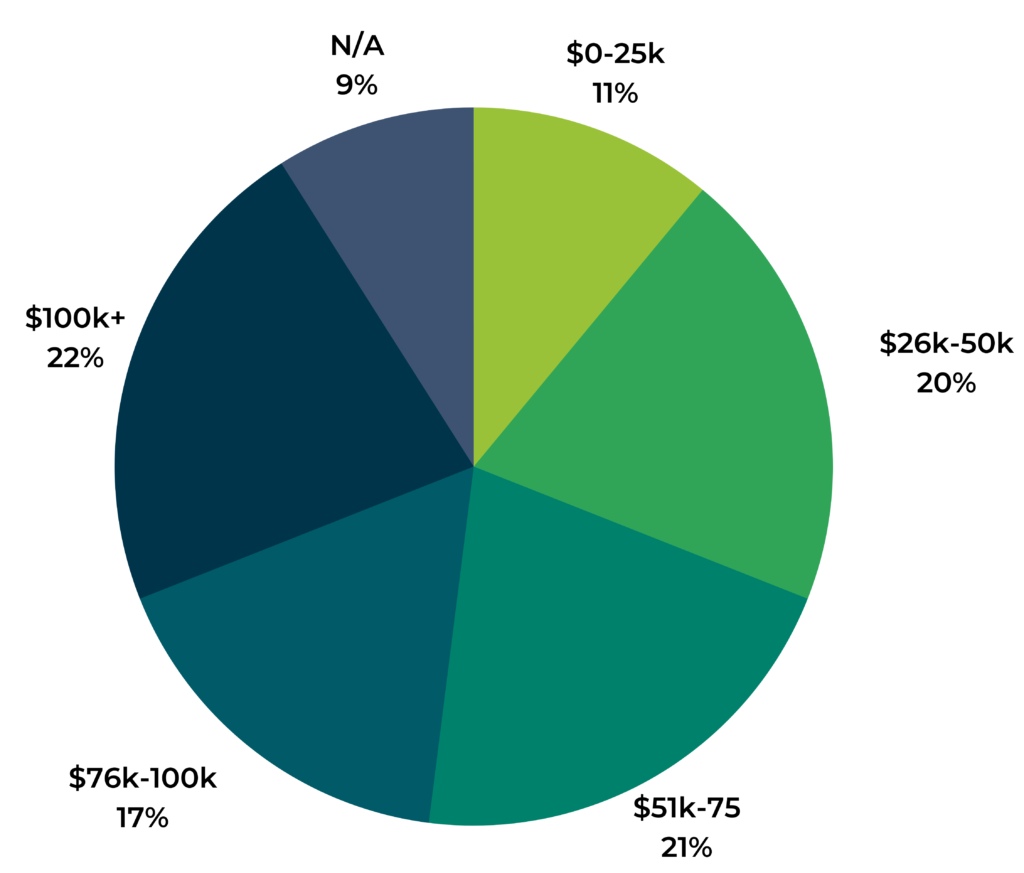
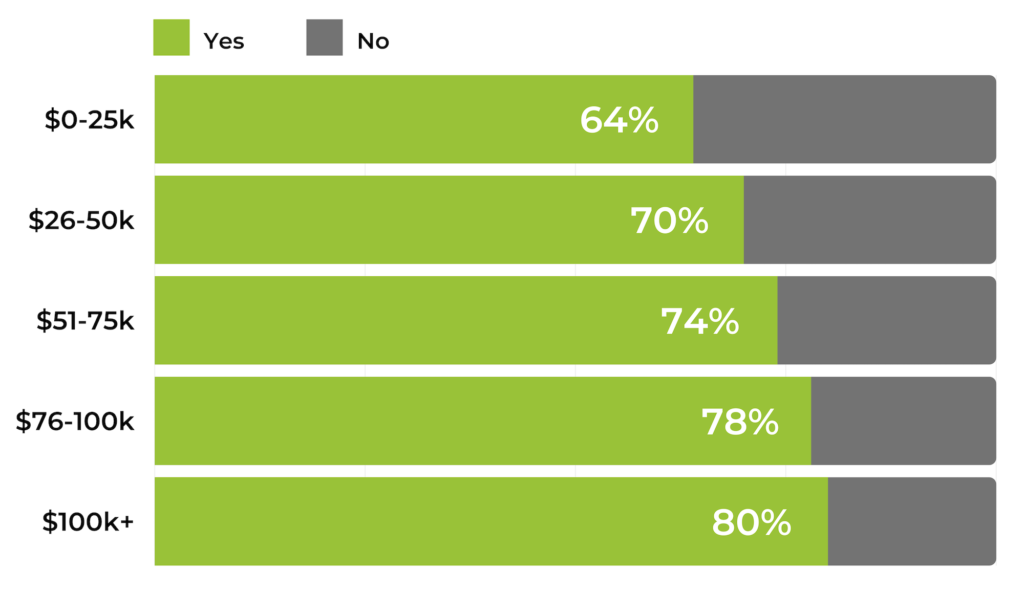
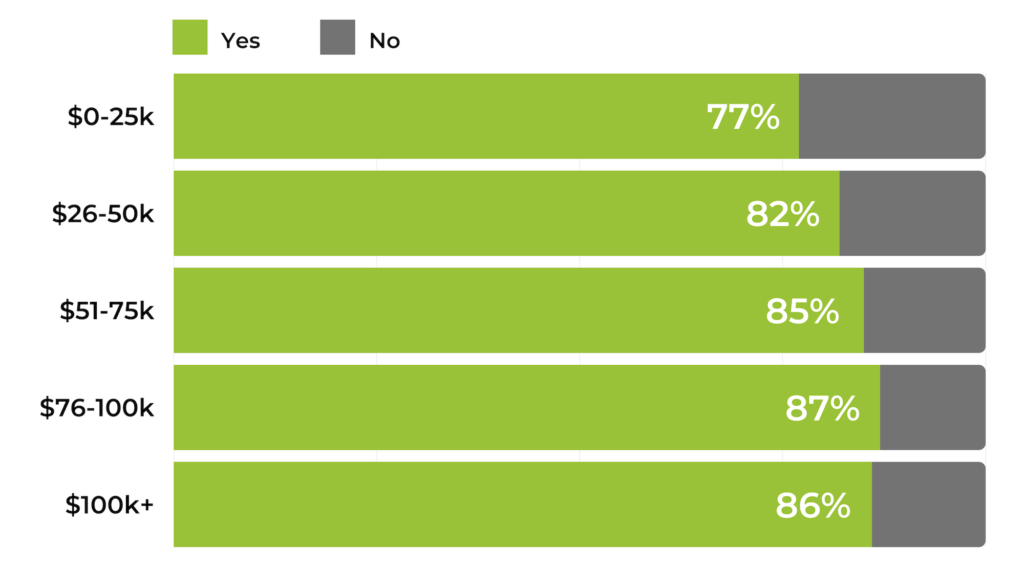
BOPIS and Curbside Pickup services were also more attractive to higher income shoppers, with 63% of those making $100K or more saying it would make them more likely to visit a store, compared with only 49% of those making $25K or less. 

Providing a Positive In-Store Experience: The Stakes Are High

What’s at stake if you don’t provide a positive in-store shopping experience? Losing a customer.

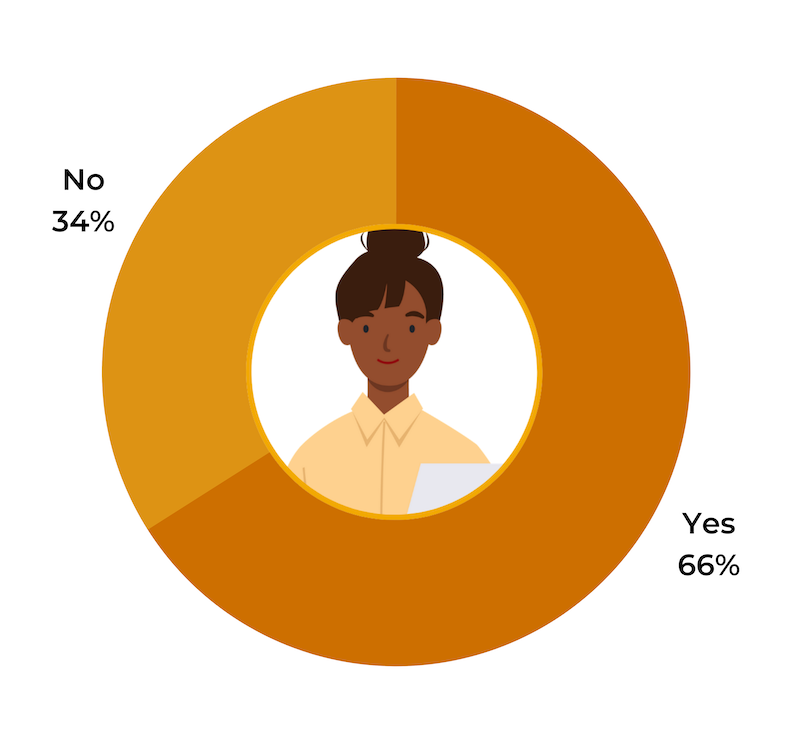
Overall, 64% of consumers said a negative in-store experience was enough to stop them shopping with a retailer again.
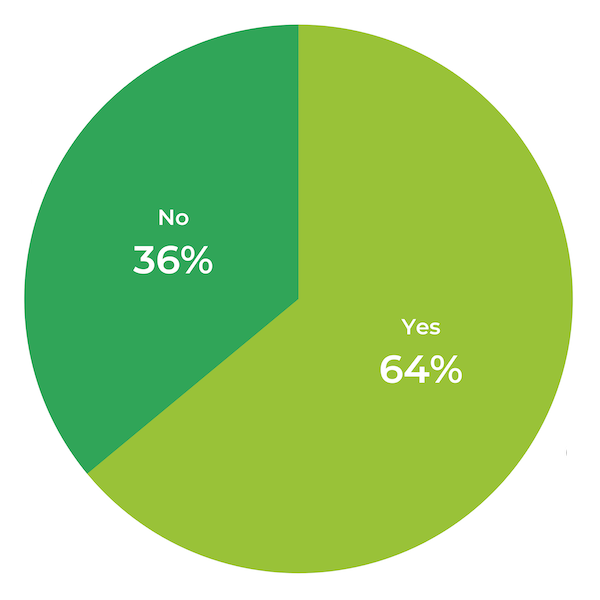
Impact of Negative Experiences on Future Shopping
Has a negative in-store shopping experience ever prevented you from shopping with that retailer again in the future?

Millennials and higher-income shoppers were the most likely to stop shopping at a retailer altogether  if they had a negative in-store experience.

At 66%, Millennials were the most likely to stop shopping at a retailer in the future if they had a negative in-store experience, followed by Gen Xers at 64%.
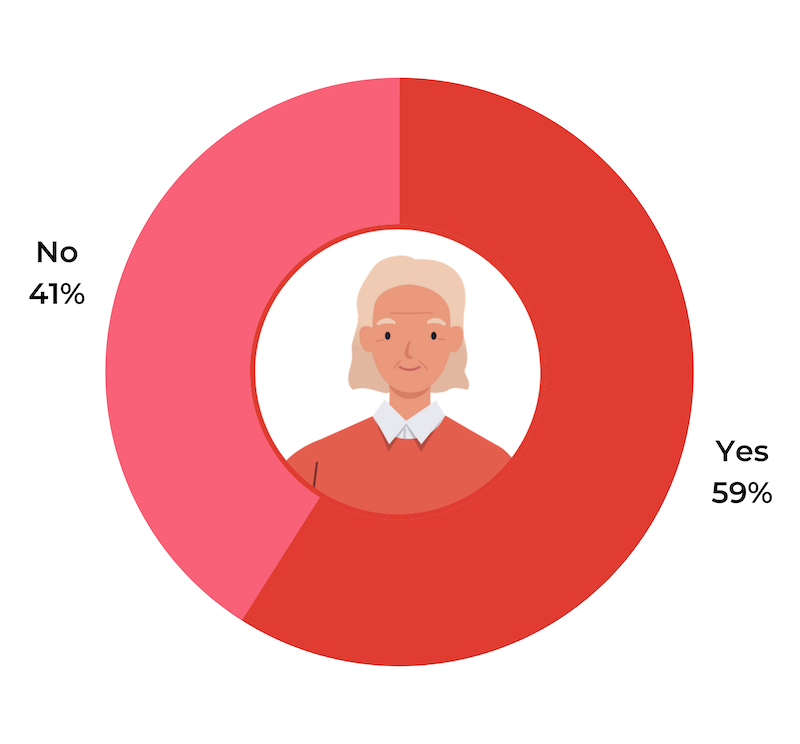
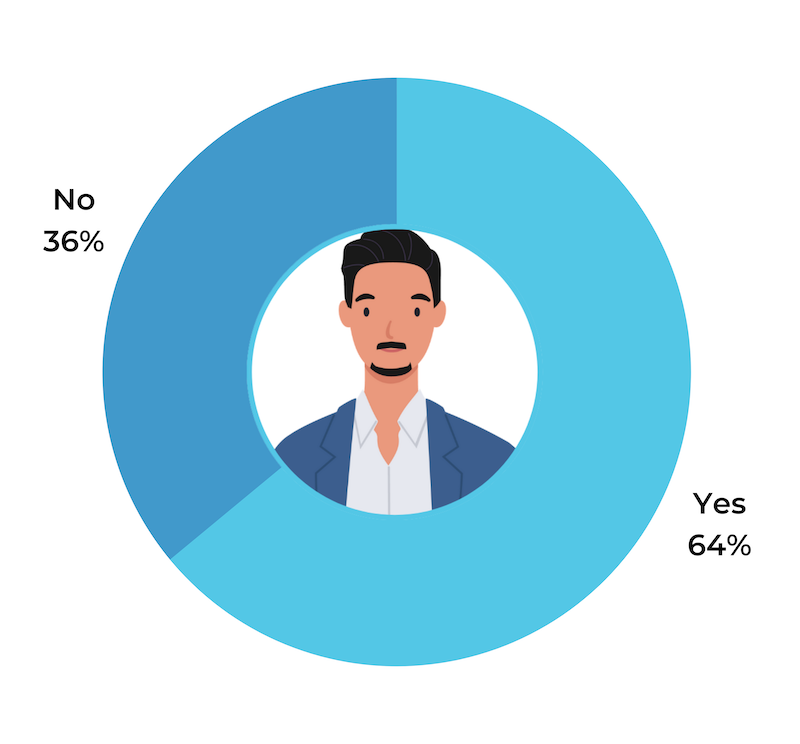
Impact of Negative Experiences on Future Shopping (By Generation)
Has a negative in-store shopping experience ever prevented you from shopping with that retailer again in the future?
Boomers
Gen X
Millennials
Gen Z

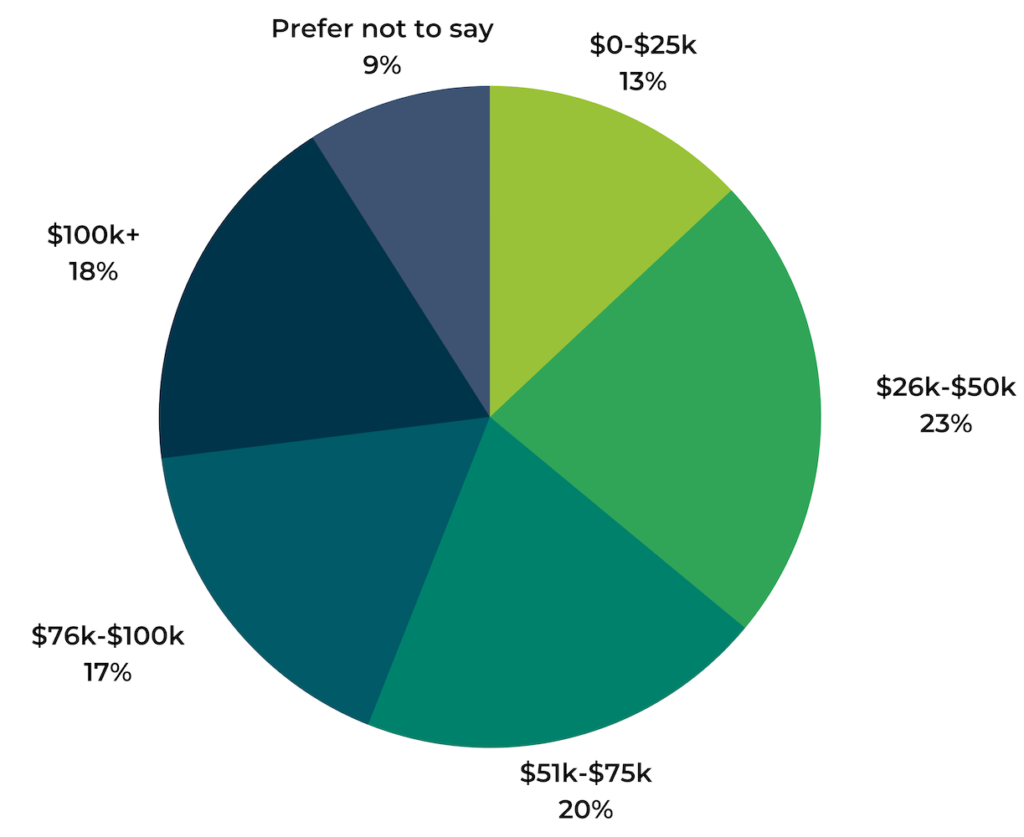
Higher household incomes also correlated with an increased demand for positive store experiences. Shoppers with the highest household incomes were the most likely to stop shopping at a retailer if they had a negative in-store experience. This may be explained by the fact that many retailers who cater to a demographic with higher household incomes are more likely to have a value proposition focused on providing a premium customer service experience. If these retailers fail to deliver on that promise, they could lose the shopper entirely.
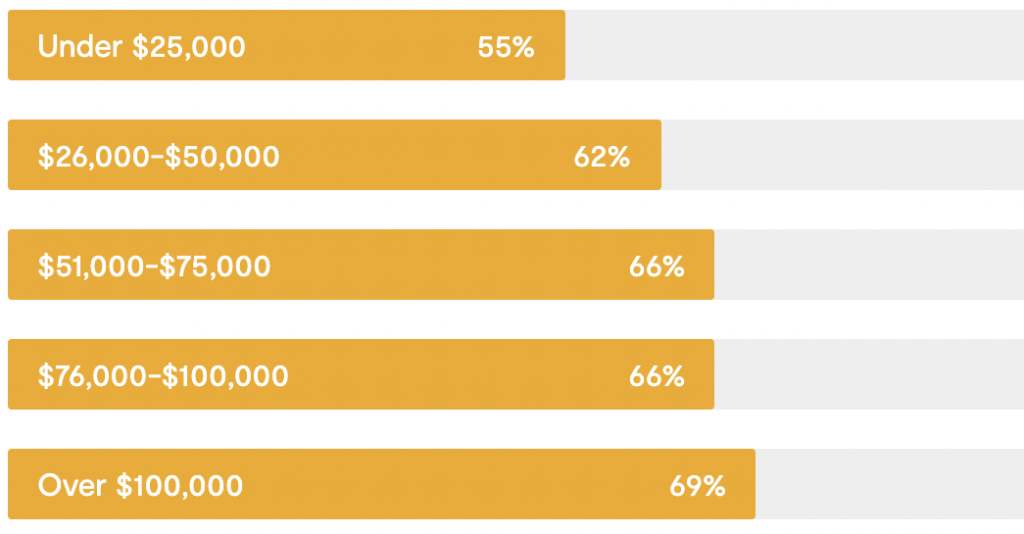
Impact of Negative Experiences on Future Shopping (By Household Income Level)
Percentage of respondents who said negative experience would stop them shopping with that retailer again by household income
Under $25,000 55%
$26,000-$50,000 62%
$51,000-$75,000 66%
$76,000-$100,000 66%
Over $100,000 69%

Customer Feedback Helps Retailers Stay Ahead in an Ever Evolving Post-COVID Landscape

Retailers need to know their shoppers’ preferences in order to succeed. Regularly collecting customer feedback is a retailer’s best tool for staying on top of consumer demand and competing in a crowded retail landscape.

The good news is customers love it when you ask for their feedback! The vast majority of shoppers (88%) agree that when a retailer asks them to provide feedback, it positively impacts their perception of the retailer. 

Specifically, when a retailer asks for feedback on the shopping experience, shoppers say:

It shows that the retailer cares about their customers and customer experience.
75%
It makes them feel valued.
56%
It makes them more likely to shop with that retailer in the future.
48%
It proves the retailer can be trusted to have their best interests in mind.
43%

At 79%, Boomers were the most likely to say a request for feedback shows that the retailer cares about their customers and their experience. It’s worth noting that even the generation that felt the least strongly about this — Gen Zers, at 70% — had an overwhelming majority say  it showed a retailer cares about their customers and experience.

Mystery Shoppers: A Retailer’s Secret Weapon

Clearly, consumers appreciate being asked for feedback. And according to our data, many of them are willing to do much more than answer a simple survey. Not only did a majority of consumers express a strong interest in being “secret shoppers” for a retailer, they said it would actually improve their perception of that retailer.

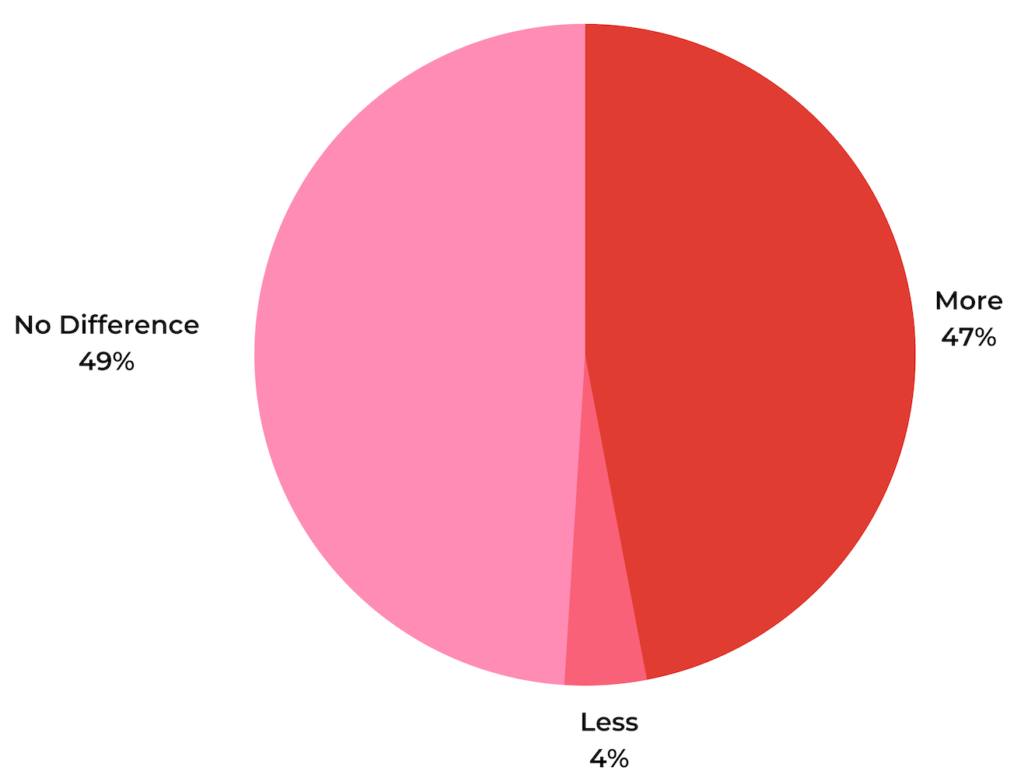
84% of shoppers would feel a moderately or significantly stronger affinity for a retailer if asked to participate in a secret shopper mission to improve their customer experience. Less than 2% would feel more negatively towards that retailer.
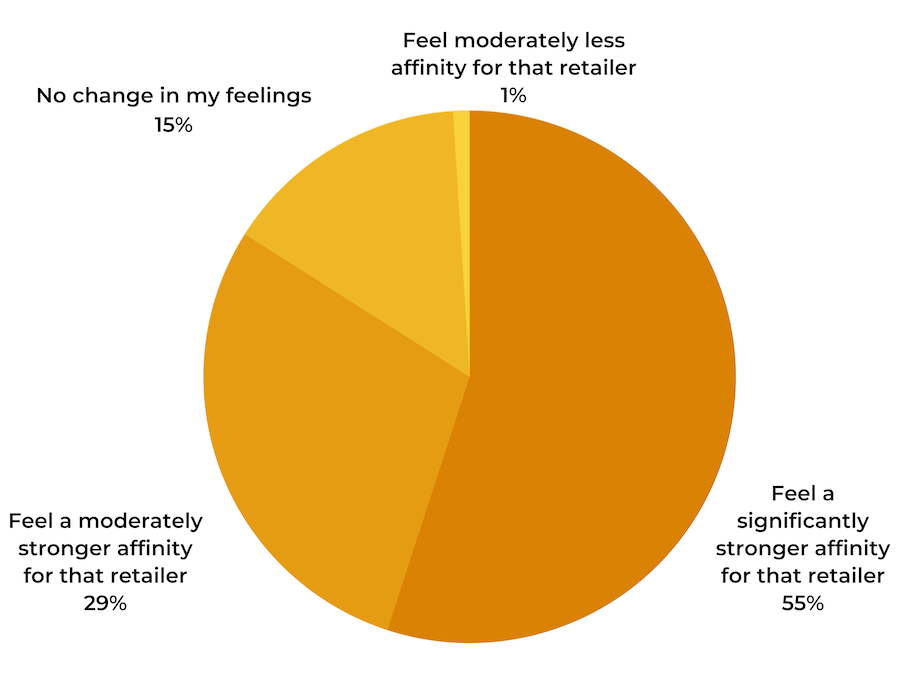
Affinity for Stores with Secret Shopper Missions
If a retailer you shop with frequently invited you to participate in a secret shopper-style “mission” to help them improve their customer experience, you would:

Secret shopper-style missions have a greater impact on younger generations, particularly Millennials. Millennials and Gen Zers were both significantly more likely to say they would feel a significantly or moderately stronger affinity for a retailer if asked to participate in such a mission.  

However, even if you currently cater to a primarily more senior audience, asking for feedback won’t hurt. While only 47% of Boomers said it would make them feel a significantly stronger affinity, those who didn’t feel significantly stronger were most likely to say it would have no impact on their feelings towards a retailer. In other words, there is little to no downside to asking for their feedback, and doing so has the potential to strengthen the loyalty of almost 50% of your shoppers.

Your Customers Are Ready to Be Back In Stores.
Are You Prepared to Have Them?

Consumer shopping preferences are always changing. The COVID-19 pandemic only accelerated the latest set of changes. Whether it’s adapting to the preferences of different generations, or different household incomes, retailers must actively solicit feedback from their shoppers to keep them loyal. 

With Store Experience Feedback from PowerReviews, the feedback process is easy. Our secret shopper solution empowers retailers to gather feedback through a gamified shopping experience that strengthens loyalty and drives revenue. Learn more here.


Research Methodology
The PowerReviews 2021 In-Store Shopping Trends & Preferences consumer survey is based on insights from more than 7,500 U.S. consumers in June 2021. Throughout the survey, we defined Boomers as born in the years 1946 to 1964 (aged 57-75 on Jun 1, 2021), Gen X as born in the years 1965 to 1980 (aged 41-56 on Jun 1, 2021), Millennials as born between 1981-1996 (aged 25-40 on Jun 1, 2021) and Gen Zers born in or after 1997 (ages 24 and younger on Jun 1, 2021). Regions were defined by Government census directives.
The impact of user-generated photos and videos on purchase behavior, based on insights from more than 7,500 U.S. consumers.

Power Points

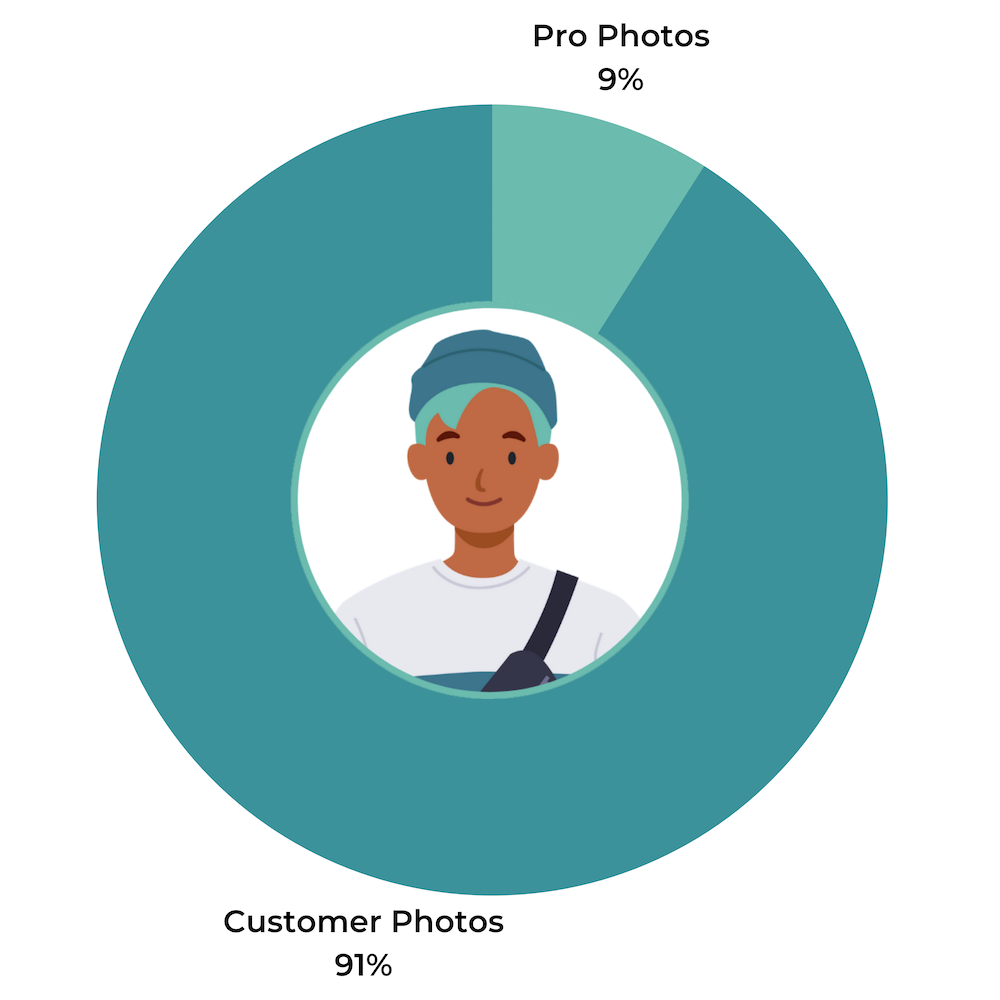
A growing number of consumers depend on visual content, such as photos and videos, to make informed purchase decisions.
  • Today 100% look for visual content before making a purchase at least sometimes. In 2016, 97% indicated this was the case.

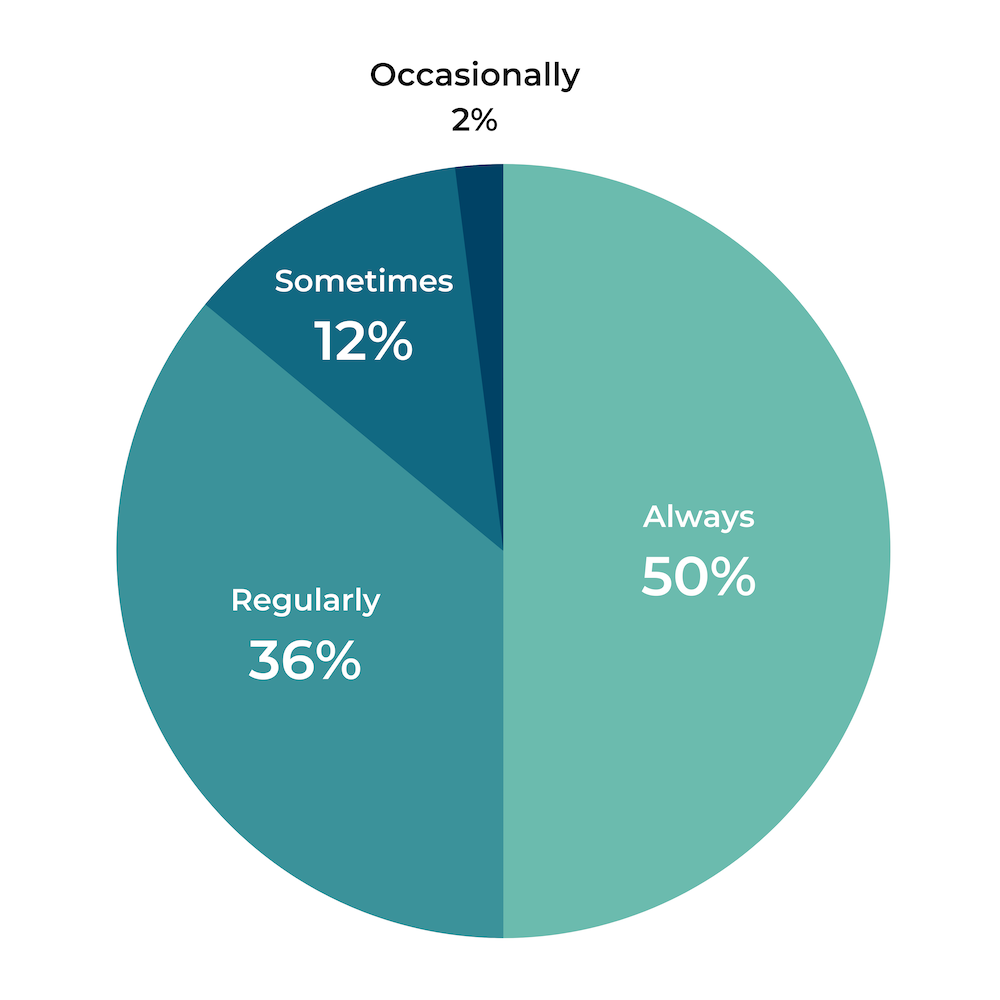
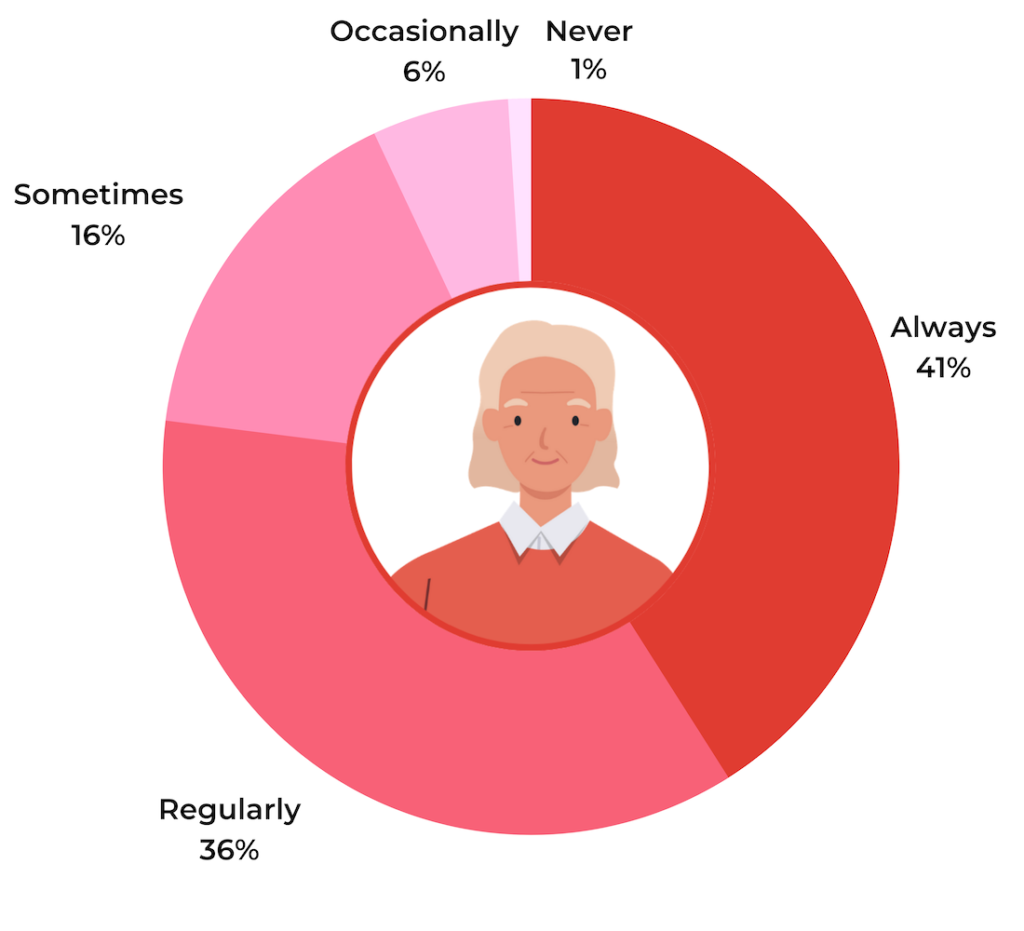
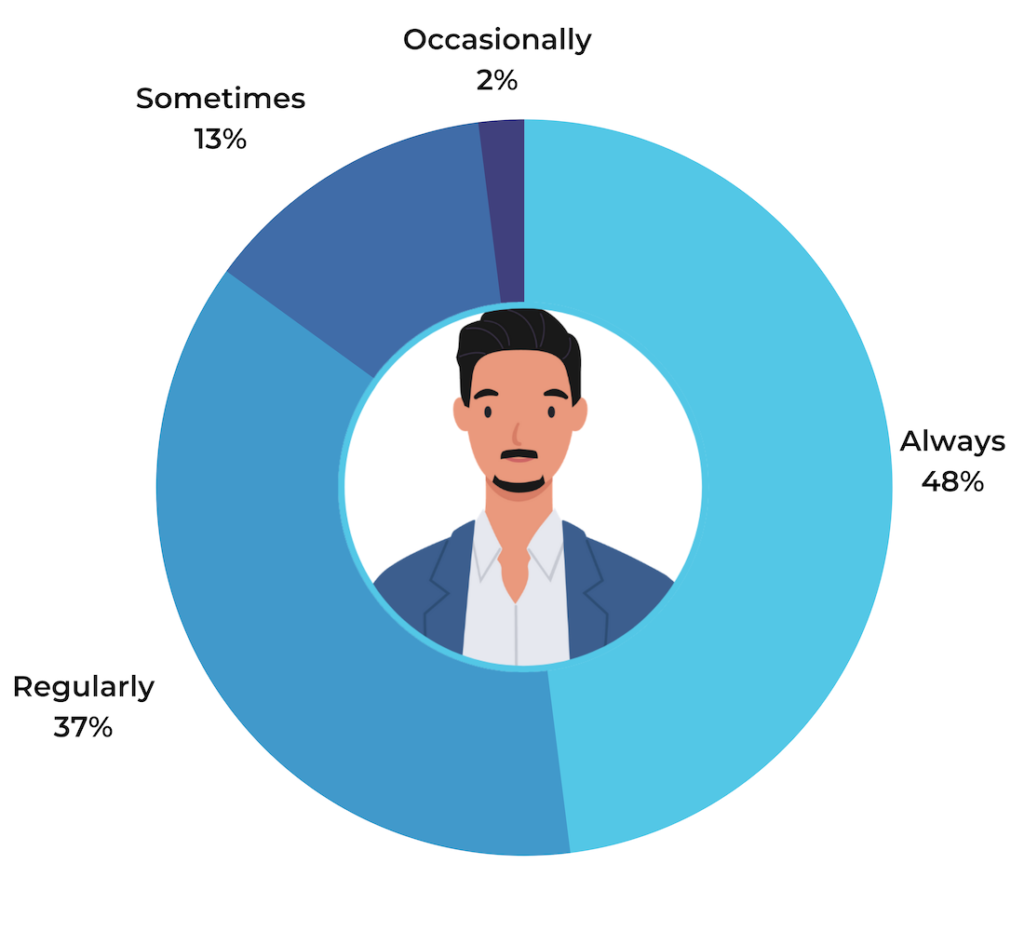
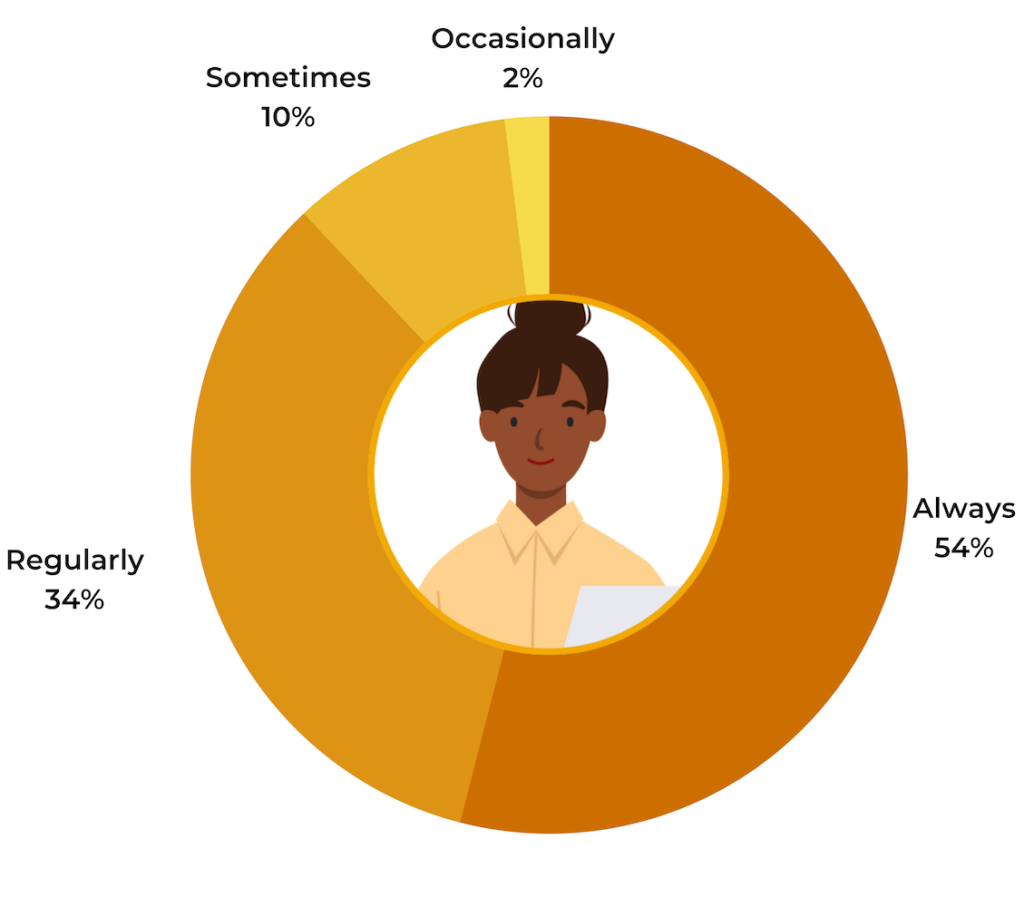
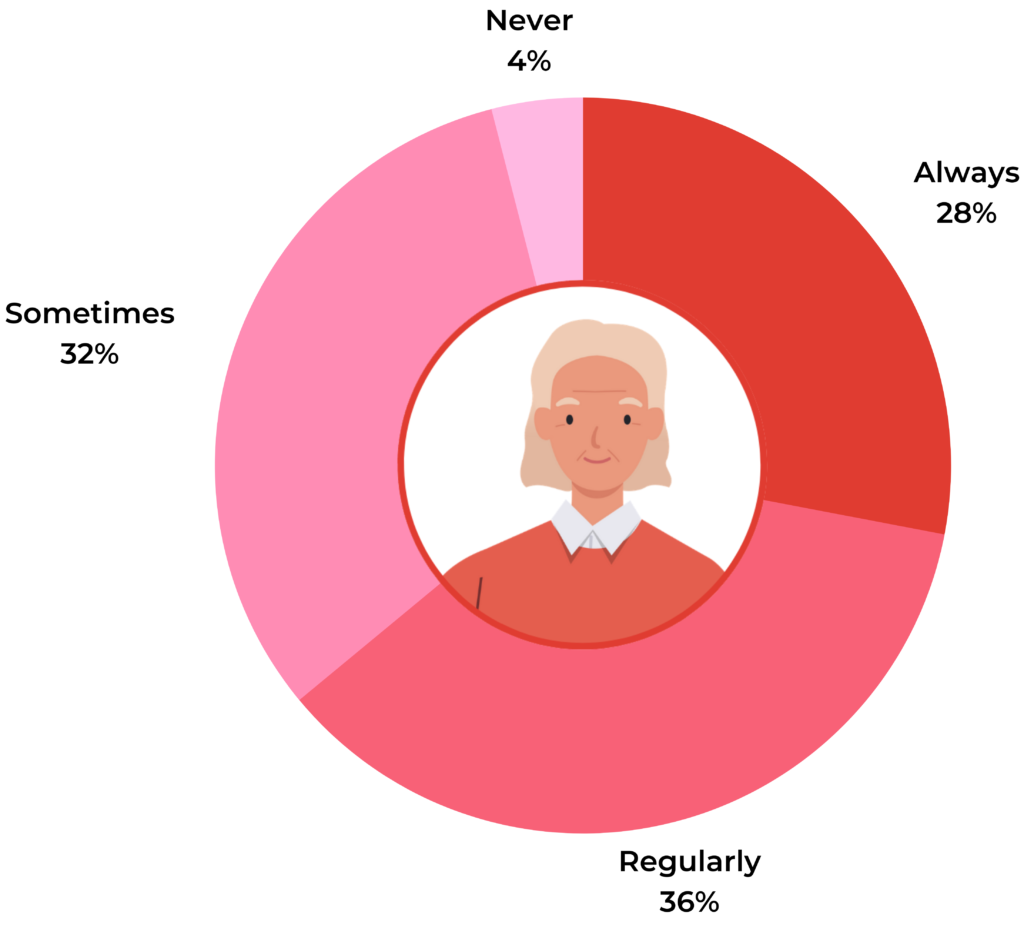
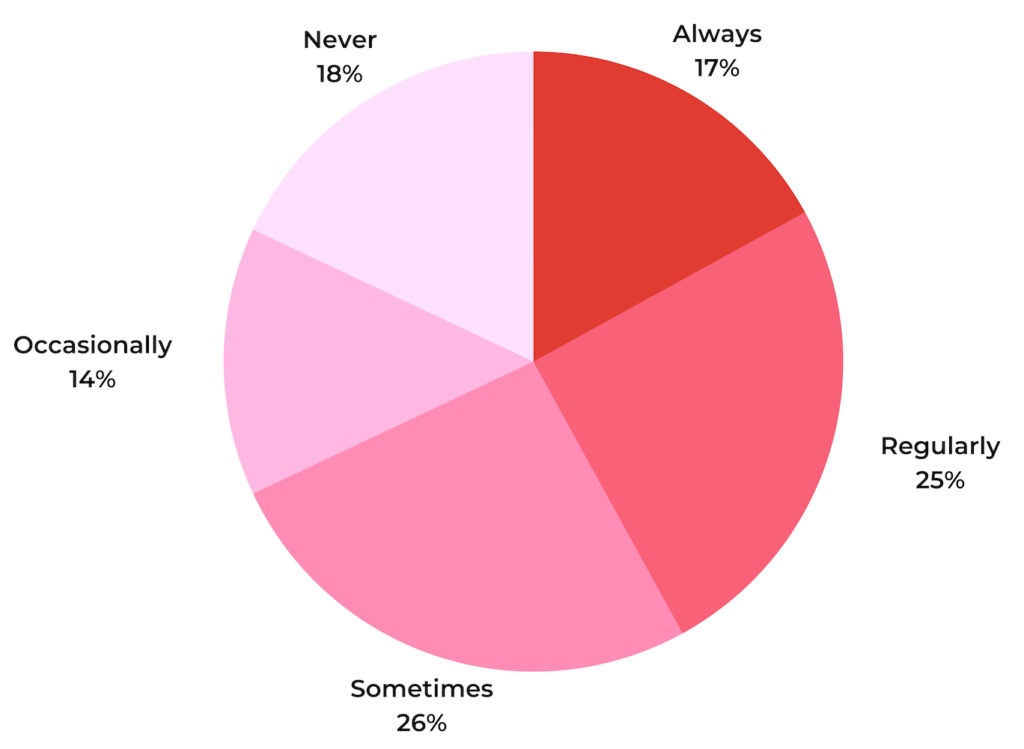
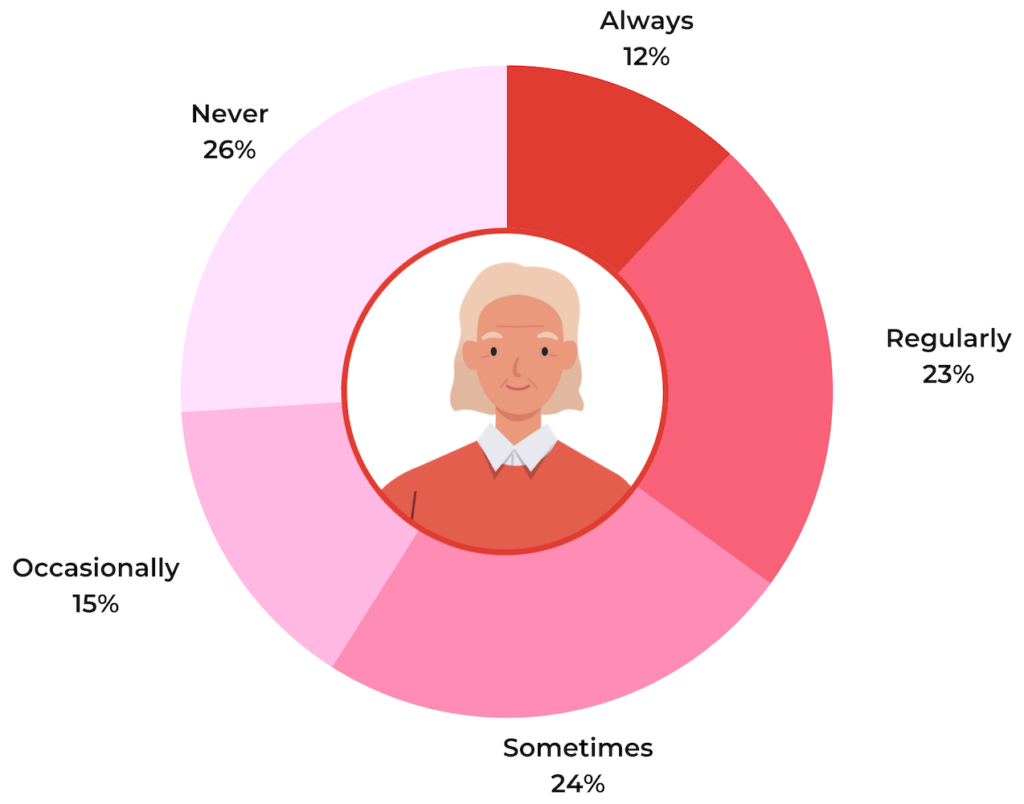
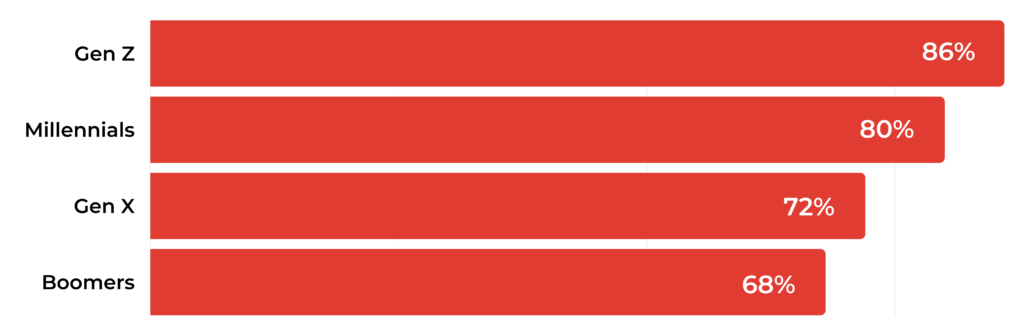
  • 86% of consumers always or regularly seek out photos and videos prior to purchase, compared to 72% in 2016.
Increasingly, consumers seek out photos and videos from other consumers -- and value them more than brand or retailer-supplied visual content.
  • Nearly all (99%) of consumers look for photos and videos submitted from other customers at least occasionally. In 2016, 88% did so.

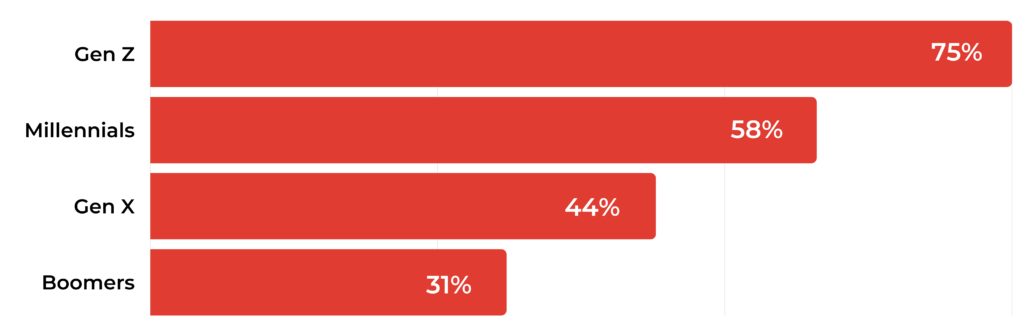
  • 77% of consumers always or regularly seek out visual content from others who have already purchased a product. This number is even higher among Millennial (84%) and Gen Z (91%) shoppers.

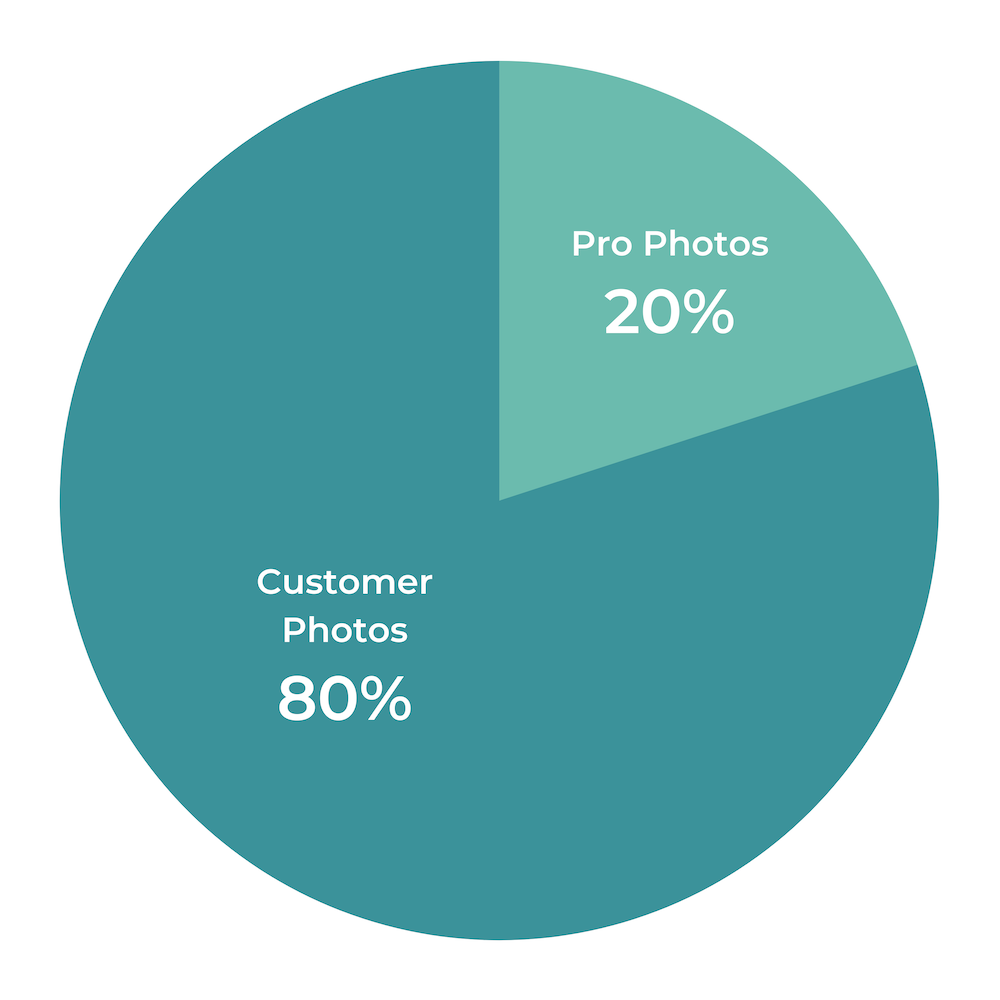
  • 80% of consumers find photos from other customers more valuable than photos from brands or retailers. This is a significant increase from 2016, when 44% indicated they valued user-generated photos more than brand or retailer supplied visual content.
The presence (or absence) of user-generated visuals can make or break a sale.
  • 85% of shoppers are more likely to buy a product that has reviews that include visual content in addition to written text, up from 72% in 2016.

  • Younger shoppers are especially swayed by visual content; 99% of Gen Z shoppers and 89% of Millennials are more likely to purchase products that have reviews that feature photos and videos.

  • A third of Gen Z consumers and nearly a quarter (21%) of Millennials won’t purchase a product if there are no photos or videos from other consumers who have purchased it.
User-generated visual content is valued across myriad product categories.
  • Consumers find user-generated photos and videos helpful when purchasing products across a wide range of categories.

  • The top product categories consumers value user-generated visual content include clothing (78%), electronics (70%), appliances (63%), home and garden (62%) and health and beauty (60%).

Introduction

We’re Living in a Highly Visual World

Photos and videos have become integral to the lives of modern consumers. Photography and videography — once limited to those with fancy equipment and specialized training — is now accessible to anyone with a mobile phone.

And channels like Instagram provide a platform for these amateur photographers and videographers to publish their content and share their opinions.

Visual Content has Become a Key Component of the Path to Purchase

The proliferation of photos and videos has also transformed shopping behavior. In the past, consumers found inspiration and discovered new products by visiting brick-and-mortar stores. This still happens, but a growing number of consumers now get inspiration by scrolling through their Instagram feeds.

Then, when they’re evaluating whether to buy a product, they look for photos and videos — including those taken by other consumers who have already purchased a product — as they seek to make more informed purchase decisions.

Brands and Retailers Must Provide the Visual Content Consumers Seek

Today’s consumers expect to find plenty of visual content for the products they’re considering. And increasingly, they specifically seek out photos and videos taken by other consumers. If shoppers can’t find what they’re looking for, they’re likely to look elsewhere.  

Brands and retailers must make it a priority to showcase both professional photos and videos, as well as visual content from customers. It’s well worth the effort.

Our recent analysis of 1.5MM online product pages from more than 1,200 brand and retailer sites found that there’s a 91.4% lift in conversion when visitors interact with user-generated photos and videos on a product page.

There’s a 91.4% lift in conversion when visitors interact with user-generated photos and videos on a product page.

Understand the Role of Visual Content to Optimize Your Strategy

In order to develop effective strategies to collect and display user-generated visual content, brands and retailers must take a step back and understand the role this content plays in the online purchase journey — and how it influences purchase behavior.

Recently, PowerReviews surveyed more than 7,500 U.S. consumers to better understand how they use both brand provided and consumer-generated visual content when navigating the purchase journey.

We also wanted to understand how the role of visual content has changed since 2016, when we conducted similar research.

We share the results below, before providing six impactful actions brands and retailers can take to better leverage user-generated imagery to drive sales based on the findings.

Who We Surveyed

Generations

Gen Z
(1997-present)
1%
Millennials
(1981-1996)
50%
Gen X
(1965-1980)
36%
Baby Boomers
(1946-1964)
13%

Household Income

How Dependence on Visual Content is Growing

When a consumer is shopping in a brick-and-mortar store, they can see, touch and – to a degree – try out a product prior to purchase.

Of course, that’s not possible when shopping online — which was becoming increasingly common anyway but has become even more so after Covid.

However, many shoppers turn to visual content to bridge this gap.

Nearly All Consumers Seek Out Visual Content

Visual content has always been important. And it’s getting even more important.

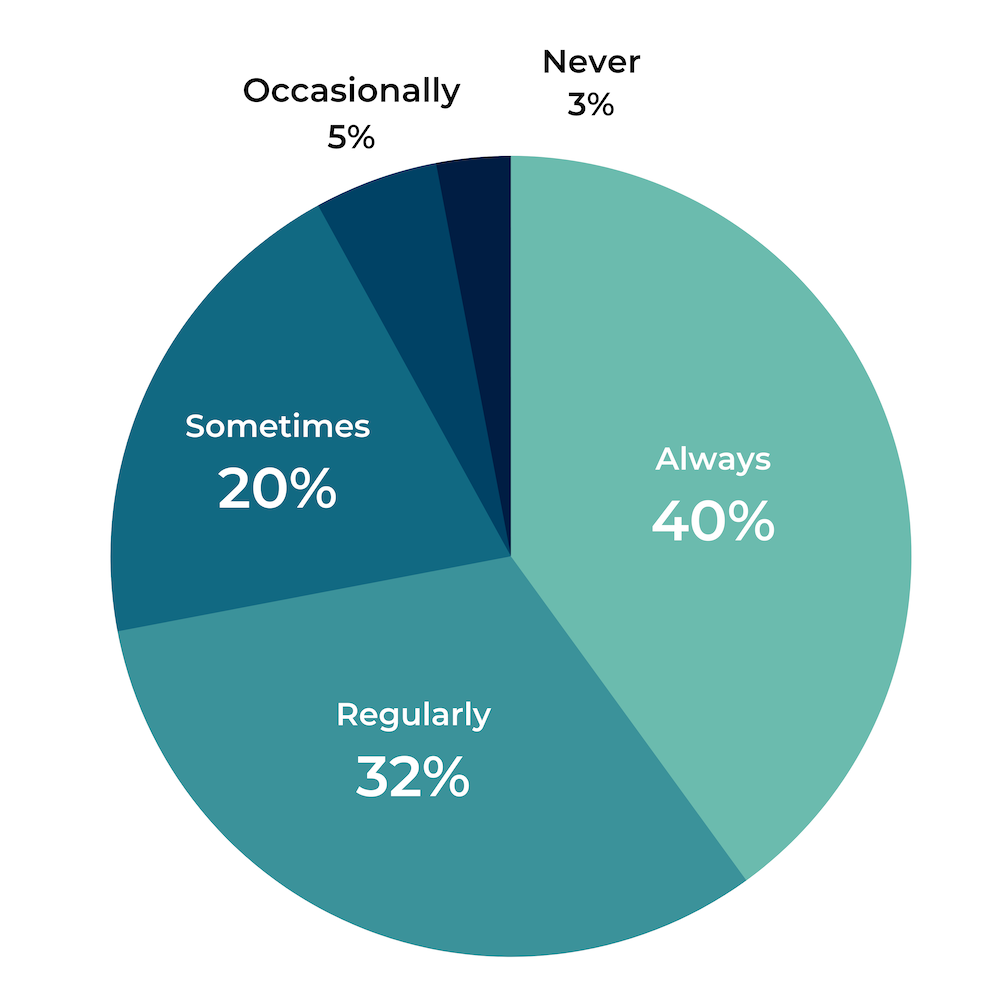
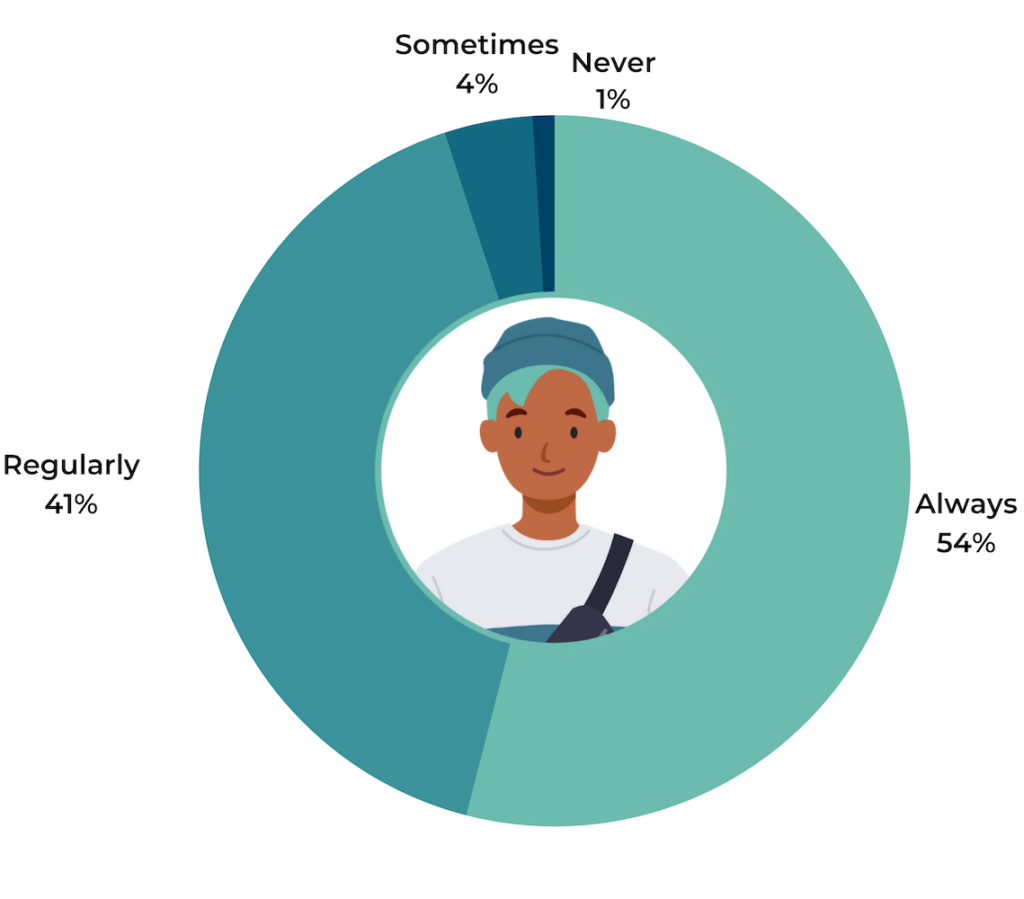
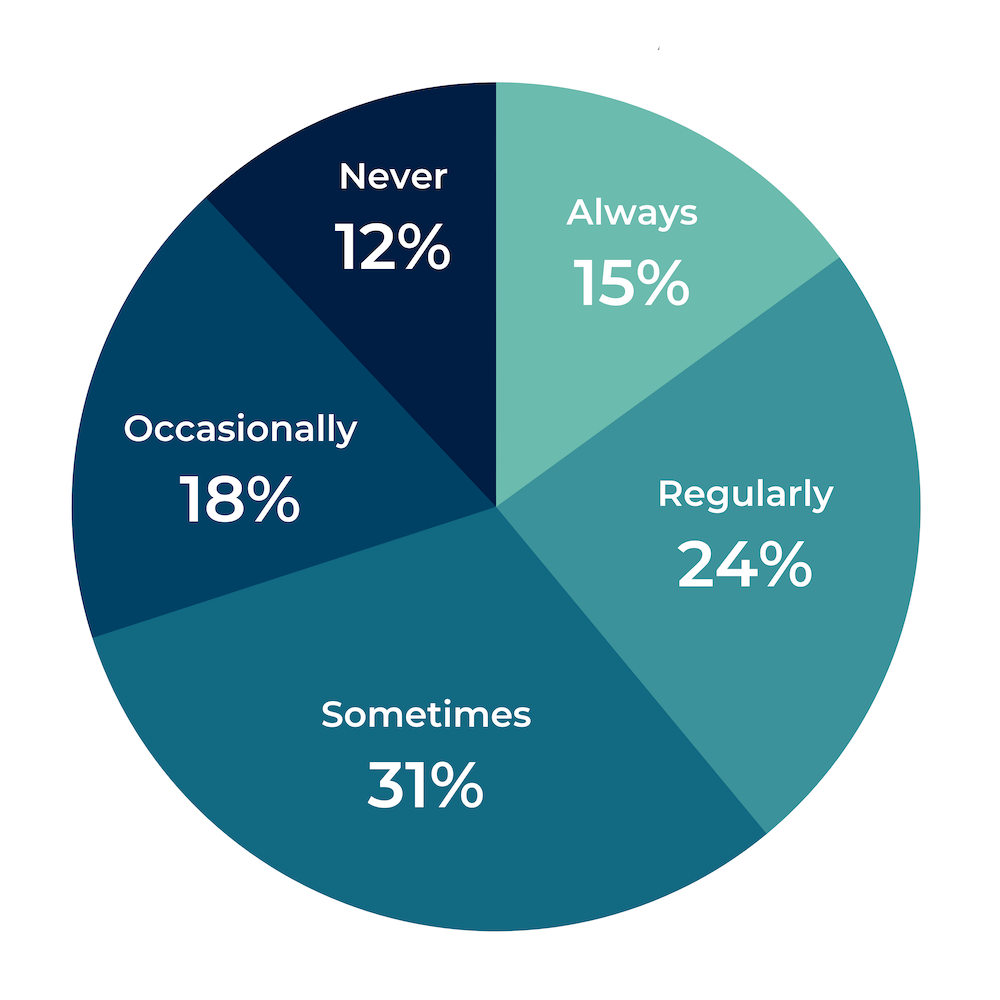
When we surveyed consumers in 2016, 97% indicated they looked for visual content prior to making a purchase at least occasionally. Today, even more consumers — 100% — say that’s the case.

Consumers Rely More on Visual Content Than They Did Five Years Ago
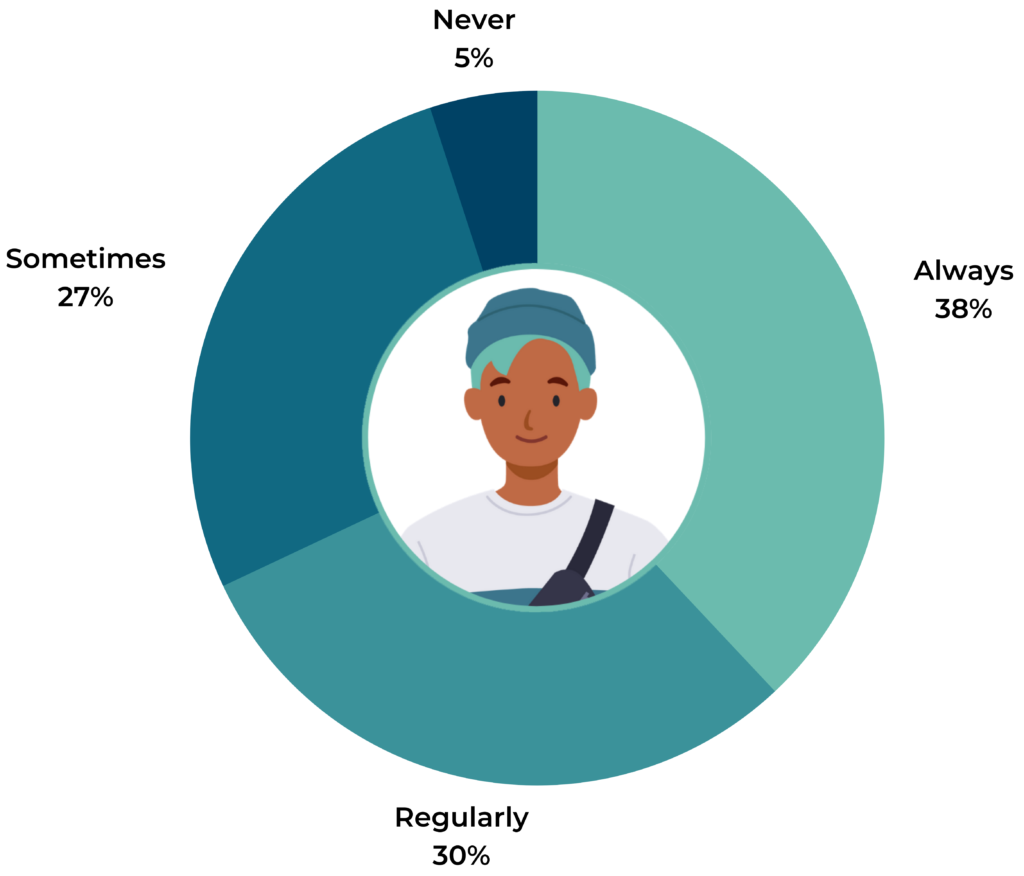
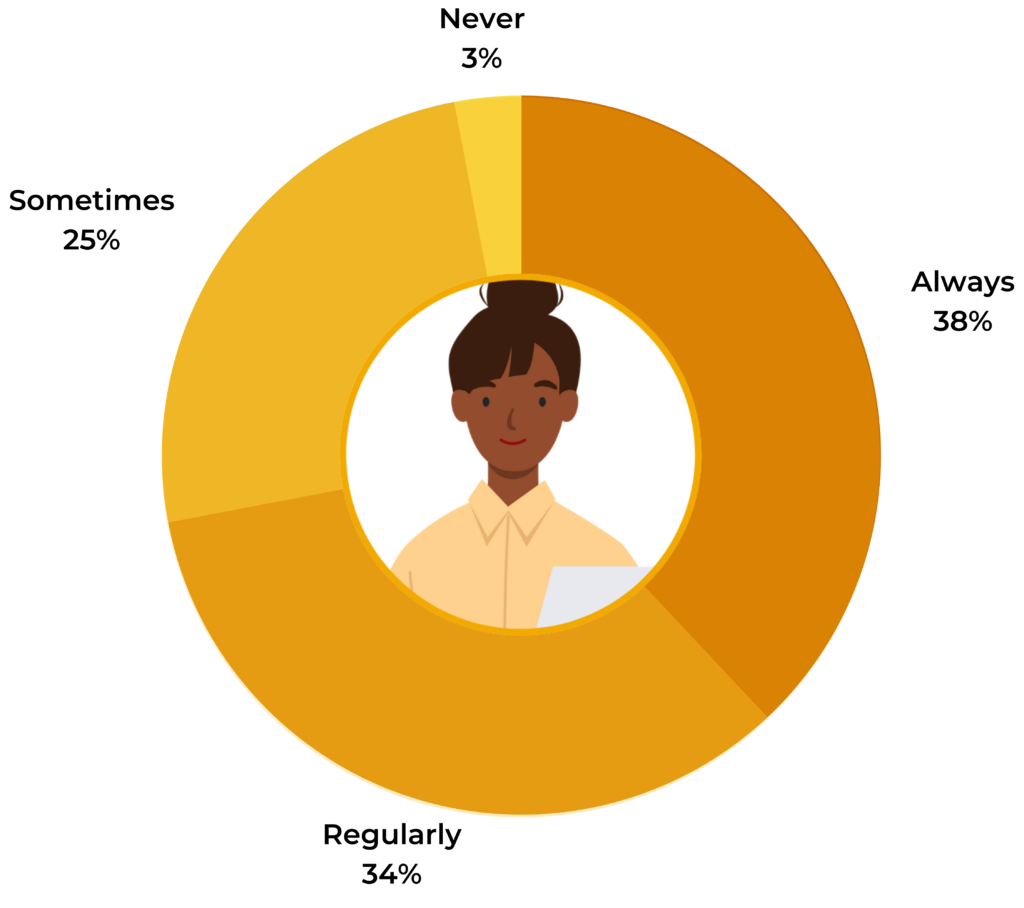
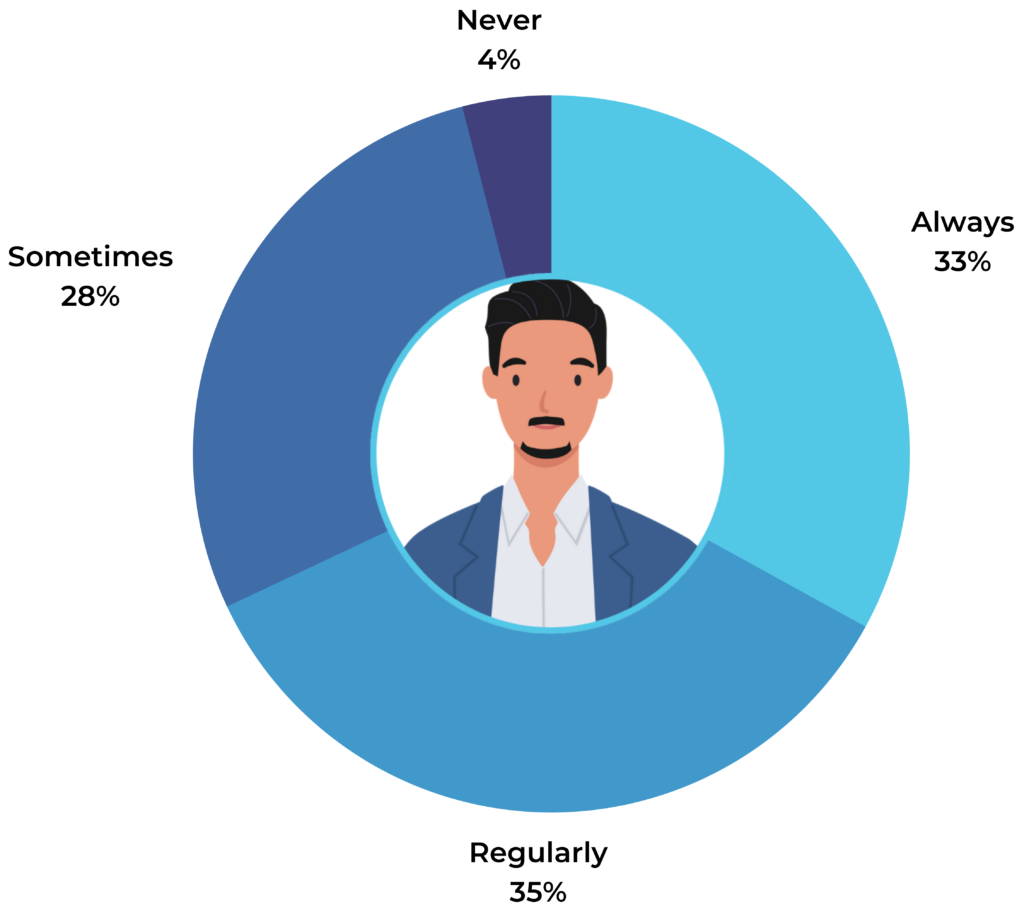
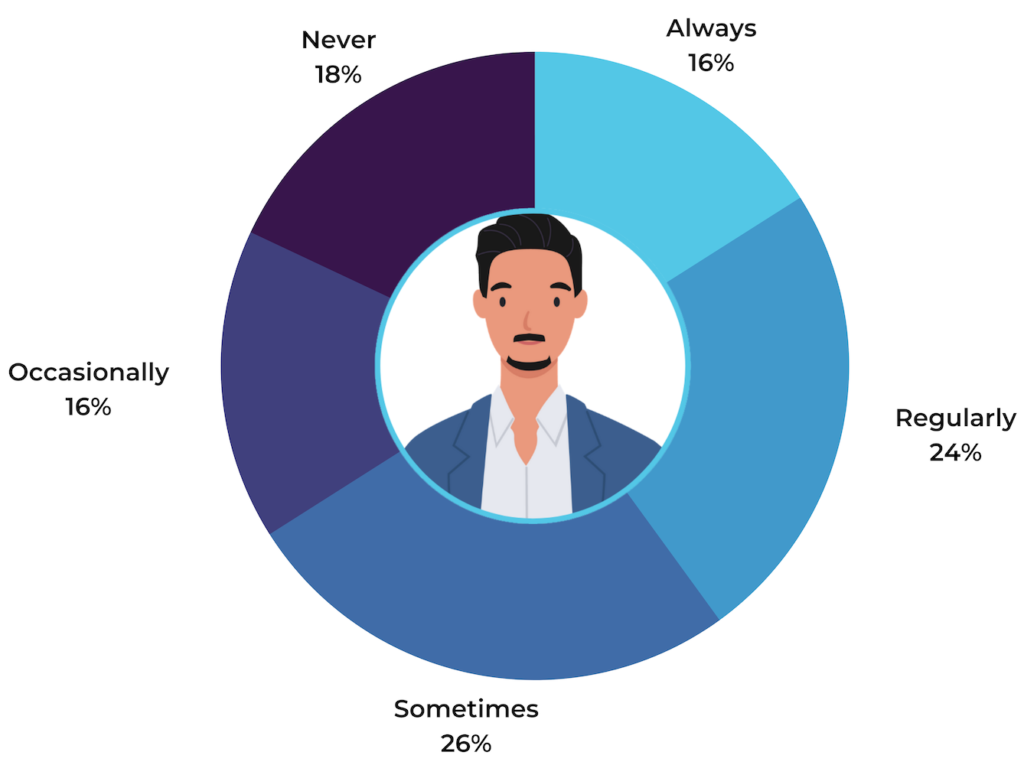
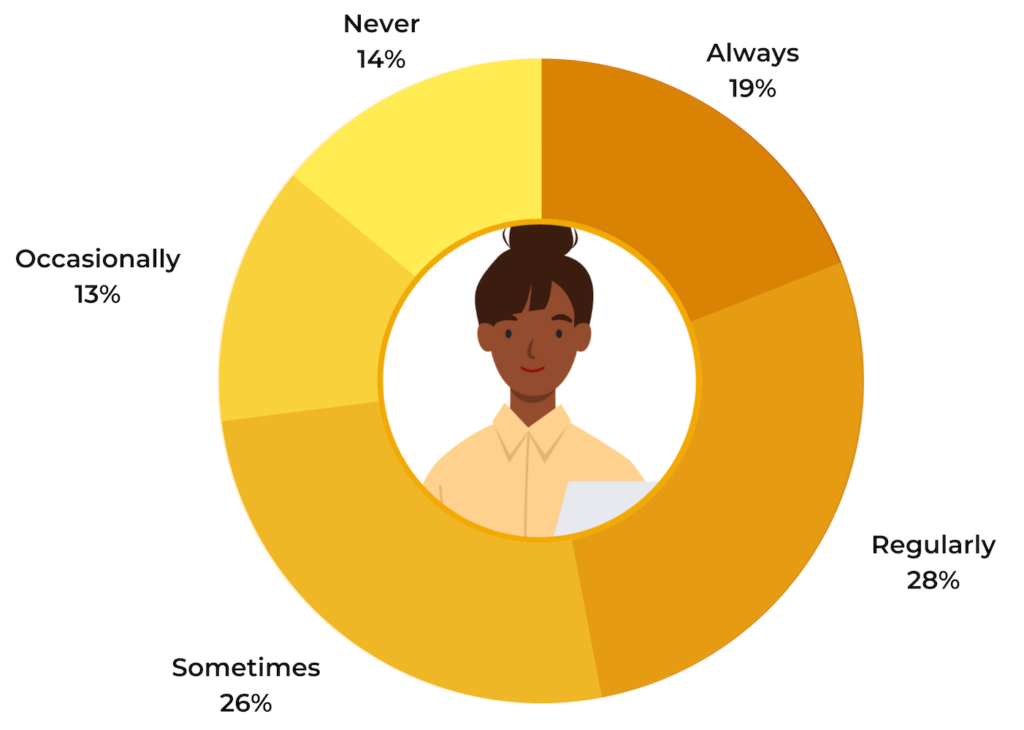
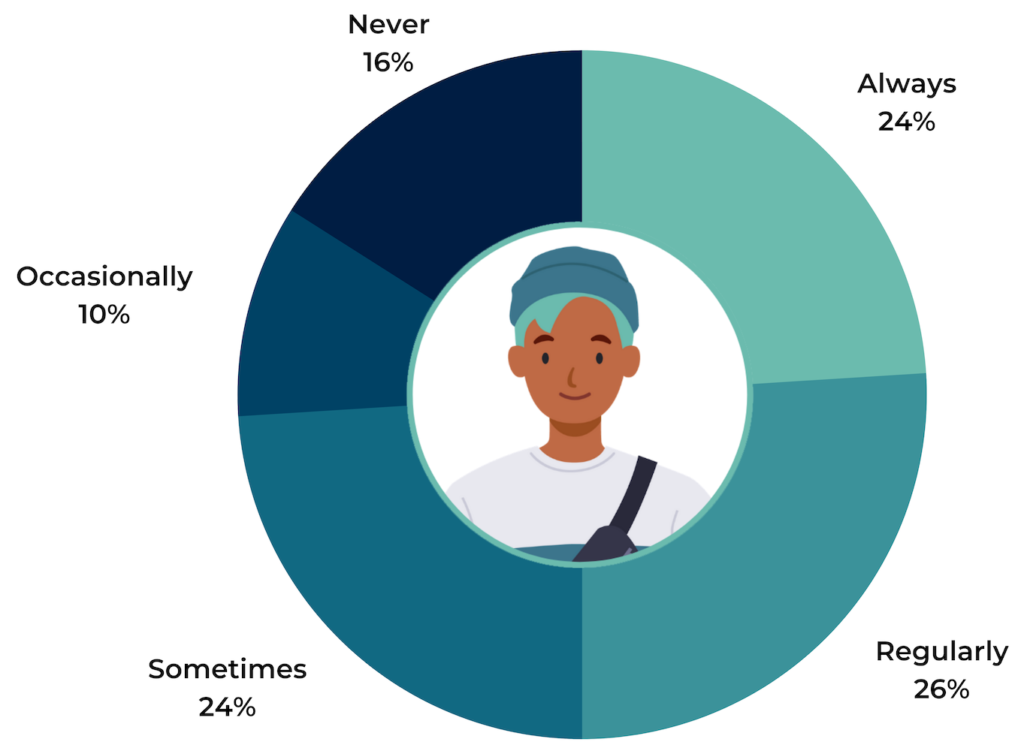
When researching a product prior to purchase, how often do you look for visuals, such as photos and videos, of that product?
2016
2021

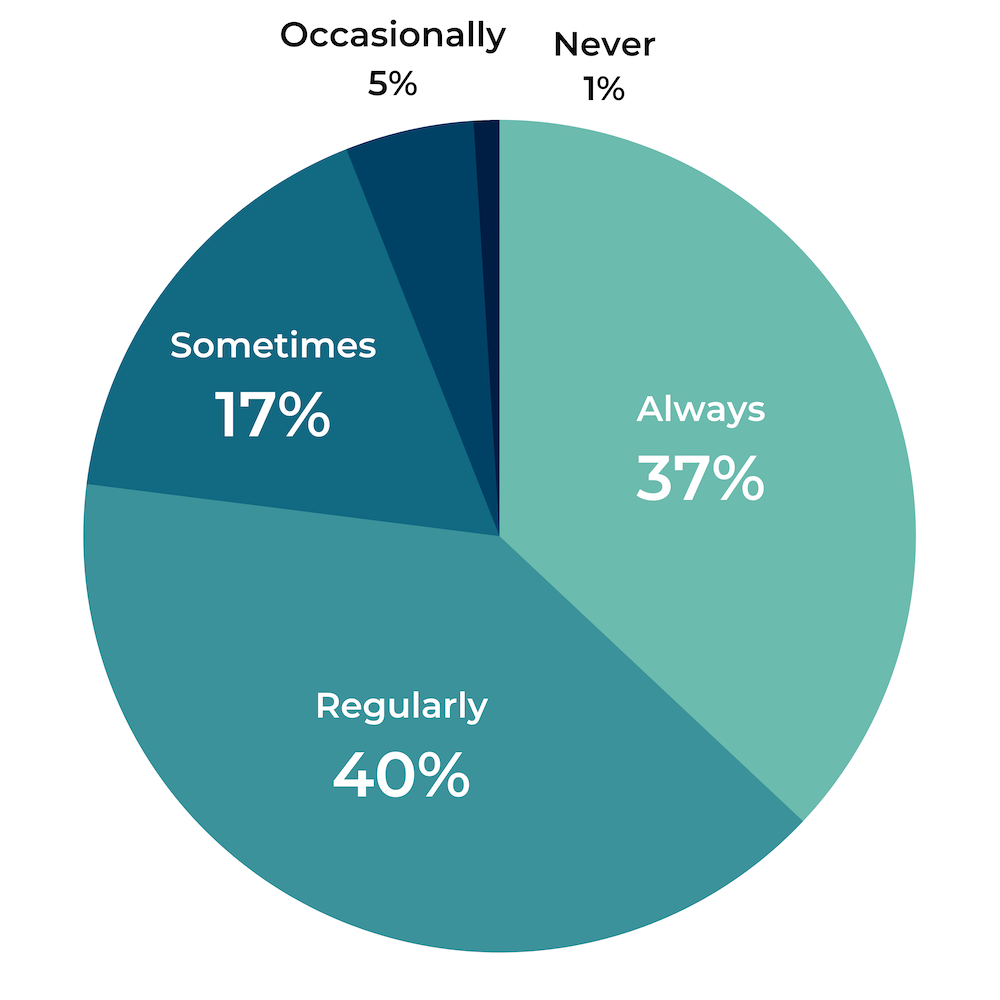
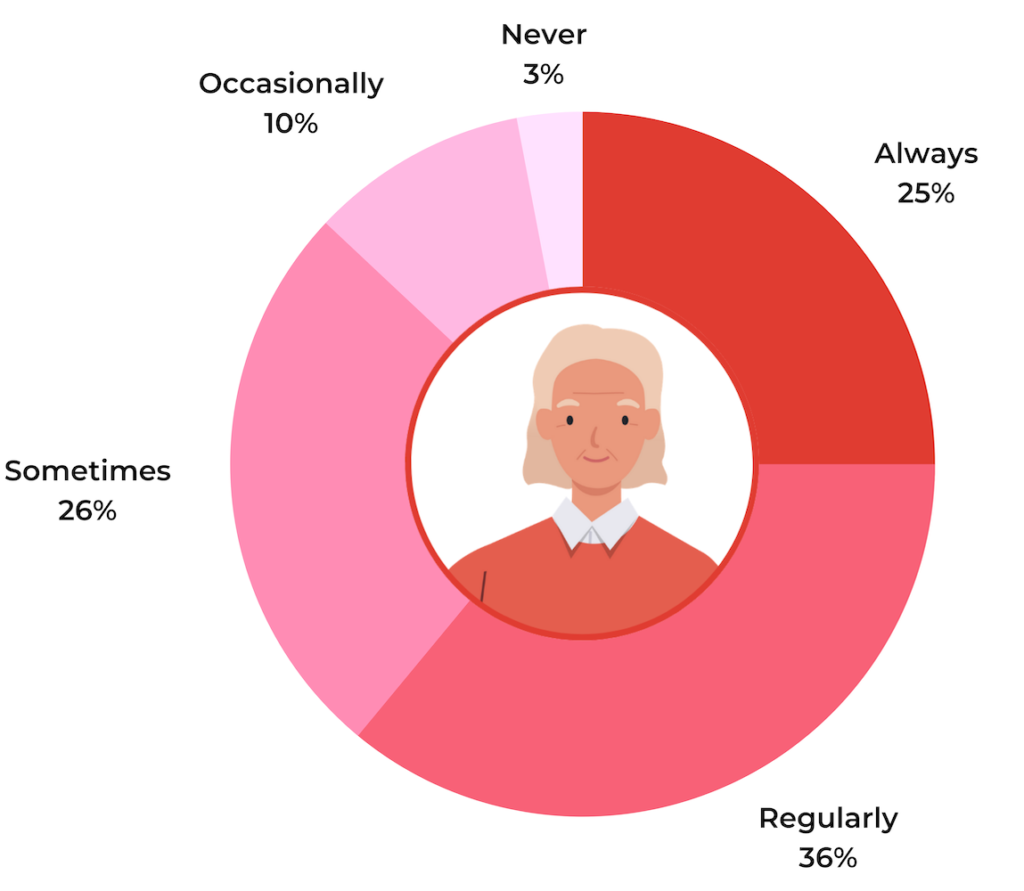
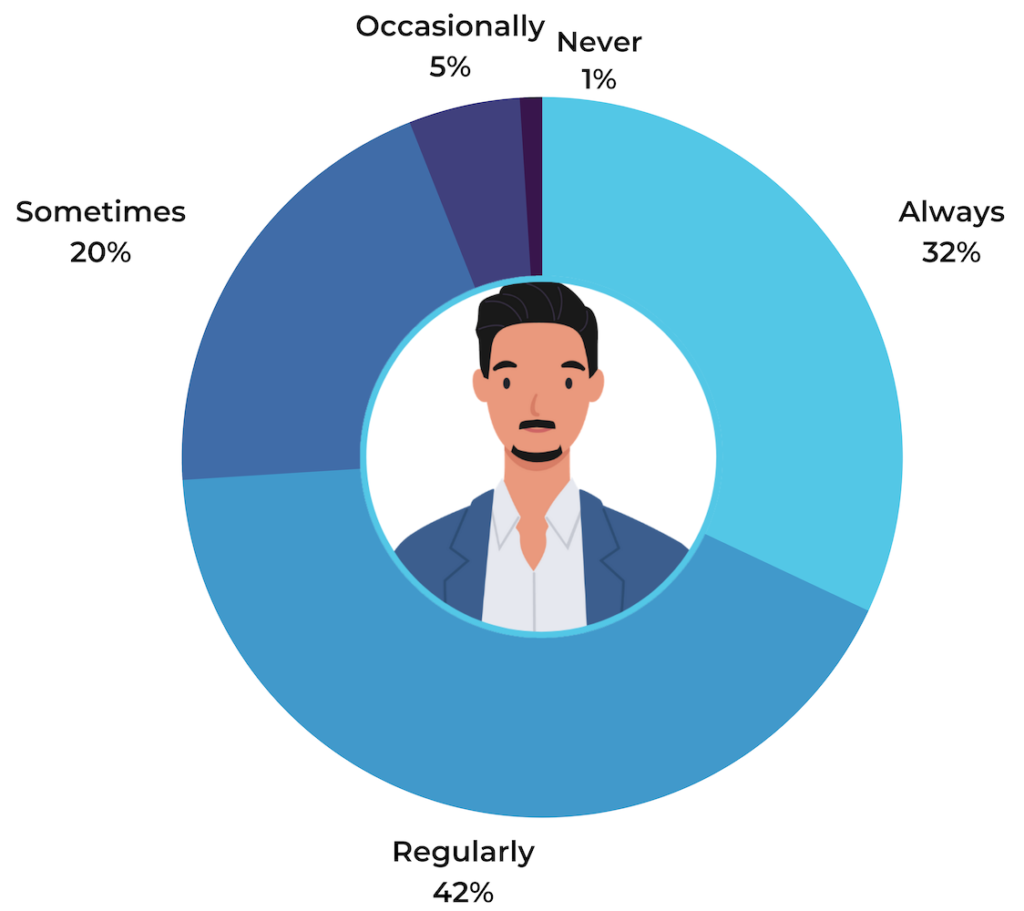
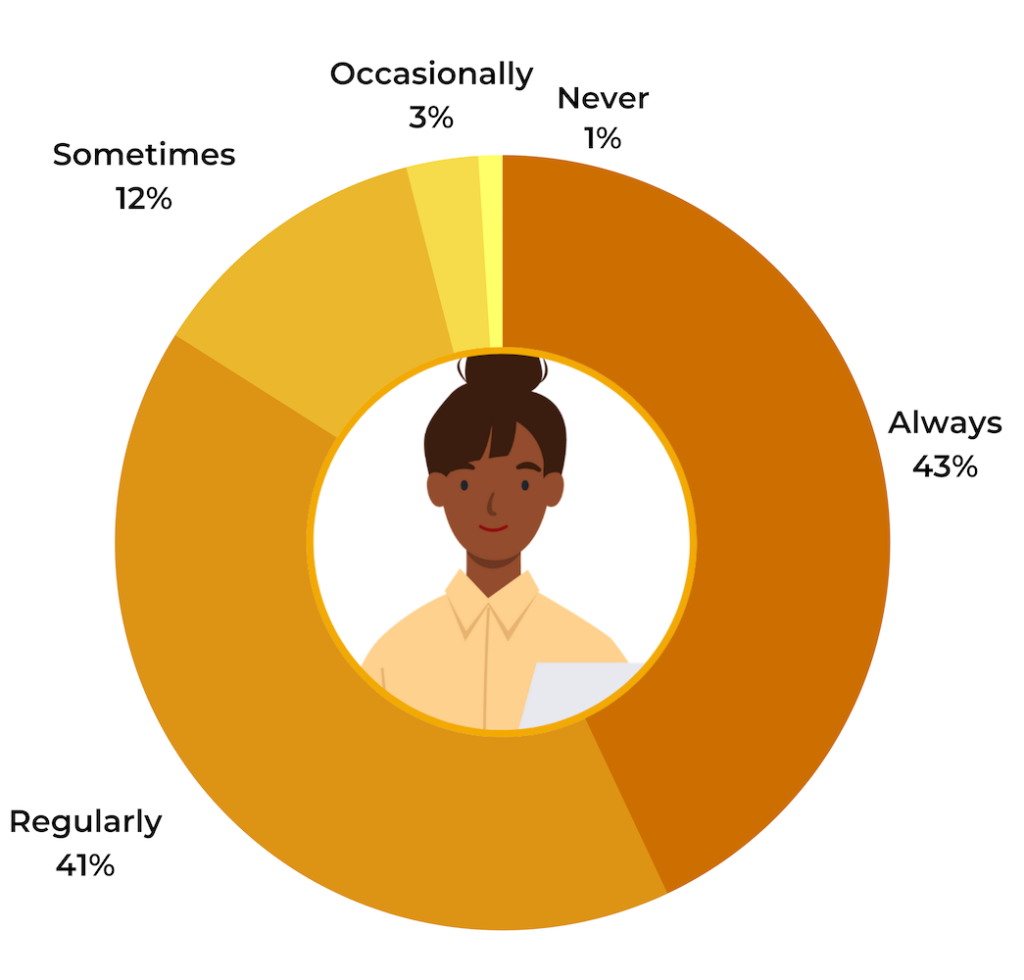
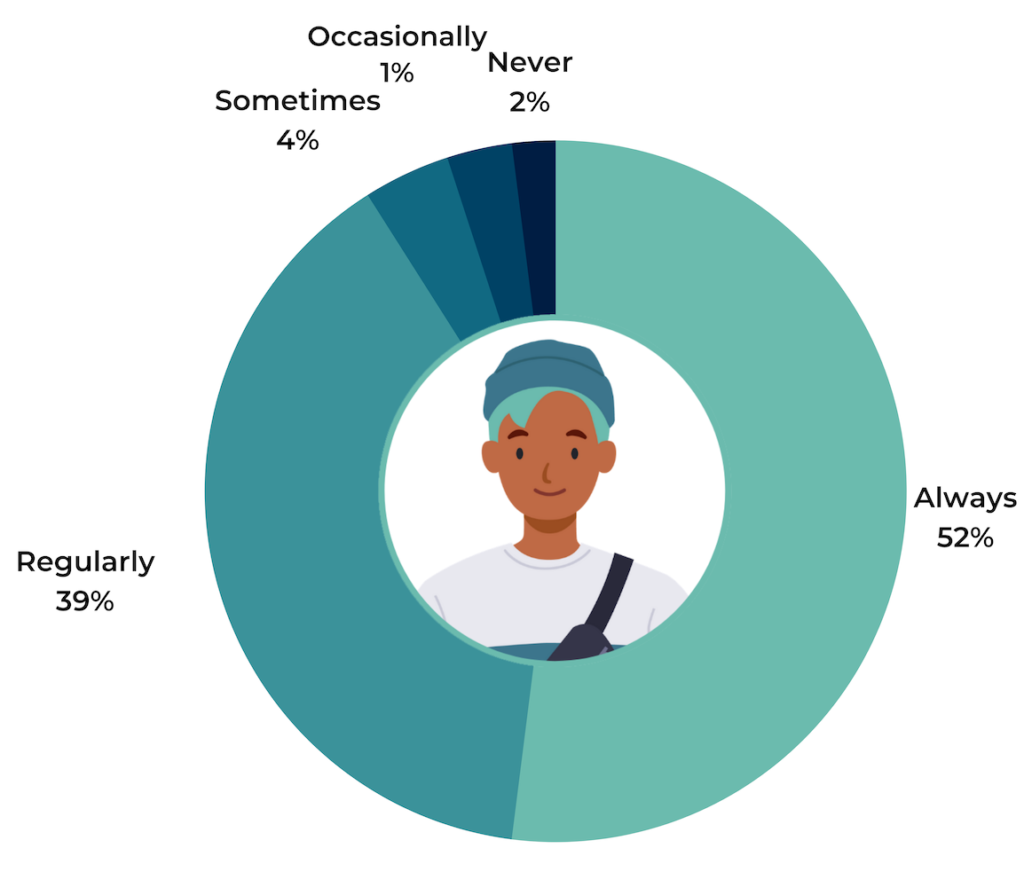
As expected, younger consumers seek out visual content more frequently than their older counterparts. 95% of Gen Z shoppers and 88% of Millennials seek out visual content regularly or always. In comparison, nearly 85% of Gen X shoppers and 77% of Boomers do so.

How Often Consumers Seek Out Visual Content Prior to Purchase
Boomers
Gen X
Millennials
Gen Z

Consumers Want Authentic Real-Life User-Generated Visual Content

Consumers have an appetite for visual content. But not just any photos and videos will satisfy them. That’s because increasingly, shoppers want to find visual content from other shoppers who have already purchased the product in question.

When conducting research prior to purchase, nearly all (99%) of consumers look for photos and videos submitted by other consumers at least occasionally. In 2016, 88% said this was the case.

Those who seek out user-generated visual content are doing so more frequently than they were just five years ago. Today, 77% of consumers always or regularly seek out visual content from others who have already purchased a product, compared to just over a third (39%) in 2016.

Consumers Seek Out User-Generated Visual Content Prior to Purchase
2016
2021

Not surprisingly, younger consumers are more likely to frequently seek out user-generated photos and videos than older ones. 91% of Gen Z shoppers always or regularly seek out user-generated visual content prior to making a purchase, compared to 61% of Boomers.

Consumers Seek Out User-Generated Visual Content Prior to Purchase
Boomers
Gen X
Millennials
Gen Z

Consumers Value User-Submitted Visual Content Over Brand Provided Content

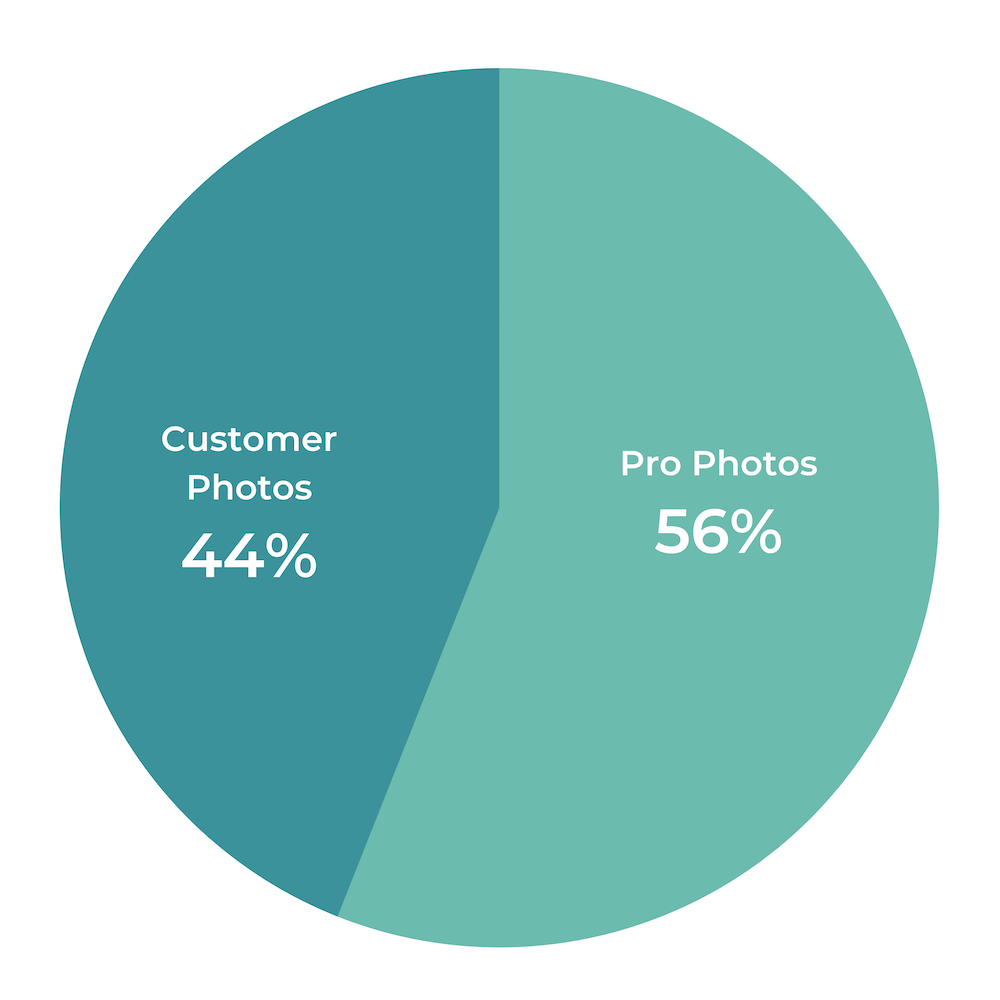
Brands and retailers invest time and resources to capture great photos and videos of their products. And while professional photos and videos are certainly important, increasingly, consumers value user-generated visual content more.

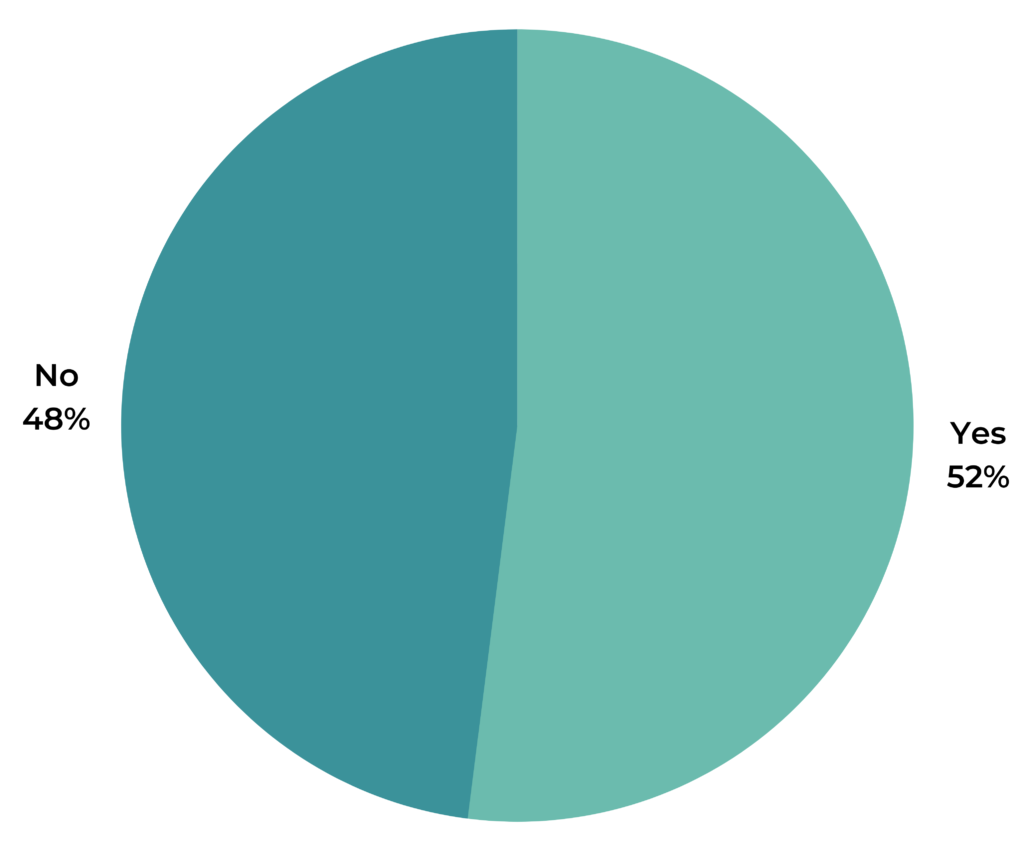
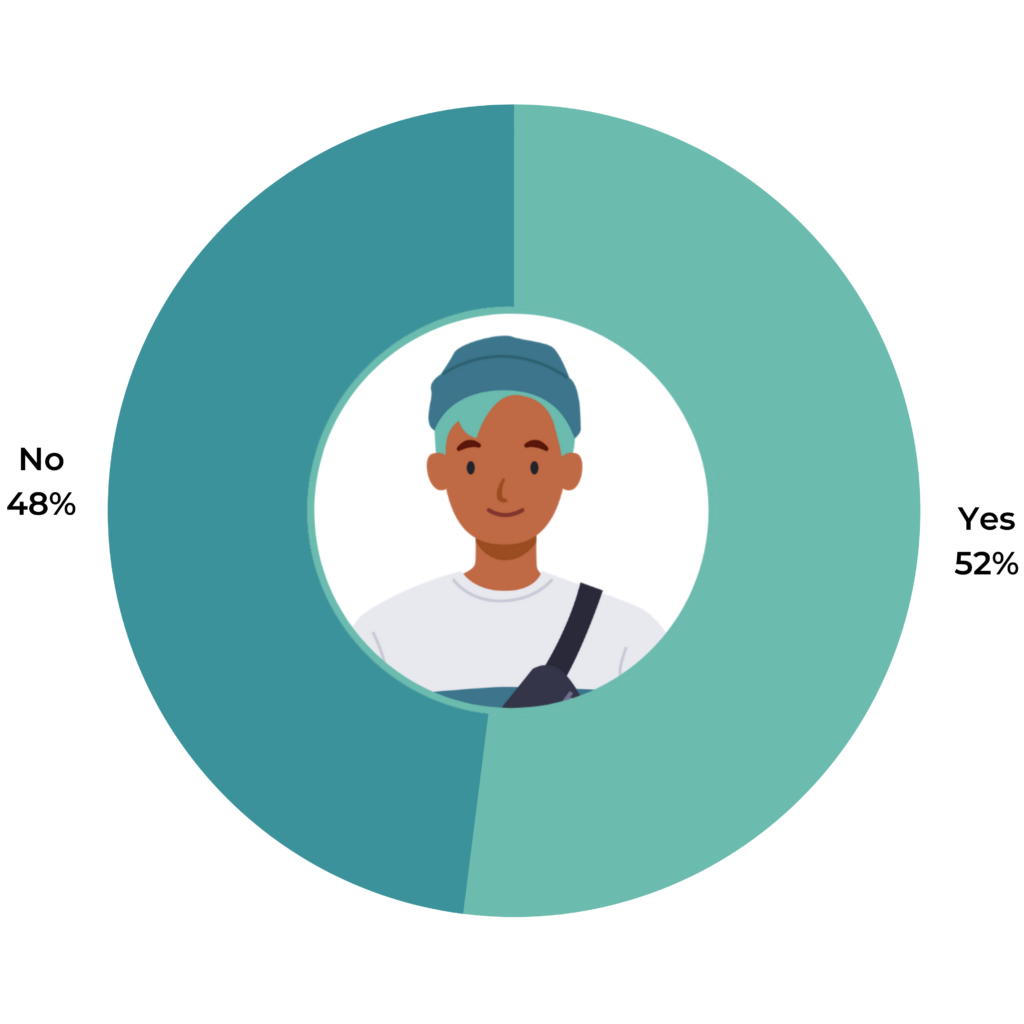
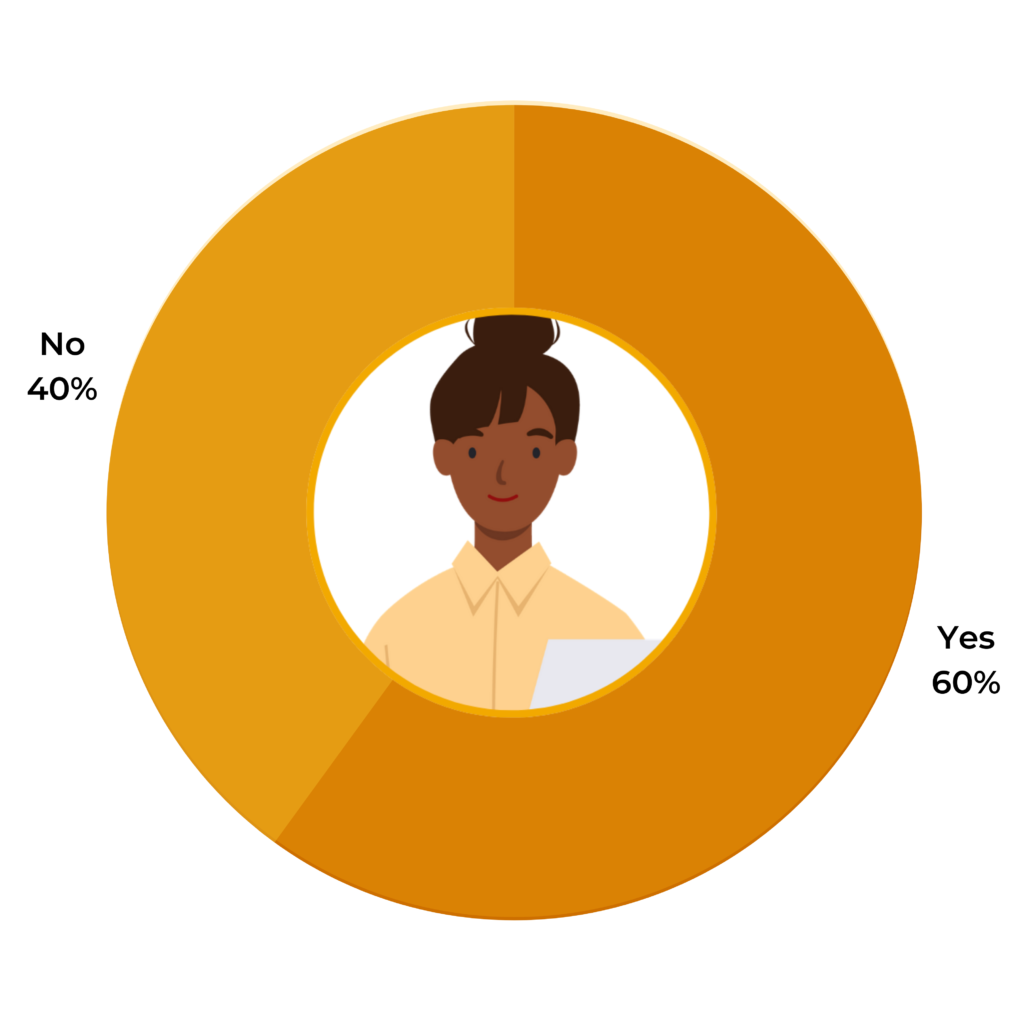
When contemplating a purchase, 80% of consumers say that a photo from another customer is more valuable than one from a brand or retailer.

In 2016, less than half (44%) felt this way. Clearly, user-generated photos are becoming table stakes as more consumers navigate the online purchase journey.

Types of Photos Consumers Value More
What kind of product photos are more valuable to you: professional photos supplied by the brand/retailer, or those supplied by another customer?
2016
2021

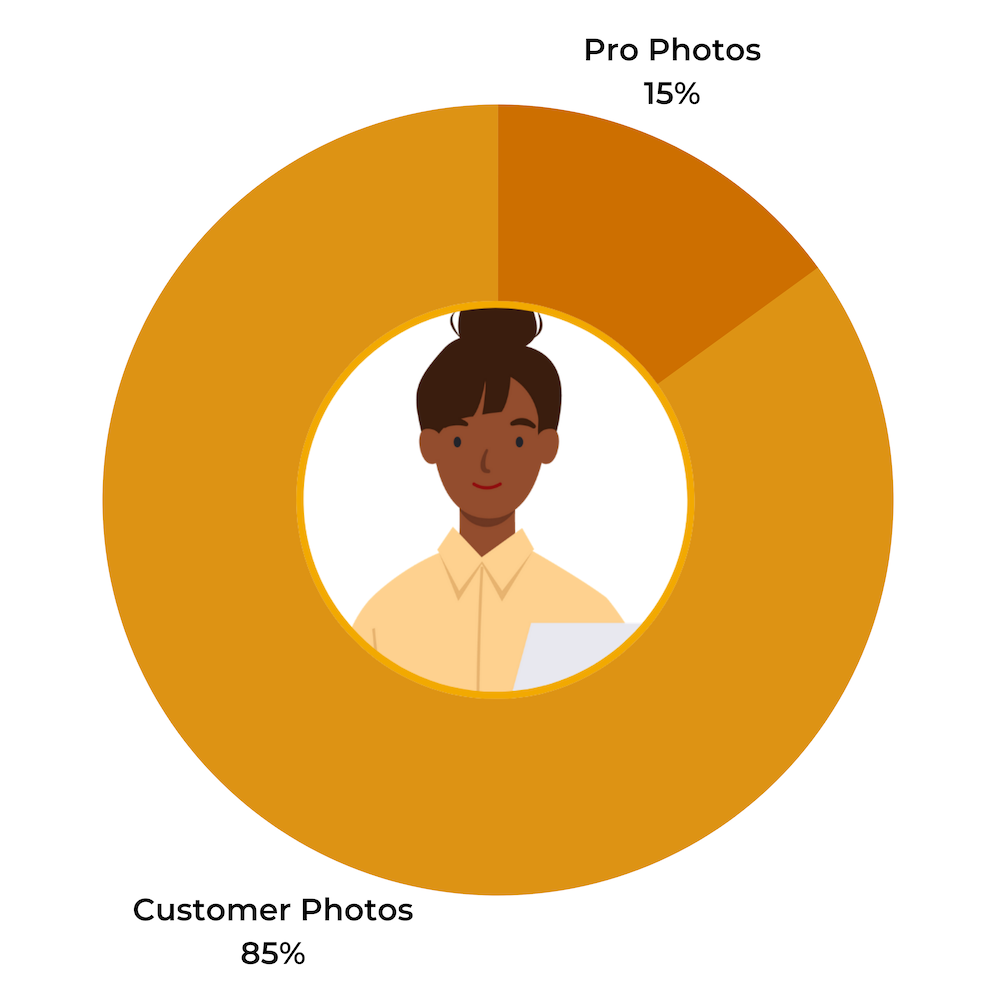
Younger consumers are more likely to value user-generated photos over that provided by brands and retailers. 91% of Gen Z shoppers and 85% of Millennials value user-generated photos more than professional ones.

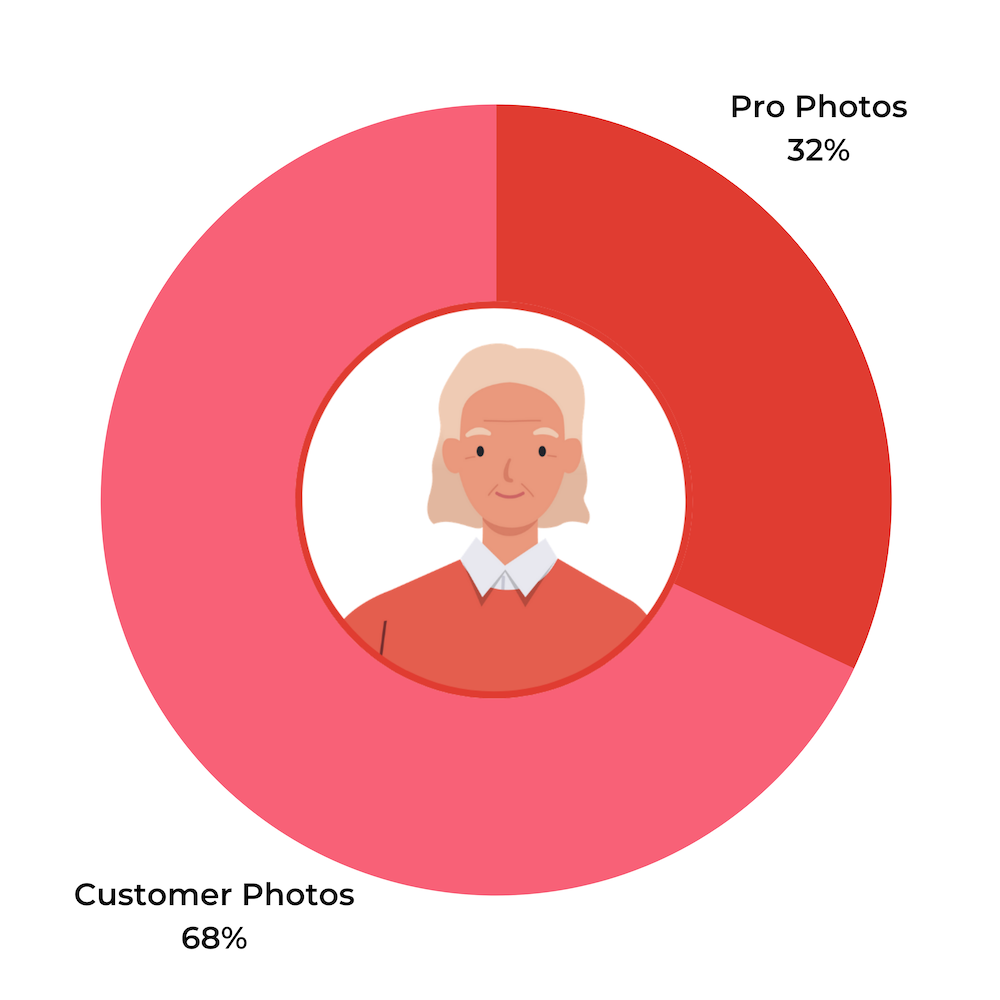
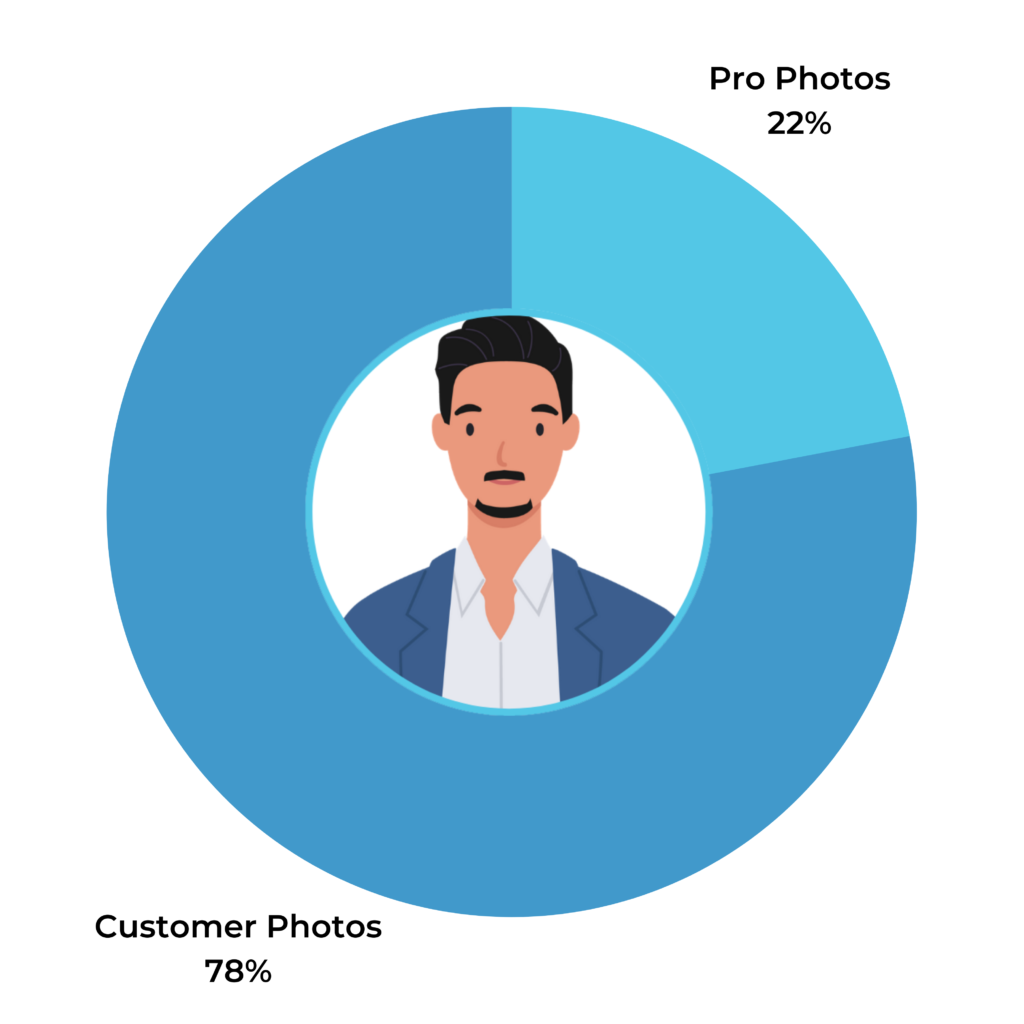
In comparison, 78% of Gen Xers and 68% of Boomers indicate that a photo supplied by another consumer is more valuable than one provided by a brand or retailer.

However, it’s important to remember that the vast majority of each generational group favors user-generated photos. Brands and retailers must make it a priority to collect and display plenty of this content — regardless of their target demographic.

Type of Photos Most Valued by Consumers
What kind of product photos are more valuable to you: professional photos supplied by the brand/retailer, or those supplied by another customer?
Boomers
Gen X
Millennials
Gen Z

How Visual UGC Impacts Purchase Behavior

Consumers of all ages seek out photos and videos supplied by other consumers. And the presence (or absence) of this content has a significant impact on purchase behavior.

User-Generated Imagery Increases Purchase Likelihood

We know that product reviews have a huge impact on whether or not a consumer purchases a product. The presence of photos and videos within those reviews makes them even more powerful.

85% of shoppers indicate they’re more likely to buy a product that has reviews that feature photos and videos in addition to written text. In 2016, 72% felt this way.

I’m More Likely to Buy a Product That Has Reviews that Feature Photos and Videos
2016
72%
2021
85%

Shoppers of all ages are swayed by the presence of user-generated visual content in reviews. But it’s particularly influential for younger shoppers.

99% of Gen Zers and 89% of Millennials are more likely to purchase products that have reviews that feature photos and videos, compared to 83% of Gen X consumers and 77% of Boomers.

I’m More Likely to Buy a Product That Has Reviews that Feature Photos and Videos
Boomers
77%
Gen X
83%
Millennials
89%
Gen Z
99%

Clearly, when shoppers see what a product looks like in real life being used by real people, it boosts their confidence and increases their likelihood to buy.

This is in line with our recent analysis that found that brands and retailers can experience a 91.4% lift in conversion when visitors engage with user-generated photos and videos (worth noting: the conversion lift is even higher for certain highly visual categories, such as apparel and home and garden).

The impact of visual content on conversion is likely to increase as photography and videography becomes more accessible and widespread.

The Absence of User-Submitted Visual Content Can Deter Customers

What’s the risk of not displaying photos and videos captured by your customers? Some shoppers simply won’t purchase products if they can’t find this content.

This is especially true for younger shoppers. A third of Gen Z shoppers and 21% of Millennials won’t purchase a product if there are no photos or videos from others who have bought the product. In comparison, 15% of Gen X shoppers and 14% of Boomers feel this way.

I Will Still Buy Products With No User-Submitted Images/Videos?
Boomers
86%
Gen X
85%
Millennials
79%
Gen Z
67%

For the majority of shoppers, a lack of user-generated photos isn’t necessarily a barrier to purchase.

However, the presence of this content can inspire shoppers and increase trust, which will then increase their likelihood of making a purchase.

So make it a priority to collect and prominently display user-generated visual content. It’s well worth the effort as you look for gains that drive bottom line impact. 

Why Consumers Value User-Generated Visual Content

Increasingly, consumers seek out authentic photos and videos submitted by their fellow shoppers. But why do consumers find this content so valuable?

Consumers Value User-Generated Visual Content for a Variety of Reasons

Top Reasons Consumers Value User-Submitted Photos and Videos
To see what the product looks like in real life
86%
To get a better sense of the size or sizing of the product
75%
It’s more authentic and “real” than standard brand-created imagery
65%
To understand how the product performs
58%
To see if the product fits your own personal need
56%
It creates trust in the product and/or brand
42%

The most popular reason — selected by 86% of survey respondents — is that this content allows shoppers to see what the product looks like in real life.

While photos and videos produced by a brand show a product in its best light, user-generated content allows shoppers to see a product being used by real people in real situations — and that gives shoppers more realistic expectations.  

Three-quarters of shoppers indicate that user-generated visual media helps them get a better sense of the size or sizing of a product. This makes sense, as it’s often difficult to gauge the size of a product — or select the right size for an item like clothing — when shopping online. 

Consumers seek out user-generated photos and videos for a number of reasons. When you showcase this content on your website, you’re equipping these shoppers with an important tool that fuels better decisions.

When User-Generated Photos and Videos Matter Most

Clearly, a growing number of consumers seek out user-generated photos and videos. And the presence (or absence) of this content impacts purchase behavior.

But does user-generated visual content matter more for certain product categories than it does for others?

User-Generated Visual Media Aids Purchase Decisions Across Many Product Categories

As it turns out, consumers value user-generated photos and videos when they’re shopping for a wide array of products. But some categories do rise to the top. 

Clothing tops the list. Over three-quarters (78%) find user-generated photos and videos valuable when shopping for clothes. Electronics is a close second. 70% of consumers value user-generated visual content when purchasing products in this category.

Consumers also value user-generated photos and videos for product categories including appliances (63%), home and garden (62%), health and beauty (60%), shoes (59%), toys (48%), computers (48%) and groceries (30%).

While it’s true that visual content is especially valuable for certain product categories, it’s important to note that a significant number of consumers value this content across all of the product categories included in this survey. Even 30% of those shopping for groceries consider user-generated visual content to be helpful when making purchase decisions!

Brands and retailers must make it a priority to collect and display user-generated content, regardless of the types of products they sell. Those that don’t risk losing customers to a brand that better meets their expectations.

Consumers Consider User-Generated Visual Content Helpful for Many Product Types
Clothing
78%
Electronics
70%
Appliances
63%
Home & Garden
62%
Health & Beauty
60%
Shoes
59%
Toys
48%
Computers
48%
Groceries
30%

6 Tips for Leveraging Visual UGC to Attract & Convert Shoppers

Visual content plays a large (and growing) role in the path to purchase. Brands and retailers must make it a priority to collect and showcase user-generated visual content in order to attract and convert the growing number of consumers who seek it out.

Read on for our six top recommendations, based on the key findings of this report.

1
Ask for Photos and Videos as Part of Reviews

Most shoppers (85% to be exact) are more likely to buy a product that has reviews that include photos and videos in addition to written text. So be sure to ask your shoppers to submit photos and videos as part of the review process. 

In your post purchase emails, make it clear that you want your shoppers to share visual content in their reviews. And make it easy for them to upload this content directly from their computer or mobile device — or even their social media profiles.

Also, experiment with asking for visual content both before and after shoppers provide reviews. Then, stick with the option that generates the highest volume of user-generated visual content. 

Allow Shoppers to Submit Visual Content Independent of Reviews

Consider giving customers the option to submit a photo or video without an accompanying rating and review. It’s an effective way to generate a high volume of user-generated visual content — quickly.

2
3
Curate Visual Photos and Videos from Social Media

Chances are, your customers are already posting photos and videos on your products in action on their own social media channels, such as Instagram. So start curating this visual content onto your own website.

Showcase Visual UGC Throughout Your Website

99% of consumers specifically seek out photos and videos submitted by other consumers. So make it easy for your shoppers to find what they’re looking for.  

At a minimum, add an image gallery to your product pages that showcases visual content submitted by those who have already purchased the product. Doing so will help shoppers understand what a product looks like in real life. An image gallery will increase shopper confidence — and those who engage with it will be more likely to convert.

In addition, consider showcasing user-generated visual content on other parts of your website. For example, consider adding shoppable user-generated visual content galleries on other key pages, including your homepage. These galleries will spark inspiration — and encourage sales.

4
5
Leverage Visual Content in Other Marketing Initiatives

Look for opportunities to enhance your marketing initiatives with photos and videos from your customers. For example, consider featuring user-generated visual content in email and digital campaigns, as well as on your own social media channels. Doing so is a great way to capture the attention of shoppers actively seeking out photos and videos from others like them.

Analyze Impact and Optimize Accordingly

It’s not enough to simply collect and display user-generated visual content and hope for the best. Instead, it’s essential to regularly analyze how this content impacts the purchase behavior of your customers. Then, you can use these insights to optimize the ways you collect and display content to drive even better results.

6

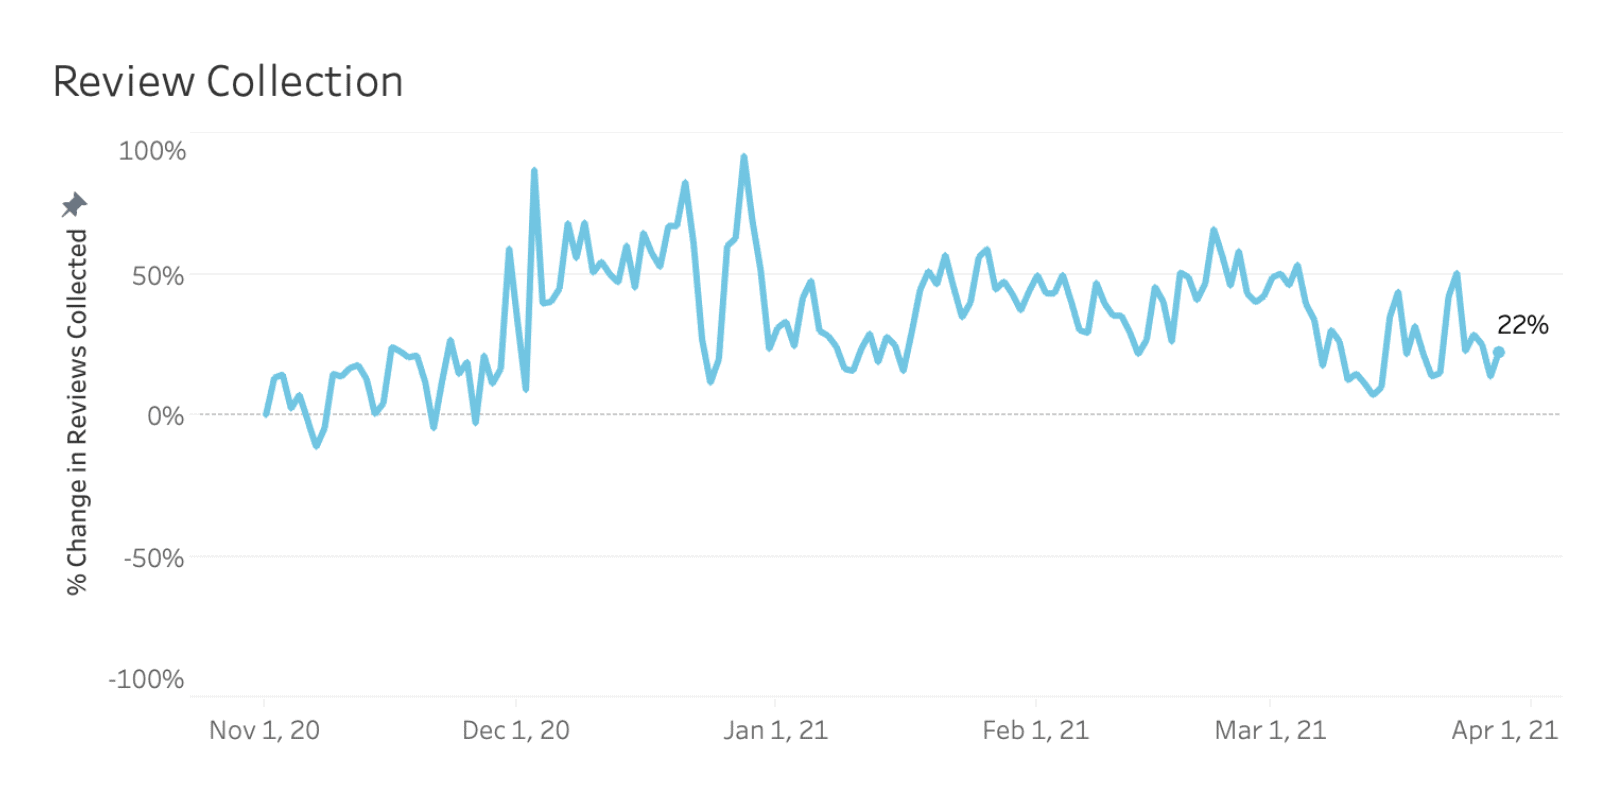
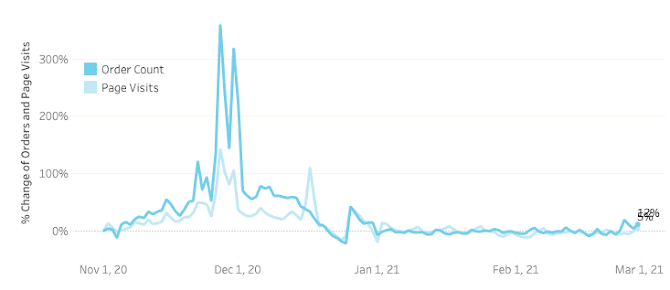
This is the PowerReviews trends snapshot for June 2021, an analysis of consumer activity across more than 1.5MM online product pages from more than 1,200 retail/brand sites over the past six months.

The headline for this edition is broadly more of the same, with ecommerce purchase volumes and Ratings and Reviews trends remaining consistent over the past couple of months.

However, the biggest trend worthy of note is that review impact on purchase journey is up on what we saw pre-Covid.

Key ecommerce market trends

01

Ecommerce purchase volumes continue to remain stable

02

Review submission levels and product sentiment also remains stable

03

Review impact on online purchase consistently 18% higher than pre-Covid

eCommerce purchase volumes continue to remain stable

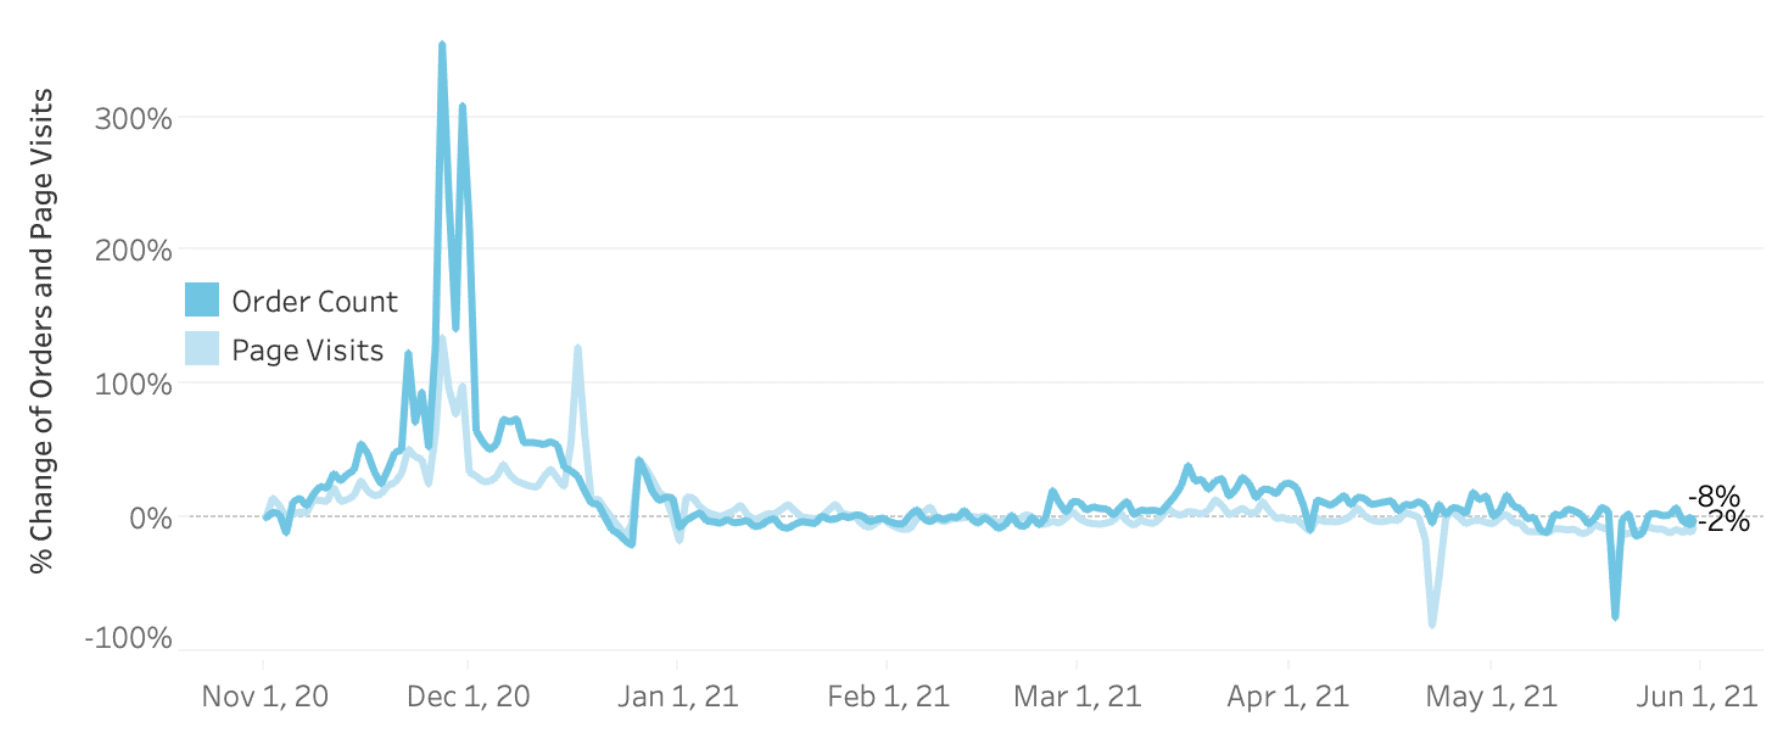
After continued stability over the past few months, April and May were a case of more of the same.

Because we measure changes over short periods, it’s worth reiterating that this increase is off a baseline of significantly higher volumes than pre-Covid. 

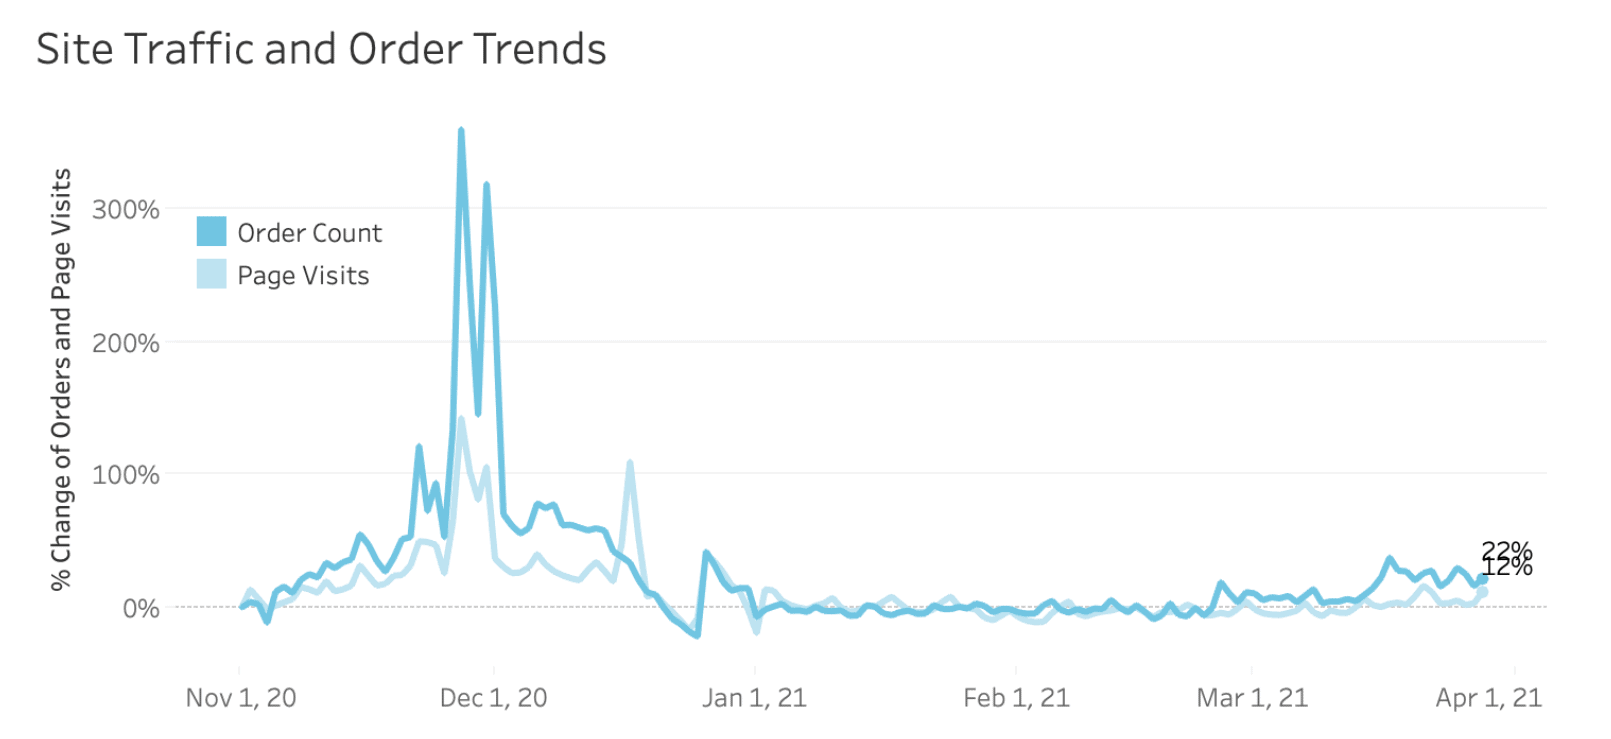
So at the risk of going old ground, we saw a huge initial surge led to an overall 3x increase in online purchase volumes between February (pre-pandemic) to May 2020 before  a steady decline and then stabilization, with purchase volumes consistently between 40% and 70% higher than they were pre-pandemic.

The Holidays resulted in the typical marked seasonal increase, before a return to post-Covid normality despite the continuing vaccine rollout where online purchase volumes were consistently in the range of 40-70% above where they were pre-pandemic.

Review submissions, length, and product sentiment remain stable

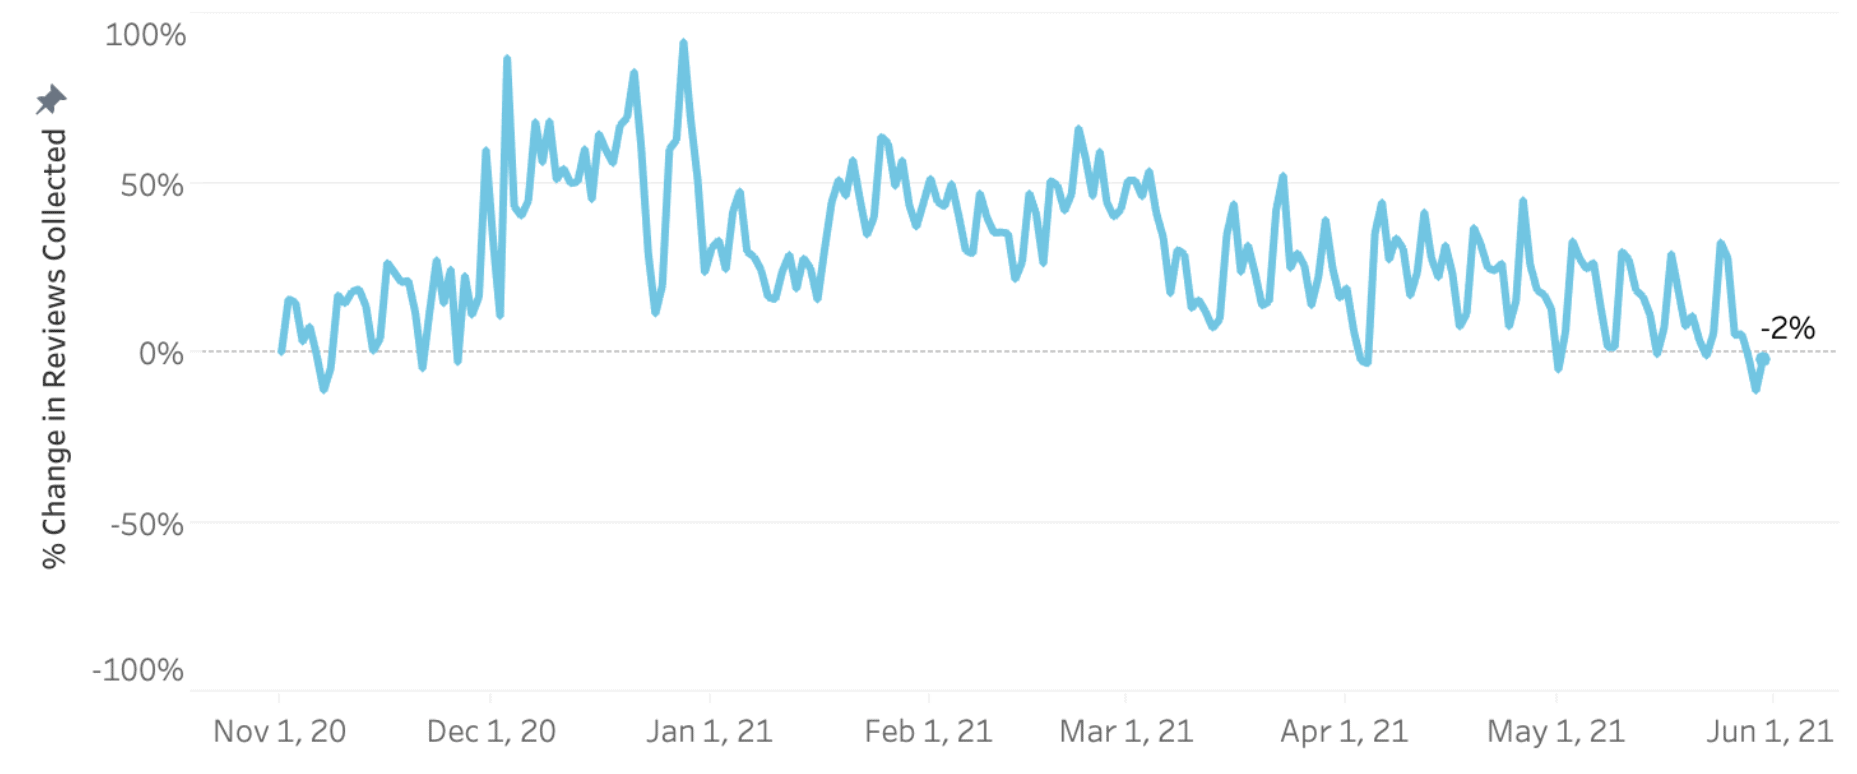
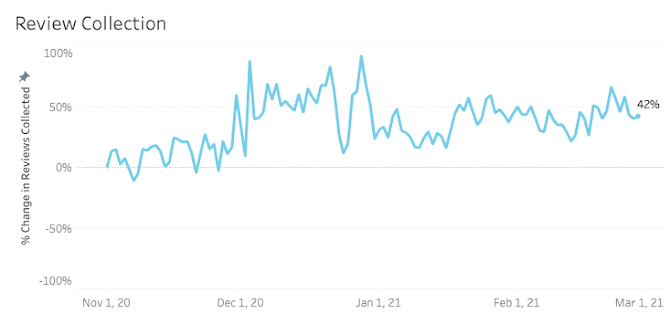
In our Post-Holiday snapshot, we highlighted a giant surge in review volumes – largely to be expected given seasonal purchase increases (hence the increase in December and January).

Since then, review submission has been unsurprisingly consistent given online purchase volumes mirrored this trend.

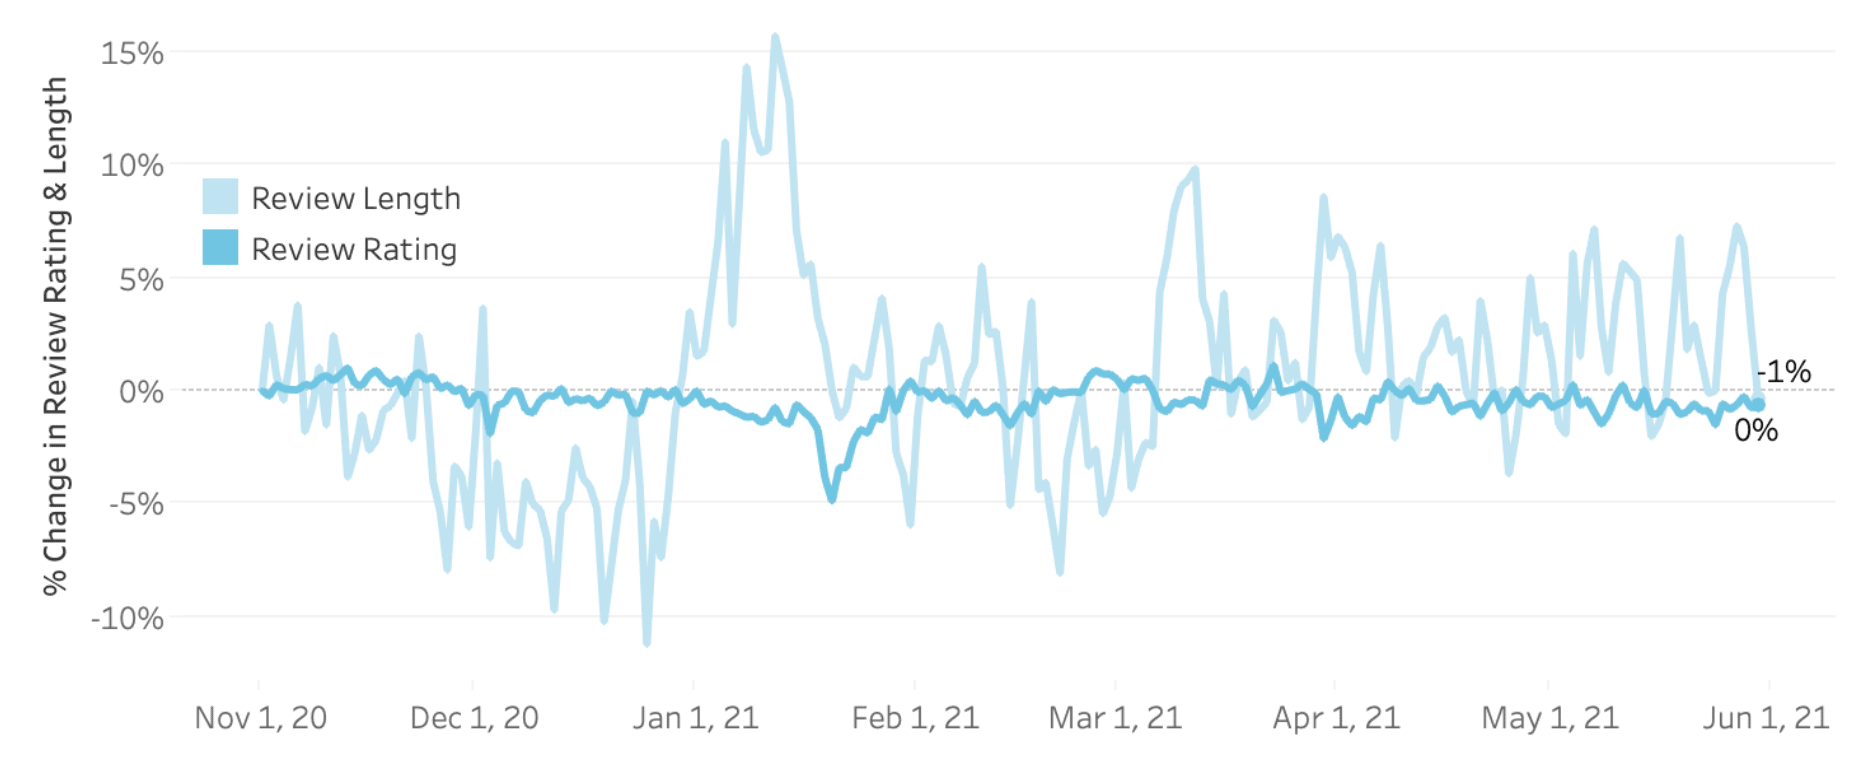
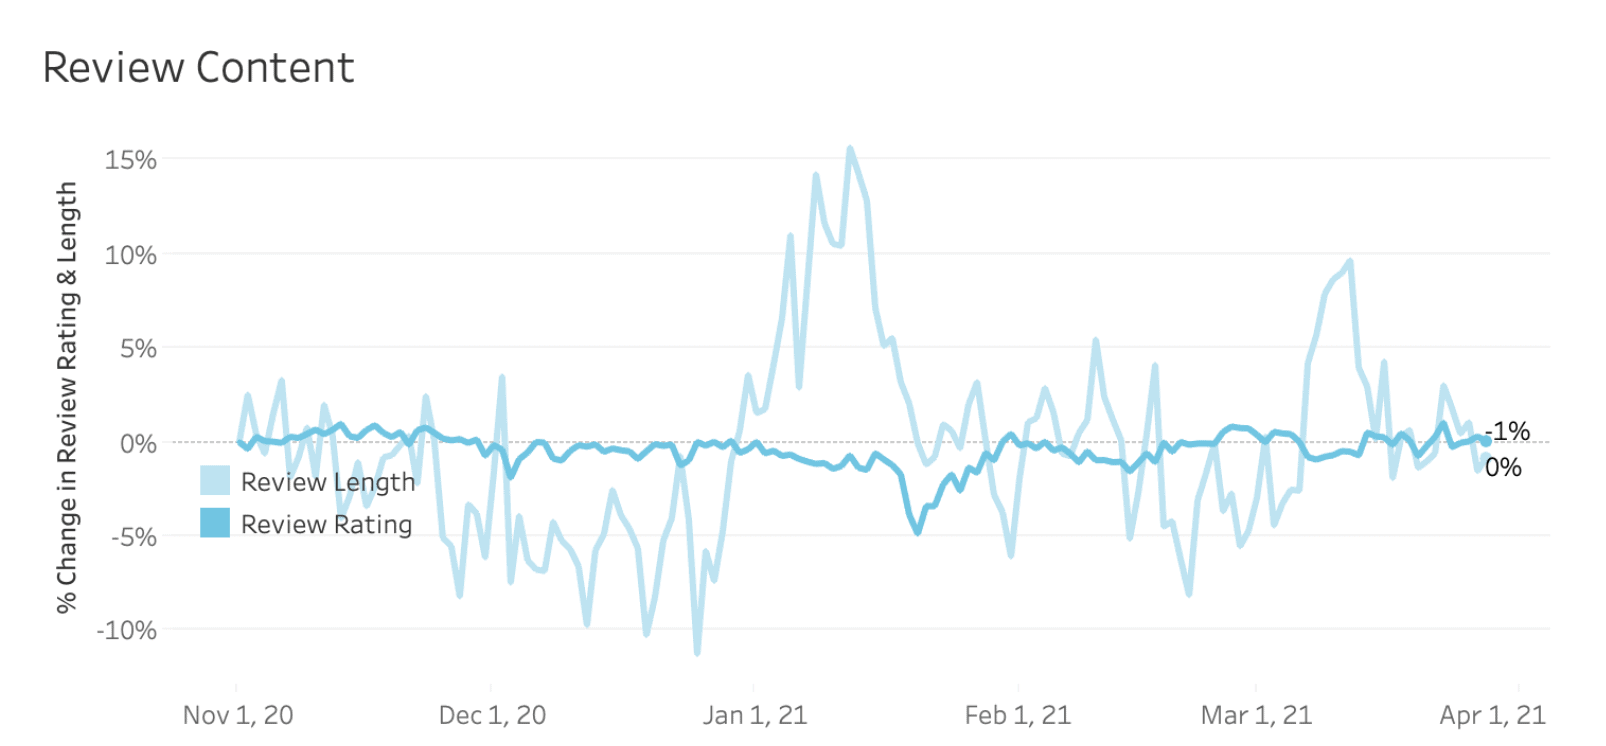
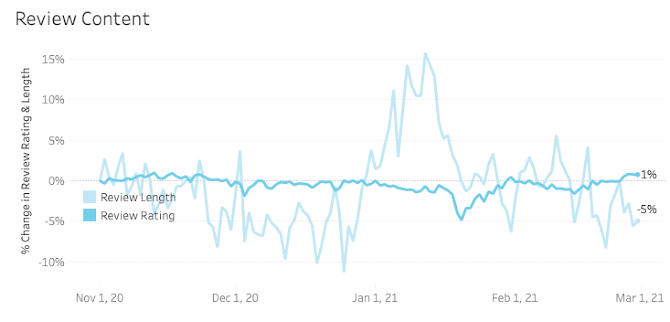
Review length and sentiment continues to be stable

At the risk of sounding like a broken record, review length and sentiment (in the form of average rating) also remains flat. This has been the case since we started our analysis over a year ago.

So although Covid’s impact on ecommerce generally has been transformational, it has not affected the content of reviews submitted by consumers.

Reviews continue to drive purchase more than pre-Covid

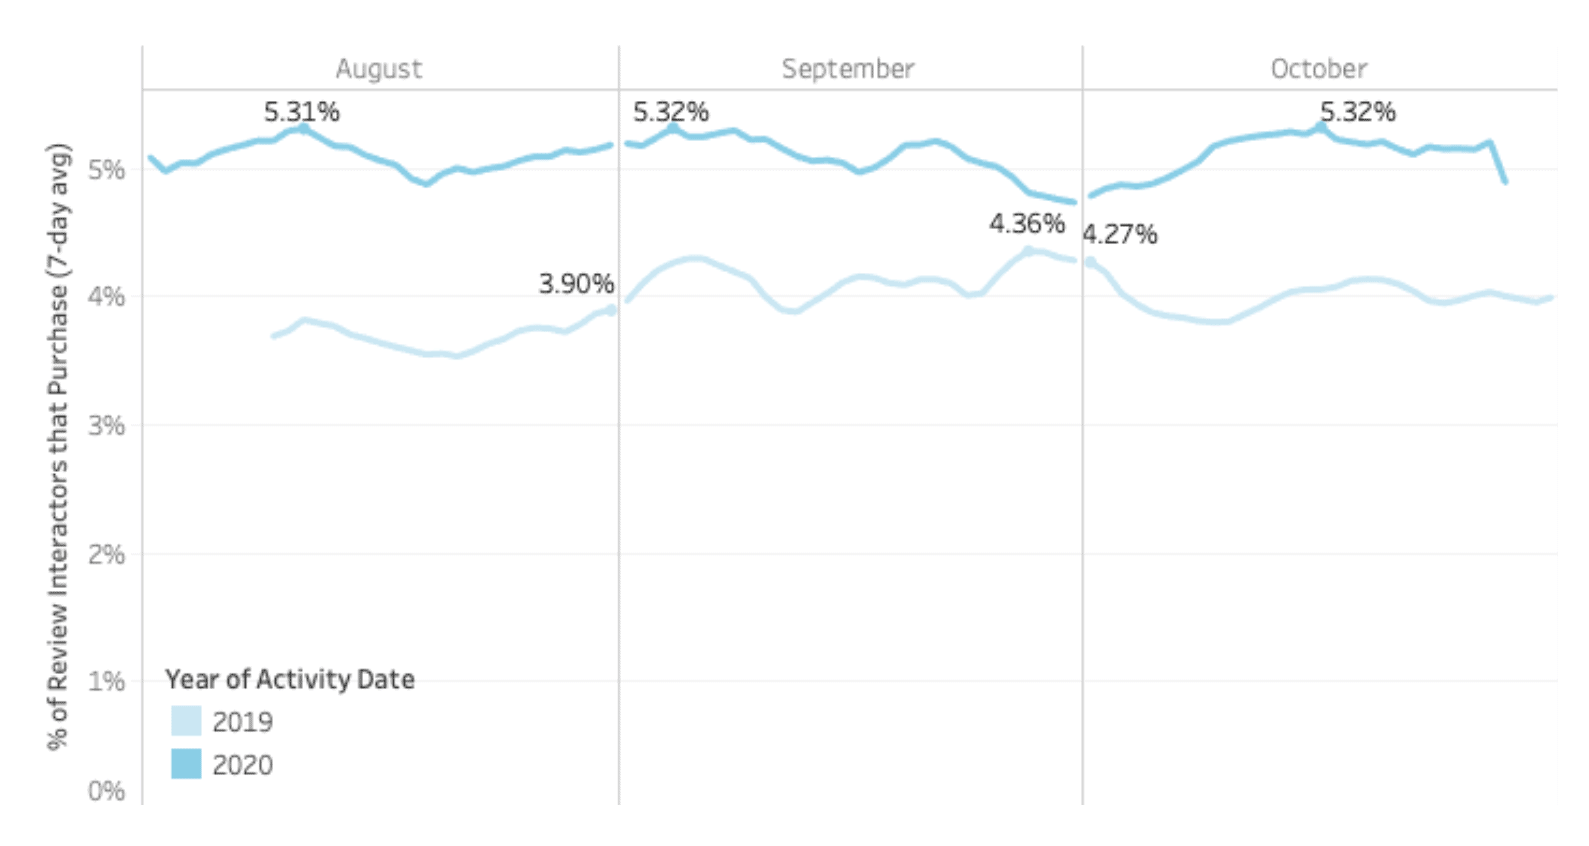
Over the last few monthly snapshots, we have included a deep dive into the impact of review content on the buyer journey – paying particularly close attention to year-on-year comparisons.

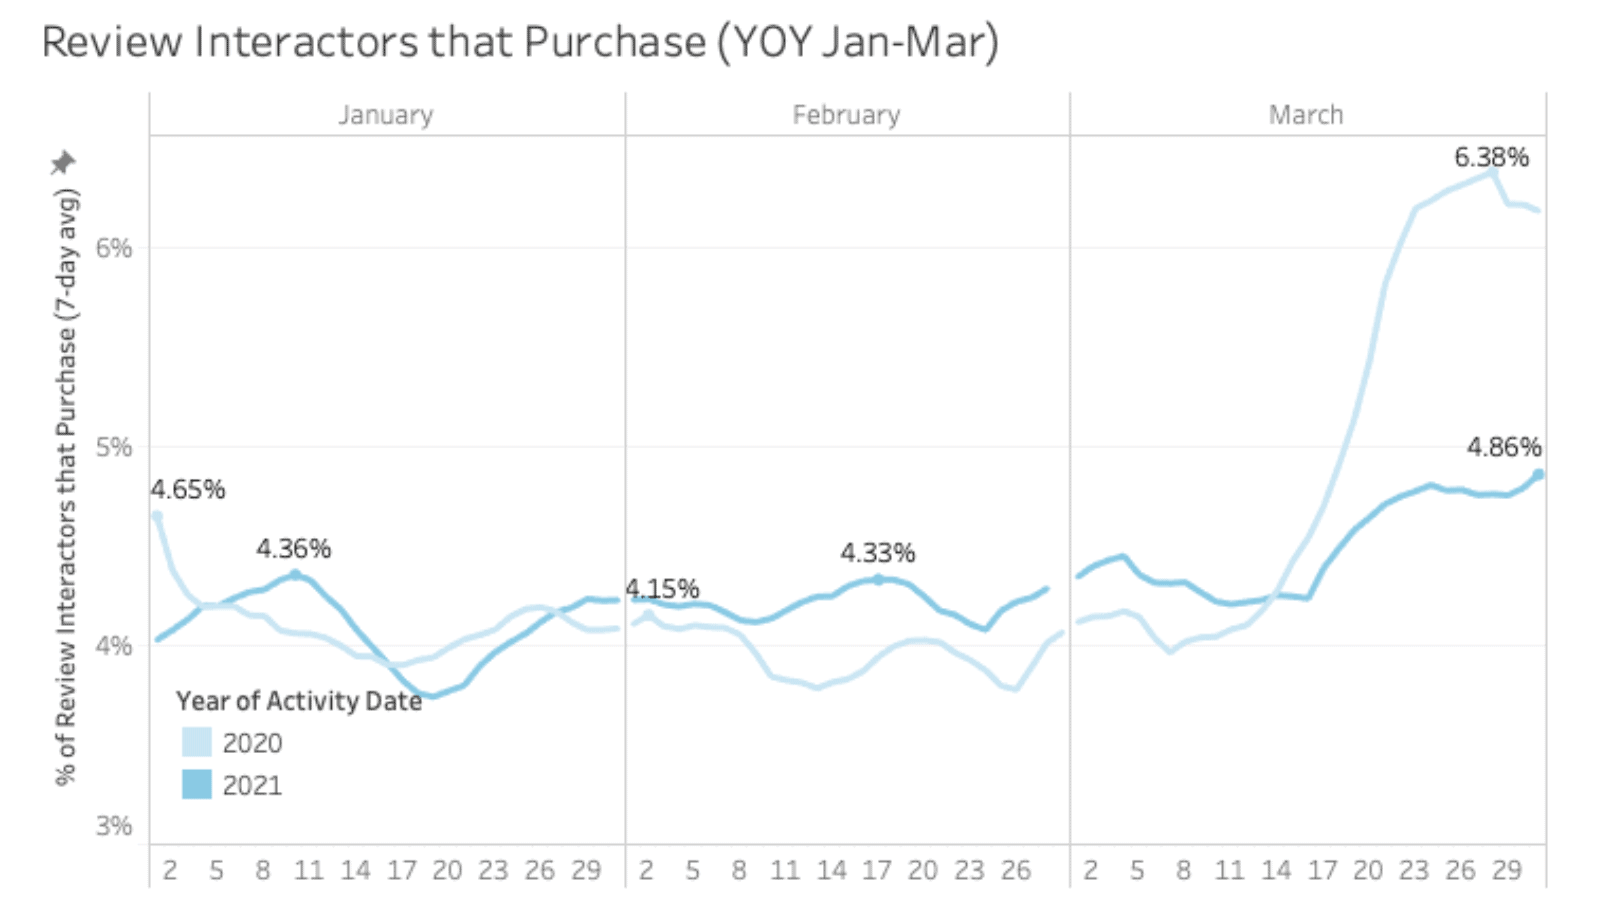
The headline from this update: Reviews are continuing to have more of an impact on the purchase than pre-Covid.

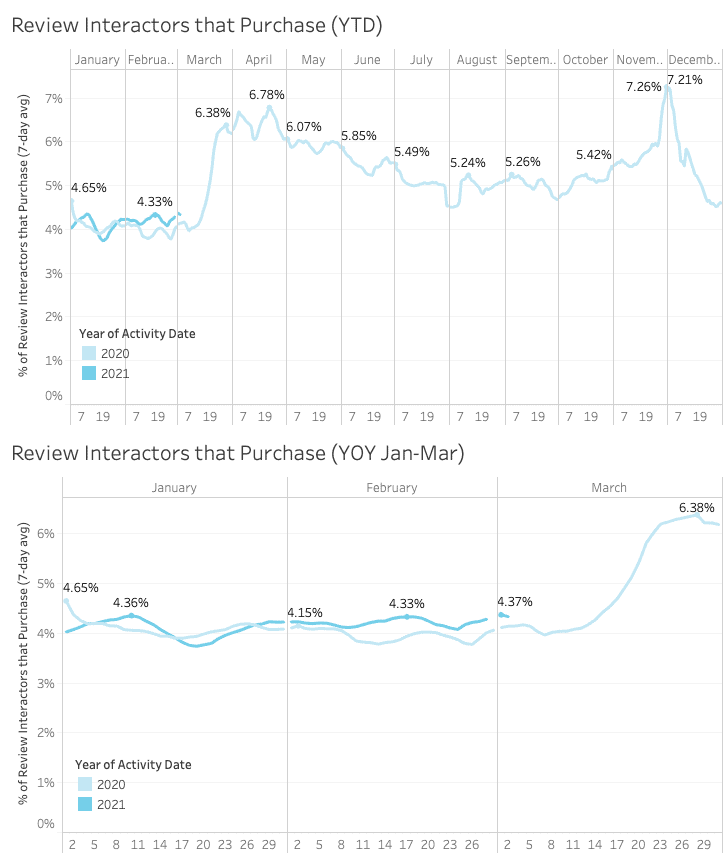
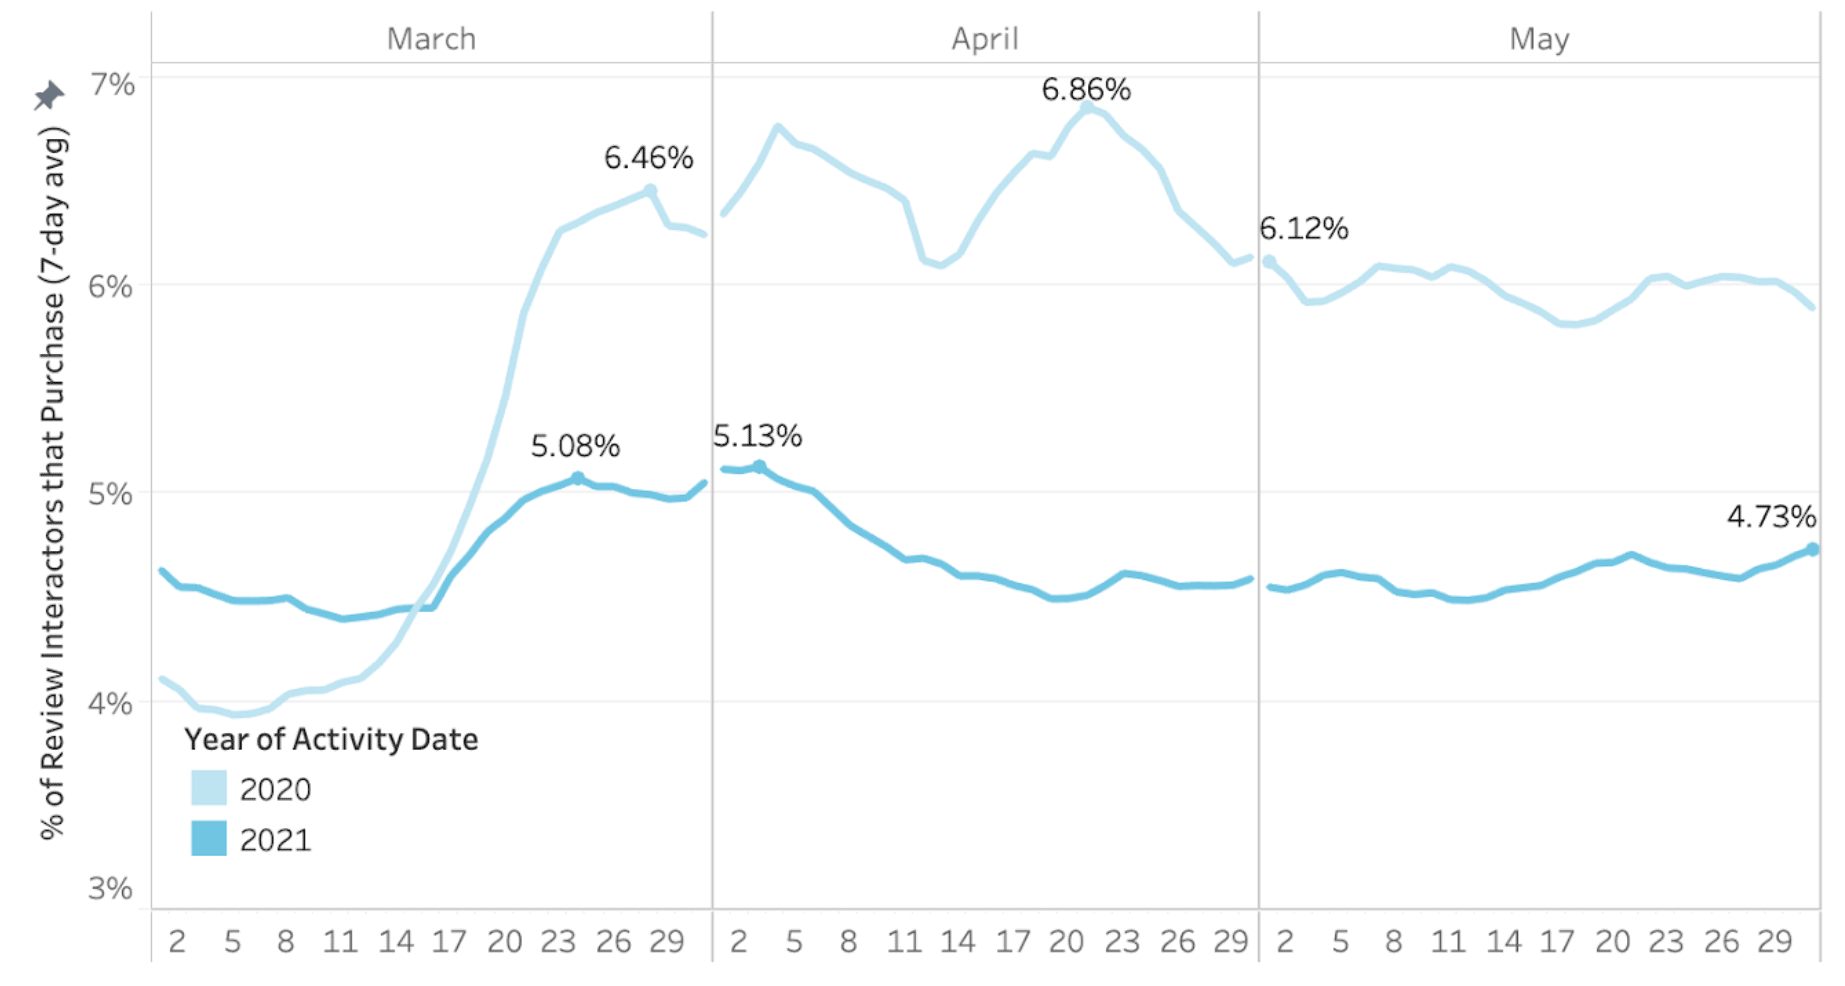
To recap, the charts in this section highlight the percentage of online shoppers who go onto purchase after they’ve interacted with review content (i.e. searched, filtered, clicked to extend the review from preview to view entire content etc.)

Although down from a pre-Holiday 2020 high of 5.25%, this figure for April and May 2021 was consistently at around 4.7% (note the 2020 line highlighted below shows the beginning of Covid, when all bets were off).

This represents an 18% increase on the roughly 4% figure that was the norm pre-Covid (as evidenced in early March 2020 below).


For more data and insight on how reviews and other forms of user-generated content impact online behavior, checkout our 2021 Conversion Impact of User-Generated Content report.

Summary

In summary, we noted the following clear trends:

  • Online purchases stable
  • Review submission levels and sentiment trends flat
  • Review impact on purchase journey up 18% pre-Covid.

As the extreme ecommerce trends evident at the start of the pandemic fade into the rear view mirror, we will be publishing a market trends update every other month – meaning our next report will be published in August.

The evolving role of ratings and reviews on the path to purchase, according to research of more than 6,500 U.S. shoppers.

Survey at a Glance:

The PowerReviews Ever-Growing Power of Reviews report is based on survey responses from 6,538 consumers across the United States. Key findings include:

Reviews have always been important to consumers. They’ve become even more important.
  • Today, more than 99.9% of consumers say they read reviews when shopping online at least sometimes. In 2018, this number was 97%. 

  • Over half (57%) of shoppers read reviews while shopping in brick-and-mortar stores to assess potential purchases.

  • 98% of consumers feel that reviews are an essential resource when making purchase decisions, up from 89% in 2018.

  • Ratings and reviews have become the most important factor impacting purchase decisions, ranking above price, free shipping, brand and recommendations from family and friends. In similar surveys we fielded in 2014 and 2018, price was the most important factor. 
Shoppers choose websites based on the availability of reviews.
  • 79% of consumers specifically seek out websites with product reviews, up from 63% in 2018. Millennials are the generation most likely to seek out websites with product reviews — 85% do so.

  • The most popular places for shoppers to read reviews include Amazon (95%) retailer websites (93%), brand websites (68%) and search engines (65%).  
Review quality, quantity, and recency all matter to shoppers.
  • 77% of consumers say the average star rating is an element they consider when reading reviews. But 52% don’t trust star ratings without accompanying review content.

  • The greatest portion of consumers (53%) read between one and 10 reviews. Yet 68% say that in an ideal world, a product would have 26 or more reviews. 

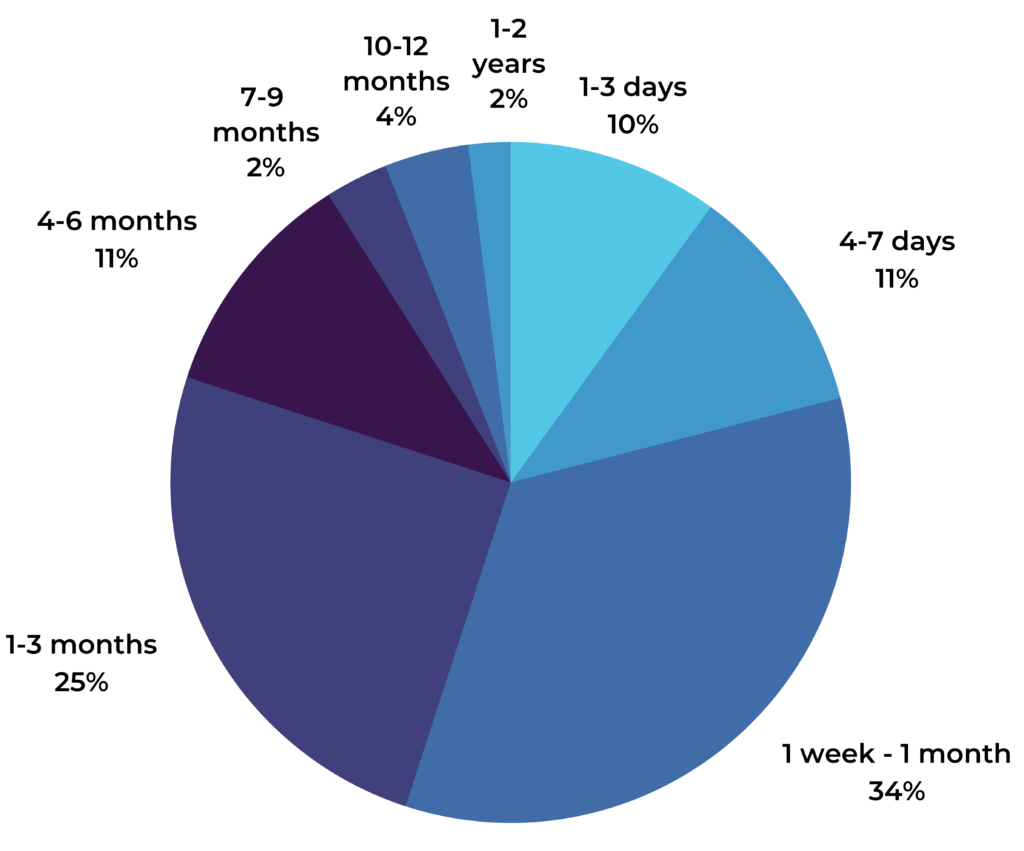
  • 71% consider recency when reading reviews. The biggest portion of shoppers (34%) look for reviews for a product that are between a week and a month old. A quarter look for reviews that are between one to three months old.
Negative reviews are an important tool for modern shoppers.
  • 96% of consumers specifically look for negative reviews at least sometimes. In 2018, that number was 85%. 

  • Over half (52%) of shoppers specifically seek out one-star reviews. This number is even higher — 60% — among Millennial shoppers.

  • 46% of shoppers are suspicious of products with an average star rating of five out of five. This number is even higher — 53% — among Gen Z shoppers. 
Introduction

Reviews are Ubiquitous

In the long history of commerce, reviews are a fairly new concept. But it’s one that’s certainly caught on quickly.

Today, it’s common for consumers to consult reviews when they’re shopping for products, looking for restaurants, weighing their options for their next vacation, or even selecting a care provider for their child. And that’s just a few of the many scenarios in which people seek out reviews to guide decisions.

Consumer dependence on reviews continues to grow. When we surveyed consumers in 2018, we found that 97% consulted reviews — and 89% considered this content to be an essential component of the purchase journey.

Today, nearly all consumers — 99.9% — read reviews, and 98% consider them to be essential. That’s because reviews are an authentic, unbiased source of information that empowers shoppers to make informed purchase decisions.

For Businesses, Reviews are no Longer Optional

A growing number of consumers value reviews. As such, brands and retailers must make it a priority to provide easy access to this content. In fact, according to Forrester, reviews have become table stakes.

There’s a big upside for businesses that collect and display reviews. Our recent analysis of 1.5MM online product pages from more than 1,200 brand and retailer sites found that there’s a 120.3% lift in conversion when a shopper interacts with ratings and reviews on a product page. 

There’s a 120.3% lift in conversion when a shopper interacts with ratings and reviews on a product page

If you don’t provide your shoppers with the content they seek, you risk losing customers — possibly for good. As you’ll see as you read through this report, a staggering 86% of online shoppers (and 51% of those who shop in-store) say they simply won’t buy products without reading reviews first. 

It’s Time to Make Reviews an Integral Part of Your Business Strategy

Brands and retailers must effectively leverage reviews in order to attract and convert shoppers. But first, it’s important to take a step back and understand the role of reviews in the path to purchase — and how that role has evolved over time. 

PowerReviews surveyed more than 6,500 U.S. consumers with the goal of understanding the value they place on reviews — and how the presence (or lack of) this content impacts shopping behavior online and in-store. We also wanted to understand how the role of ratings and reviews has evolved in the three years since we fielded a similar survey, and you’ll find comparisons noted throughout this report. 

This report shares the findings from this survey and offers data-based recommendations for brands and retailers looking to more effectively leverage reviews to meet customer expectations and – in doing so – boost their bottom lines.

Who We Surveyed

Generations

Gen Z
(1997-present)
1%
Millennials
(1981-1996)
44%
Gen X
(1965-1980)
40%
Baby Boomers
(1946-1964)
15%

Household Income

Growing Dependence on Reviews

Traditionally, if a consumer wanted to hear about the experiences of other shoppers, they’d ask their family and friends. But today, a growing number of consumers seek out the opinions of fellow shoppers by reading reviews.

Nearly all Online Shoppers Use Reviews

Over the last decade, ecommerce has experienced significant growth in line with the increasing  influence of technology and the internet on everyday lives.

At the same time, shopper dependence on reviews has also grown. And this is no coincidence. When consumers are shopping online, they don’t have the opportunity to see and touch a product in person before making a purchase. So reading about the experiences of others like them becomes more important.

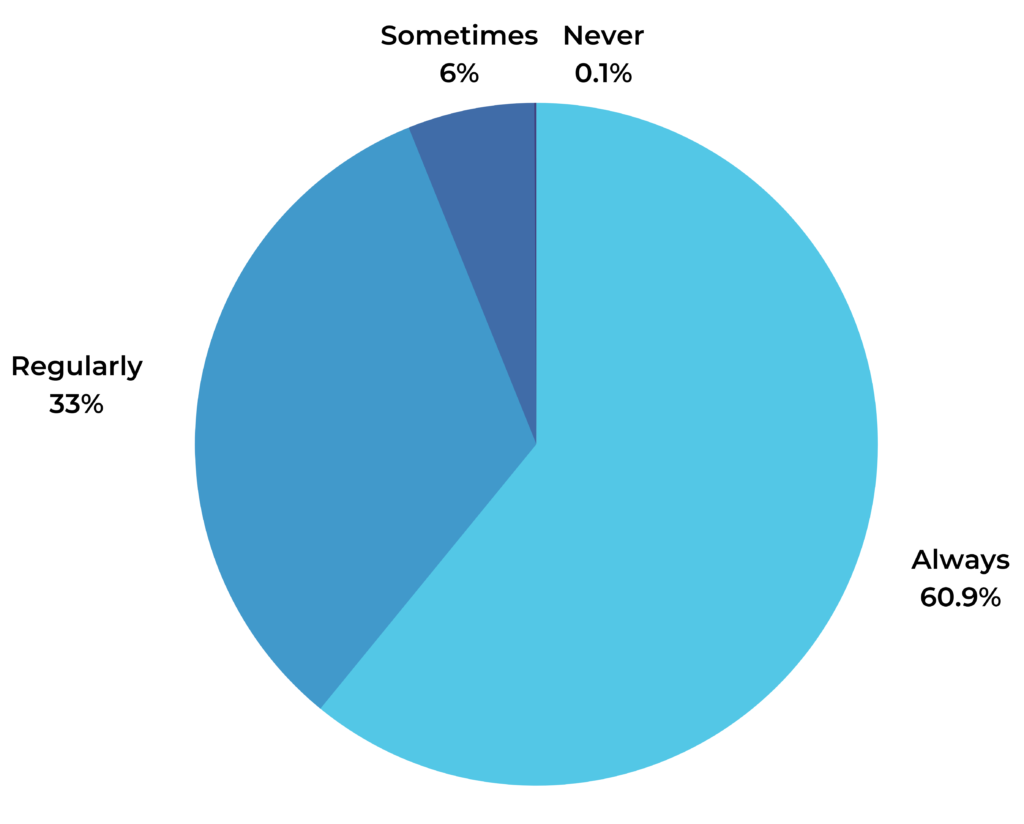
In 2018, 97% of consumers consulted product reviews when making purchase decisions, up two percentage points from 2014. Today, 99.9% of consumers say they read reviews when shopping online at least sometimes. Of those shoppers, 61% say they always read reviews and a third indicate they do so regularly.

Dependence on Reviews is Growing
Percentage of consumers that consult reviews when shopping online
2014
95%
2018
97%
2021
99.9%
How Often Online Shoppers Read Reviews

In-Store Shoppers Use Reviews, Too

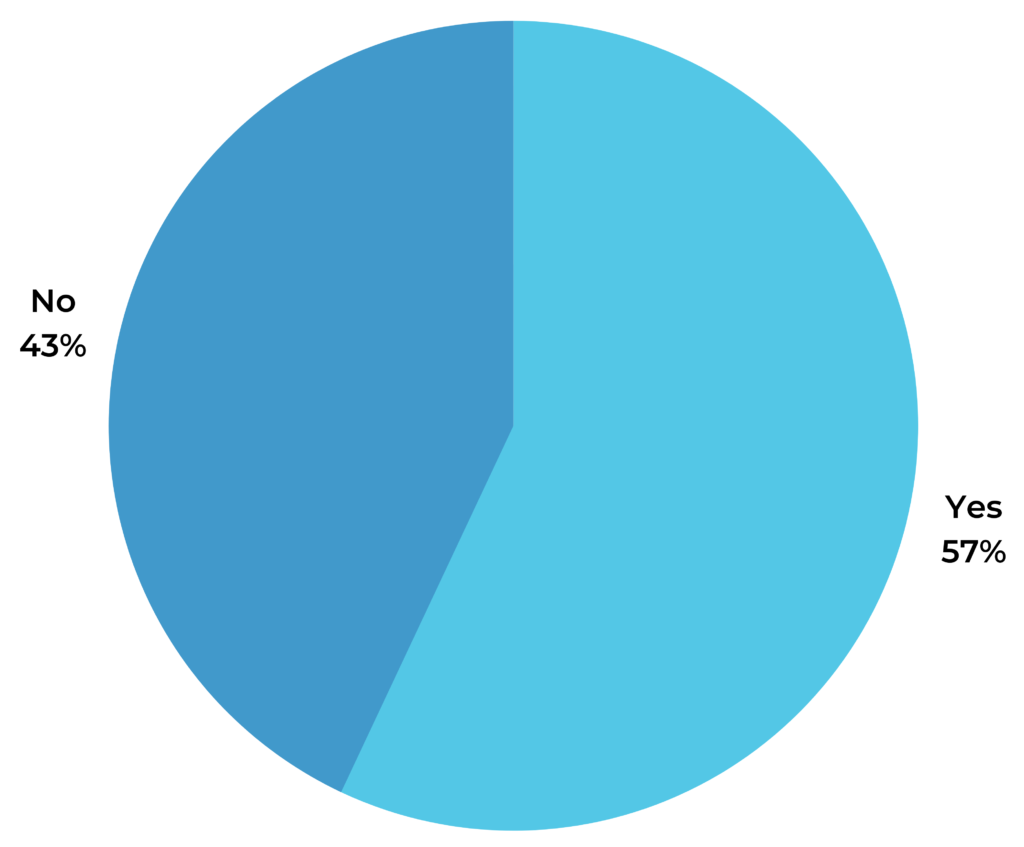
Clearly, reviews are important for online shoppers. But consumers also turn to reviews when they’re shopping in physical store locations. In fact, over half (57%) of shoppers indicate they read reviews while shopping in brick-and-mortar stores to assess potential purchases. 

Of note, Millennials are the generation most likely to check reviews while shopping in-store. 63% do so. In comparison, just over a third of Boomers read reviews in-store.

In-Store Dependence on Reviews
Do you read reviews while shopping in stores to assess potential purchases?
In-Store Dependence on Reviews By Generation
Gen Z
Millennials
Gen X
Boomers

Reviews have become an important tool for online and in-store shoppers alike. Customer-centric brands and retailers must ensure shoppers can easily access review content — regardless of the device they use to shop.

Reviews Have Become Essential

There was a time when reviews were considered a “nice to have.” But they’ve quickly become a key component of the shopping journey.

Today, nearly all (98%) of consumers indicate that reviews are an essential resource when making purchase decisions. In comparison, 89% of consumers felt this way in 2018.

Percentage of consumers who say reviews are an essential resource when making purchase decisions
2014
86%
2018
89%
2021
98%
How Reviews Impact Purchase Decisions

We know that nearly all online shoppers read reviews — and half of in-store shoppers do so. This content also has a strong influence on purchase behavior.

Reviews are the Top Purchase Consideration

There are myriad factors shoppers must weigh when making purchase decisions, including price, brand and return policy — just to name a few. But which factors carry the most weight when it comes time to make a purchase decision? 

In year’s past, consumers indicated that reviews were the second most important factor — with price being the top consideration. But this year, we found that ratings and reviews have actually surpassed price as a top purchase consideration! 

The presence of reviews also has a bigger impact on purchase behavior than other important factors including free shipping, brand and even recommendations from family and friends.

Top Factors Impacting Purchase Decisions
Ratings & Reviews
94%
Price of the product
91%
Free shipping
78%
Brand of the product
65%
Recommendation from friends/family
60%
Imagery provided by people who have previously purchased the product
52%
Imagery provided by the brand or retailer
46%

Shoppers are Reluctant to Make Purchases without Reading Reviews

Reviews are so influential that many shoppers simply won’t make purchases without reading this content first. In fact, 86% of consumers don’t purchase products online without reading reviews, up from 70% in 2018. 

And today, 51% don’t buy products in brick-and-mortar stores without first reading reviews. In comparison, just over a third (39%) of shoppers indicated this was the case in 2018.

A Growing Number of Shoppers Won’t Buy Products Without First Reading Reviews
I don’t buy products online without reading reviews.
2018
70%
2021
86%
I don’t buy products in-store without reading reviews.
2018
39%
2021
51%

The Absence of Reviews Deters Shoppers

What’s more, nearly half (44%) of consumers won’t purchase a product if there are no ratings or reviews available for it. Younger generations — Gen Z and Millennials — are even more likely to abandon a purchase if there are no reviews available for a product they’re considering.

Many Shoppers will Abandon a Purchase if There are No Reviews Available
If there are no ratings and reviews for a product, would you still buy it?
Gen Z
Millennials
Gen X
Boomers

However, it’s worth noting that 59% of shoppers indicate they’re more likely to buy a product without reviews if other products from the same brand have high overall ratings. Of course, it’s important to generate reviews across your entire product catalog. However, it’s clear that a strong online reputation can help you earn the trust of shoppers — even when you haven’t yet generated reviews for a given product. 

When Reviews Matter Most

Reviews empower consumers to make informed purchase decisions, whether they’re shopping online or in-store. But are there certain circumstances when reviews are especially important?  

Reviews Matter for High Priced Products

There’s a certain amount of risk involved with buying a new product. No matter how much research a shopper has done, there’s no sure way of knowing that a product will fit their needs. The risk is even higher if the product is expensive. 

So it’s probably not surprising that 80% of consumers indicate that the more expensive a product is, the more they read reviews. This aligns with research we did with Northwestern University, which found that reviews are especially impactful for high consideration items, which are defined as those that pose a risk due to a number of factors, including expense.

Interestingly, the higher a consumer’s income, the more likely they are to agree that the more expensive the product, the more they read reviews.

Reviews Matter for Expensive Products: A Breakdown by Income Level
Percentage of consumers who read more reviews, the more expensive the product
$0-$25,000
73%
$26,000-$50,000
79%
$51,000-$75,000
81%
$76,000-$100,000
82%
$100,001 and up
84%
Income not stated
77%

In addition, the younger the consumer, the more likely they are to indicate that they read more reviews for expensive products.

Reviews Matter for Expensive Products: A Breakdown by Generation
Do you read more reviews for expensive products?
Gen Z
Millennials
Gen X
Boomers

Reviews are Essential for Myriad Product Categories

Consumers turn to reviews when shopping for a variety of different types of products. But do reviews matter more for specific product categories?

The top product category for review consumption is electronics; 95% of consumers indicate that reviews are helpful when shopping for these products. Electronics are typically high priced products, so this aligns with our previous finding about reviews being more important for expensive items.

Consumers also value reviews for categories including appliances (87%), health and beauty (83%), computers (81%), clothing (75%), shoes (68%), home and garden (67%), toys (54%), groceries (42%) and baby (40%).

Consumers Consider Reviews to Be Helpful for Many Product Types
Electronics
95%
Appliances
87%
Health & Beauty
83%
Computers
81%
Clothing
75%
Shoes
68%
Home & Garden
67%
Toys
54%
Groceries
42%
Baby
40%

Clearly, reviews matter across a wide array of product categories. So it’s essential to collect and display plenty of this content, regardless of the types of products you sell.

Where Shoppers Consume Reviews

The presence of reviews impacts where consumers choose to shop. And when they shop on websites and apps with reviews, they’re more likely to convert.  

Consumers Seek out Websites with Reviews

When shopping online, 79% of consumers specifically seek out websites with product reviews. This is up from 63% in 2018 and 57% in 2014.

Percentage of Consumers Who Specifically Seek Out Websites With Reviews
2014
57%
2018
63%
2021
79%

Notably, 85% of Millennials seek out websites with reviews, compared to 70% of Boomers.

Online Shoppers Seek Out Websites with Reviews by Generation
Gen Z
Millennials
Gen X
Boomers

And when mobile shoppers find reviews, they’re more likely to convert. 88% of consumers indicate they’re more likely to purchase an item when shopping from a mobile device if a website or mobile app incorporates product reviews. In 2018, just over three quarters (77%) of mobile shoppers indicated this was the case. And in 2014, the number was 70%.

Percentage of Consumers Who Say they are More Likely to Convert on Mobile Websites and Apps that Include Product Reviews
2014
70%
2018
77%
2021
88%

Consumers Read Reviews on Various Websites

Shoppers seek out websites with reviews. But what are the most popular sites for consuming reviews? 

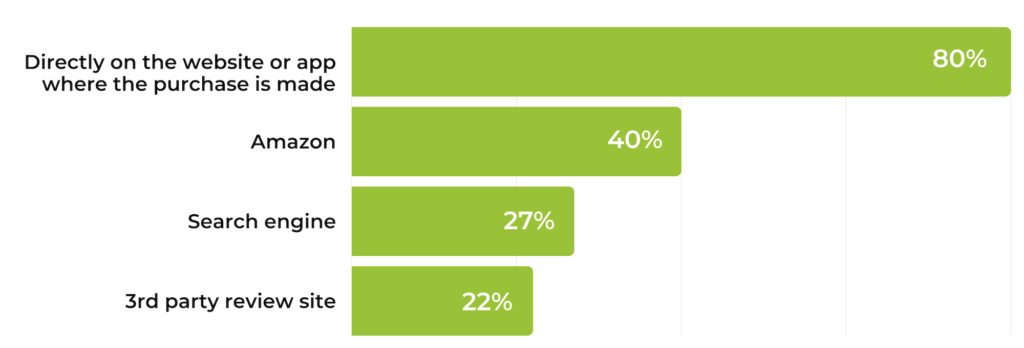
It’s probably not surprising that Amazon tops the list, with 95% of consumers indicating they read product reviews there. However, retail websites (for example, Target.com and Walmart.com) are a close second; 93% of respondents say they read reviews on these sites. And brand websites — such as Gap.com and Nike.com — aren’t far behind.

Where Consumers Read Reviews
Amazon.com
95%
Retail websites (Target.com, Walmart.com etc)
93%
Brand websites (the exact brand that manufactures the product - Nike, Levi, etc)
68%
Search engines
65%
Independent review sites
42%
How Shoppers Engage with Reviews

We know that the majority of shoppers are reading reviews on Amazon, retailer and brand sites. Now, let’s take a closer look at how shoppers are engaging with this content once they’ve found it. 

Most Consumers Read 1-10 Reviews

The majority of online shoppers (and half of in-store shoppers) read reviews. But how many reviews do they typically read before making a purchase?

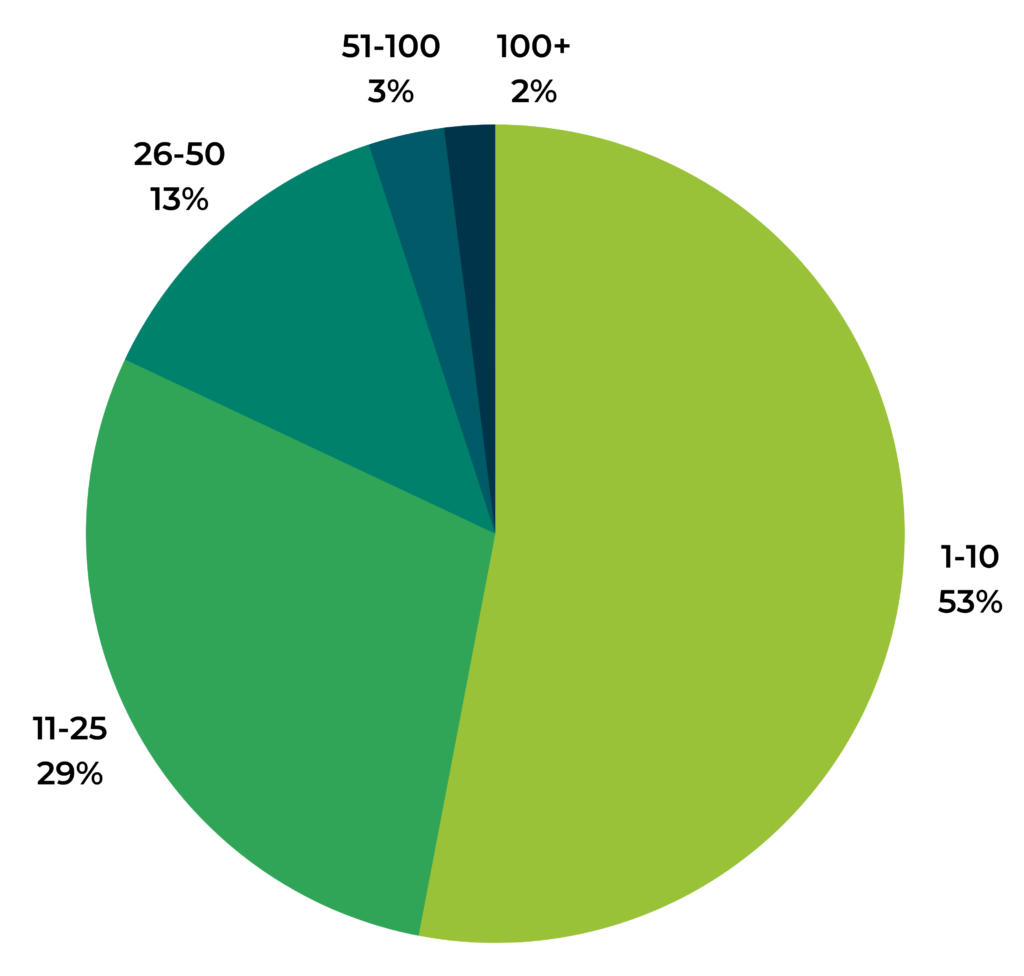
The greatest portion of consumers (53%) read between one and 10 reviews, and an additional 29% read between 11 and 25 reviews. The remaining 18% of consumers read 26 or more reviews.

Of course, the quantity of reviews a shopper reads varies depending on the product they’re purchasing. For example, a shopper probably reads more reviews when purchasing a computer than they do when purchasing a new toothbrush. So it’s important for brands to focus both on review coverage (the number of products that have reviews) and review quantity.

Quantity of Reviews Consumers Read Before Making a Purchase

Shoppers Value Review Search Functionality

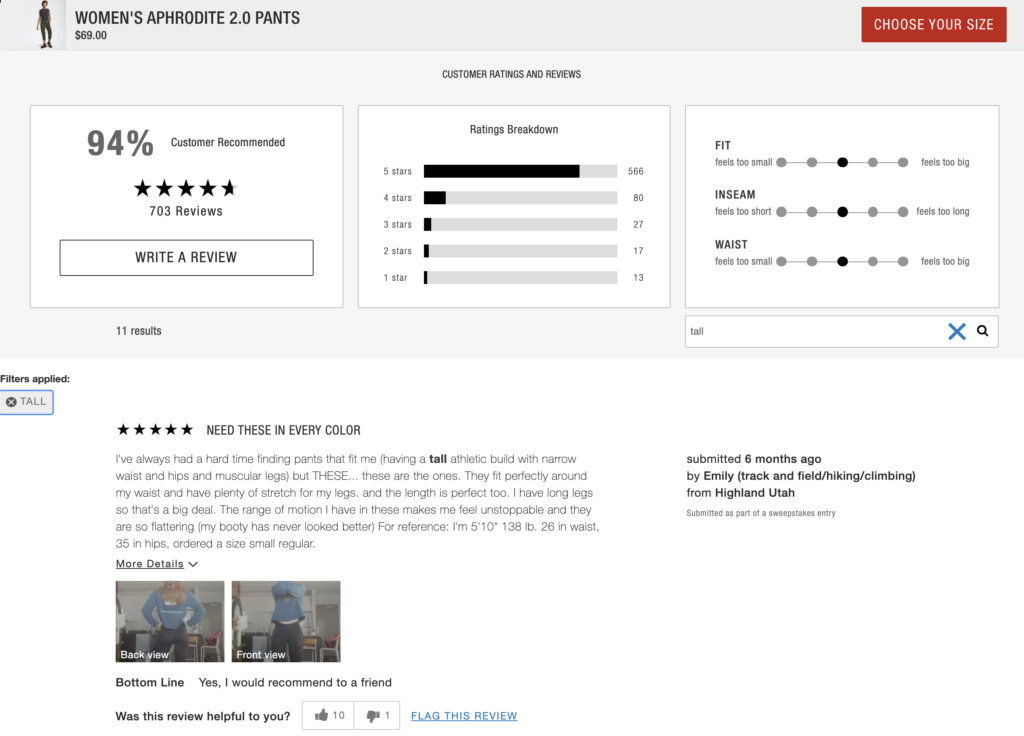
Some review displays offer a search feature that allows shoppers to find existing content that’s relevant to them. For example, let’s say a consumer is shopping for a pair of athletic pants. 

She’s tall, and she wants to know how a particular pair of pants have worked for others of similar height. So she types “tall” into the search box and finds reviews that specifically address this.

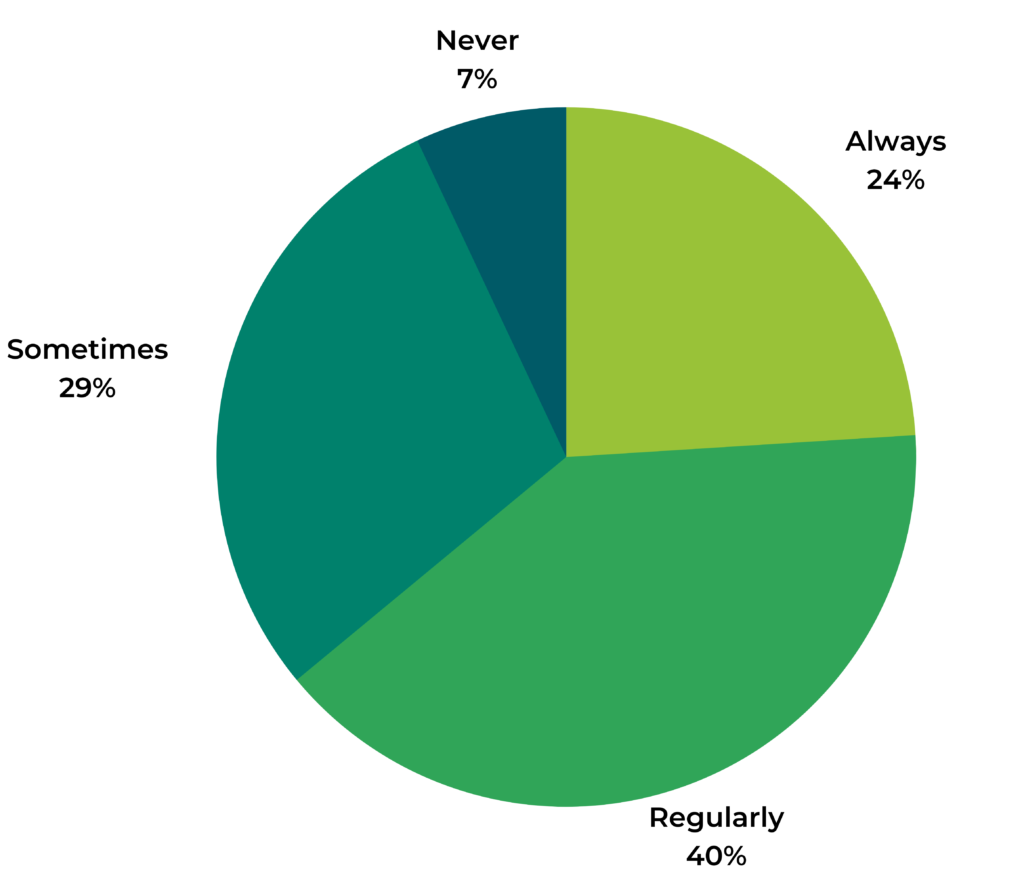
When there’s a search option available, 93% of consumers indicate they’ll use it at least sometimes. And 64% say they use this feature regularly or always. 

Many Consumers Use Review Search Functionality, When it’s Available

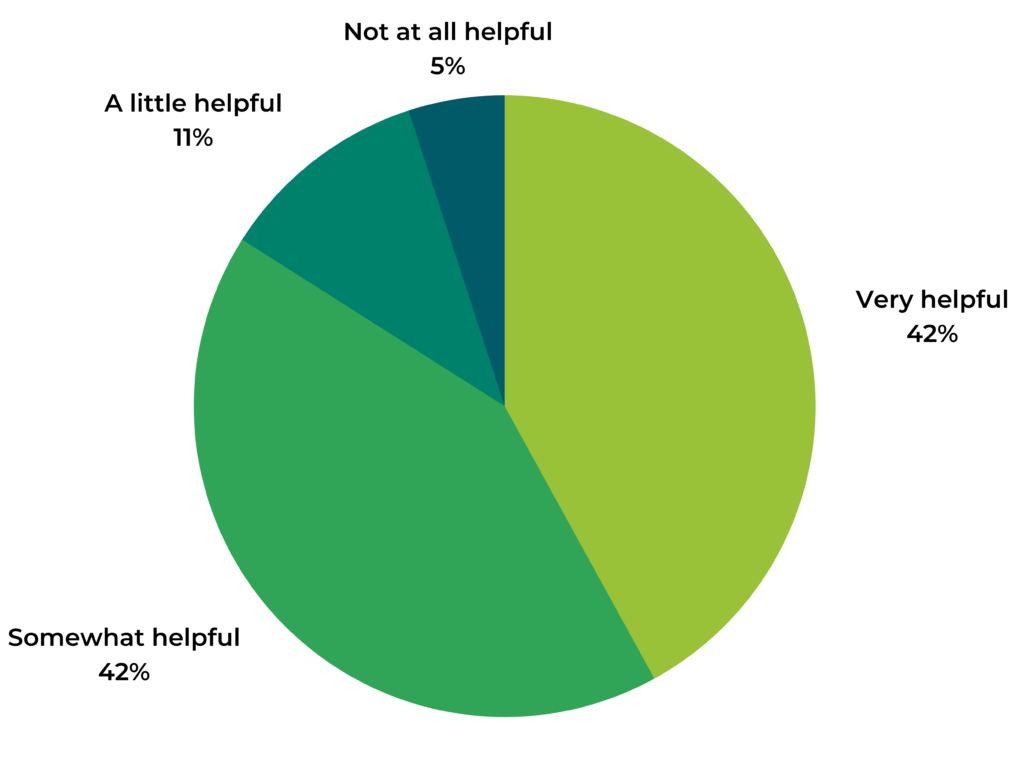
What’s more 84% of shoppers find the search feature at least somewhat helpful when assessing potential purchases. And 42% consider the ability to search through existing reviews to be very helpful.

How Helpful is Review Search Functionality?

It’s great news that so many shoppers use and value review search. After all, our previous analysis of 1.5MM online product pages from more than 1,200 brand and retailer sites found that shoppers who use the search feature on a product page convert at a rate that’s 202.9% higher than average. 

If you don’t already have search functionality on your review display, consider adding it. Doing so can have a significant impact on sales!

Consumers who use the search feature on a product page convert at a rate that’s 202.9% higher than average.
The Components of Reviews Shoppers Value Most

Not all reviews are created equal. For example, a recent, detailed review is typically more valuable to a shopper than an old, vague review that’s only a few words long.

Let’s explore the different elements of reviews that matter to shoppers — and how these elements impact shopping behavior.

Shoppers Consider Many Review Elements

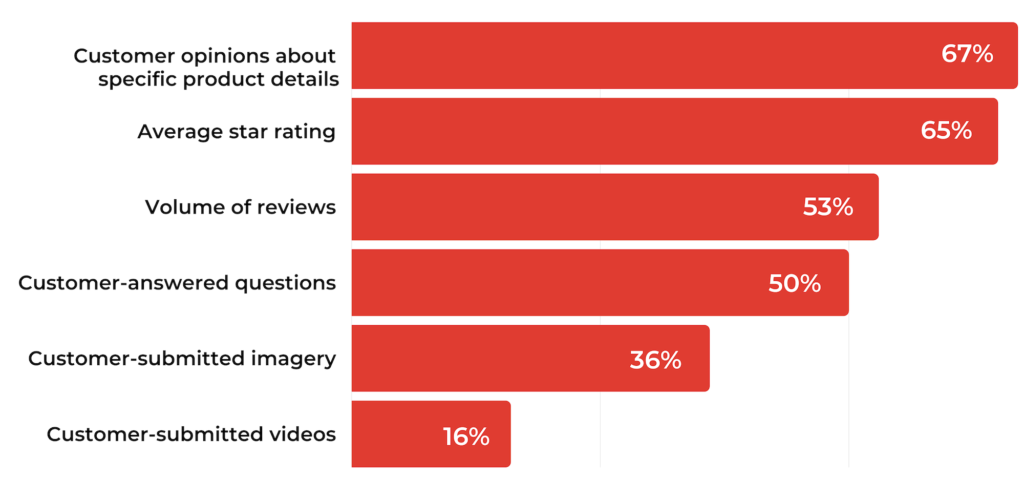
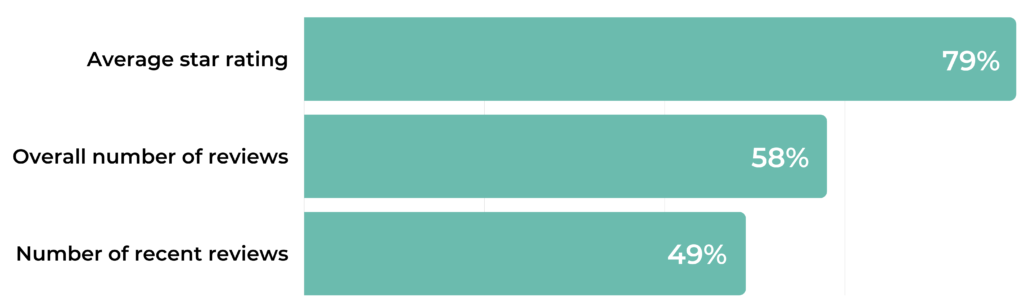
As it turns out, consumers consider many elements when reading reviews. The top choice is the average star rating; 77% of shoppers say this is a factor they consider when reading reviews. 

Three quarters (75%) consider the quantity of reviews and 71% factor in the recency of reviews. Other top factors include the length, depth and detail of the review content (56%) and the grammar and spelling within the review content (32%).

What Shoppers Consider When Reading Reviews
The average rating of the review content
77%
The number of reviews
75%
Recency of review content
71%
The length, depth and detail of the review content
56%
The grammar and spelling within the review content
32%

Star Ratings Matter -- But Consumers Trust Them More When Accompanied by Written Reviews

As you might predict, shoppers value a high volume of great reviews that yield a high average star rating.

Over three-quarters (77%) of consumers indicate that the average star rating is an element they consider when reading reviews.

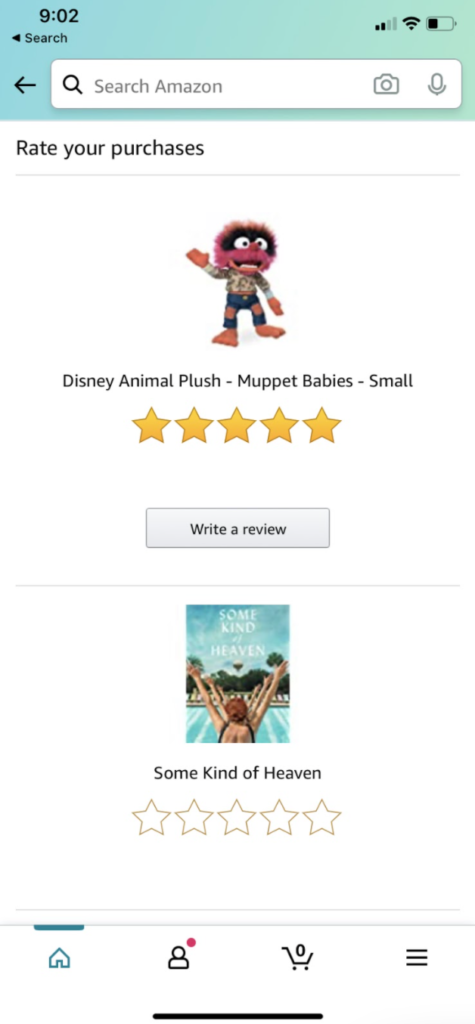
But star ratings alone often aren’t enough to earn the trust of shoppers. Some ecommerce sites — including Amazon — offer shoppers the option to leave a star rating, without an accompanying review.

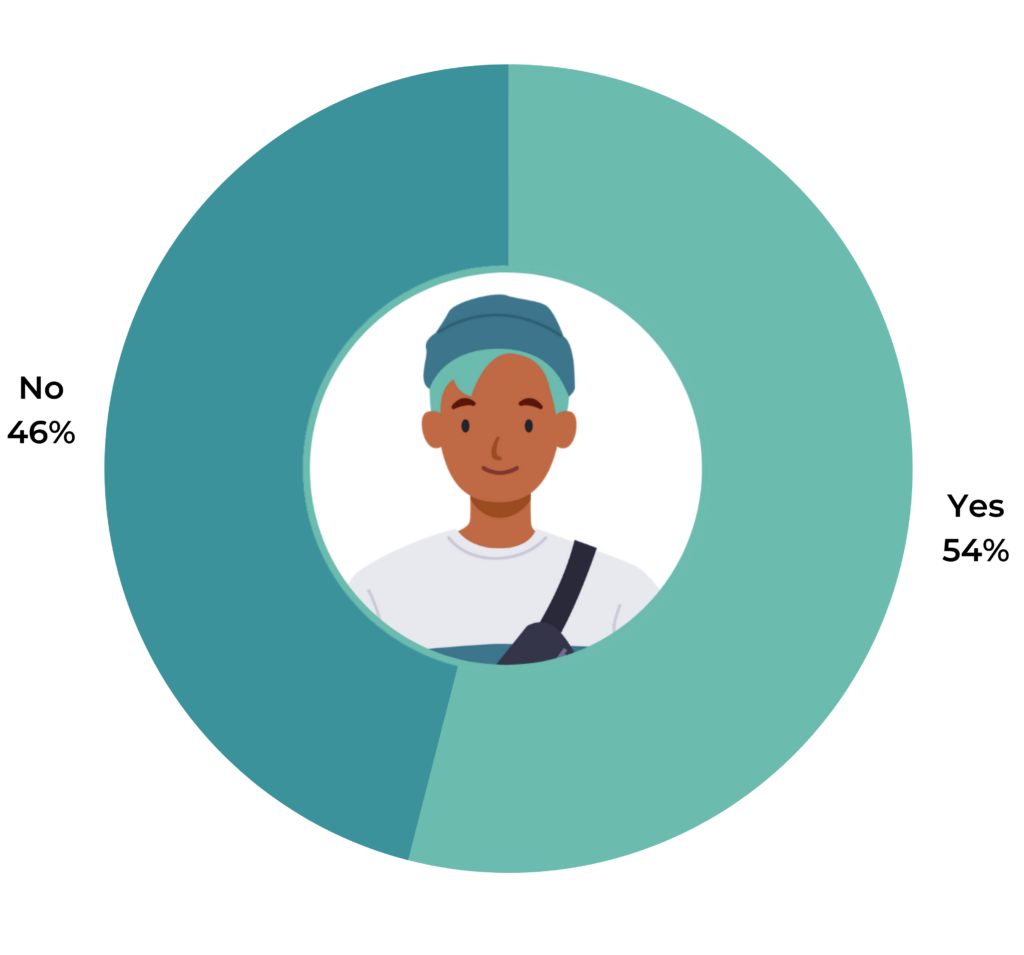
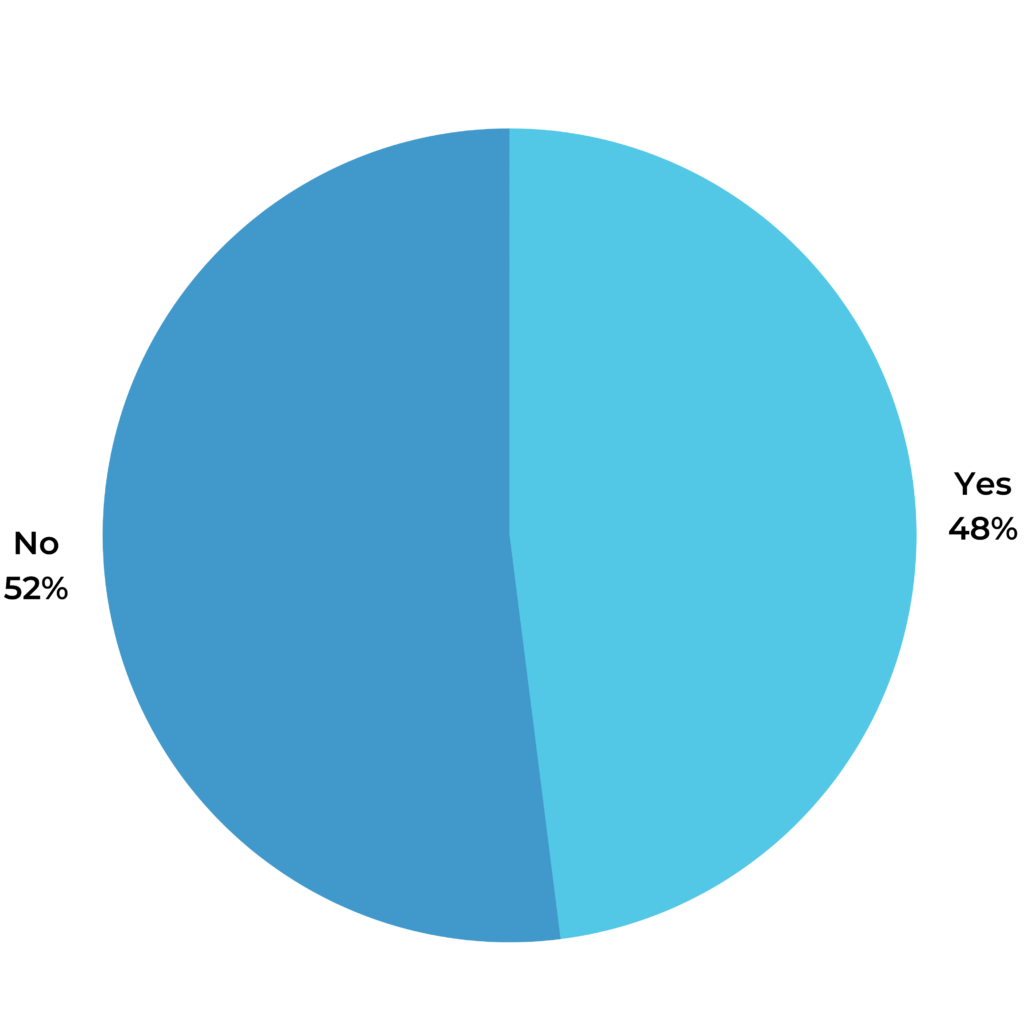
There’s no doubt this approach ensures a higher volume of ratings. However, over half (52%) of consumers indicate they don’t trust this content as much as they do ratings accompanied by reviews.

Do you trust star ratings alone as much as you do star ratings accompanied by reviews?

Review Quantity Counts

Three-quarters of consumers say that quantity is something they consider when reading reviews. And as mentioned earlier in this report, the largest portion of consumers (53%) typically read between one and 10 reviews before making a purchase.

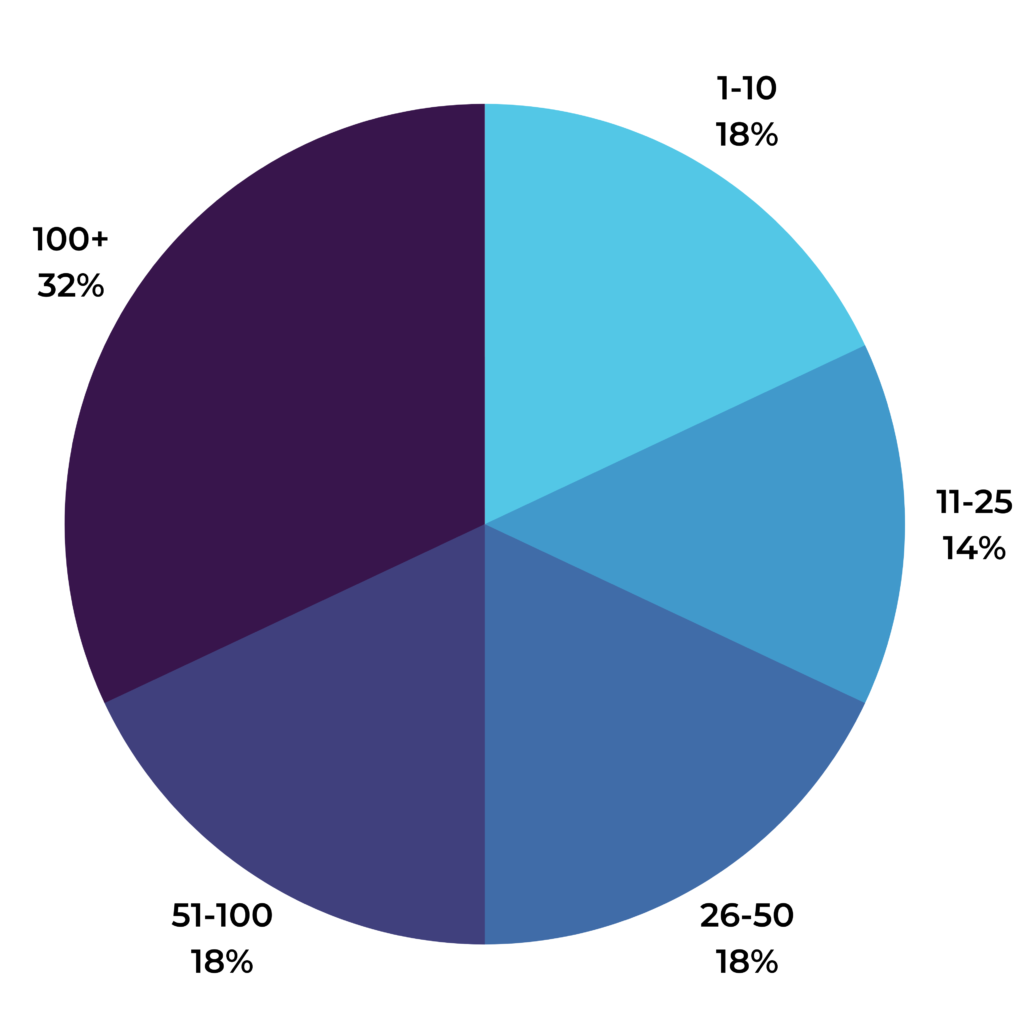
So it’s interesting that in an ideal world, 68% of consumers believe a given review should have 26 or more reviews. 18% feel a product should ideally have between one and 10 reviews, and the remaining 14% think between 11-25 reviews is ideal. 

Though most consumers read between one and 10 reviews, they want plenty more content to be available. This is likely because they want to be able to seek out (and find) reviews that are most relevant to them.

The Ideal Number of Reviews a Product Should Have, According to Shoppers

Consumers expect to find plenty of reviews about products they’re considering. But what’s the minimum number of reviews a product needs to have for them to feel confident making a purchase?

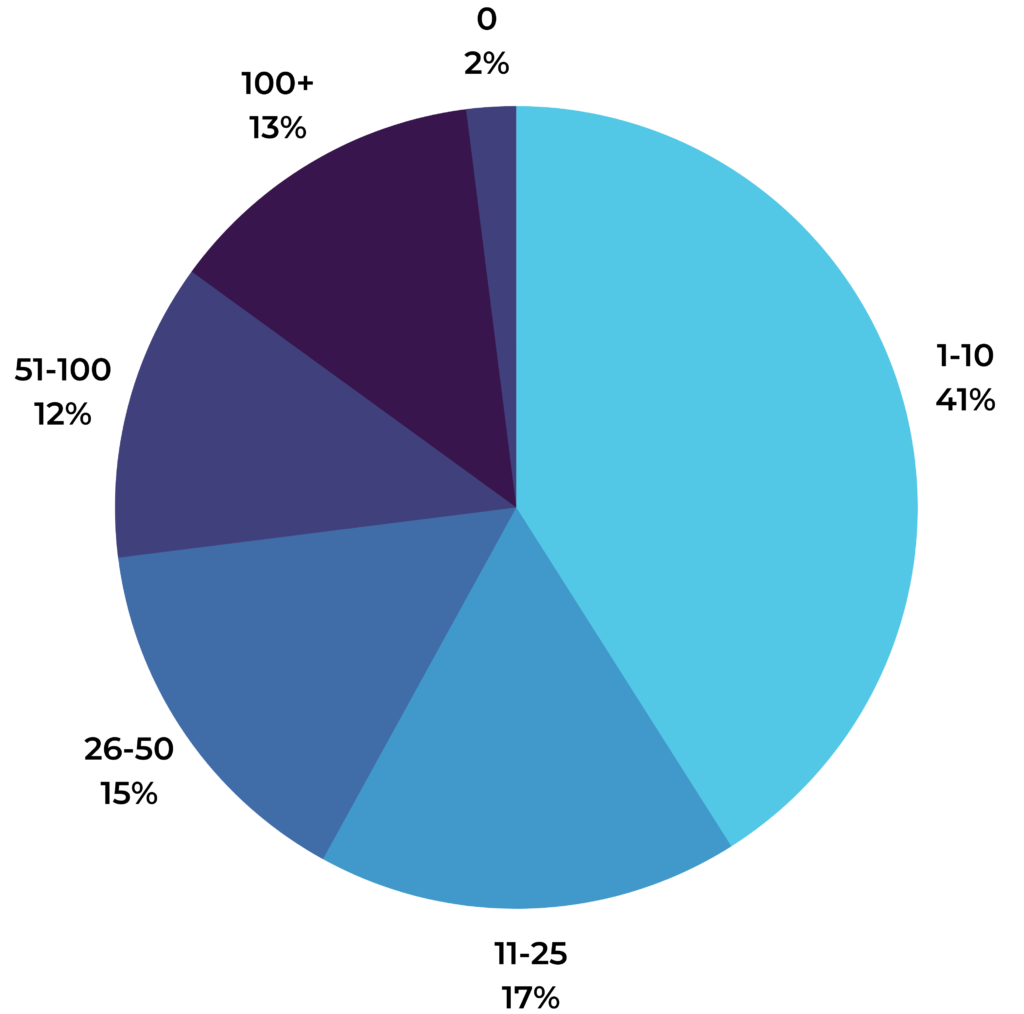
The largest portion of consumers — 41% — indicate that 1-10 reviews is the minimum needed for them to feel comfortable purchasing a product. 40% say a product must have at least 26, while 17% indicate 11-25 is the minimum. The remaining 2% say that 0 is the minimum.

The Minimum Number of Reviews a Product Must Have for a Shopper to Feel Comfortable Purchasing it

Stale Reviews Hold Less Weight

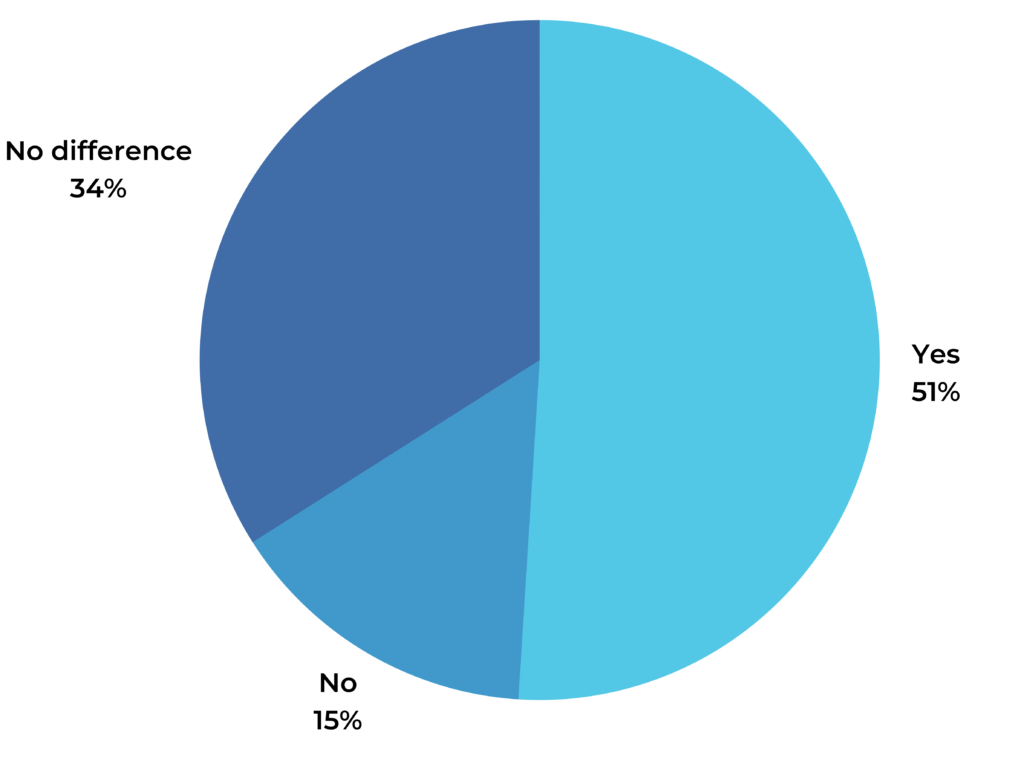
Nearly three-quarters (71%) of consumers indicate that the recency of review content is something they consider when reading reviews. Furthermore, 51% admit they’d be less likely to purchase a product if all the reviews for it were over a year old.

Older Reviews Hold Less Weight for Half of Consumers
If all reviews for a product were over a year old, would you be less likely to purchase it?

For many consumers, older reviews carry less weight. But how recent must reviews be in order for shoppers to consider them relevant?

The biggest portion of shoppers (34%) ideally want to be able to read review content for a product that is between a week and a month old. And a quarter (25%) want to find reviews that are one to three months old. A good number of shoppers have extremely high expectations for fresh review content; 21% ideally want to find reviews posted within the most recent seven days!

Consumers Expect Fresh Review Content
Ideally, how recently would you like to see that review content was left on a product you’re considering?

Clearly, recency matters. So be sure you have a collection strategy in place to ensure shoppers can always find fresh, recent review content. 

The Positive Side of Negative Reviews

As a customer centric business, you work hard to develop great products and experiences. So in an ideal world, all reviews your customers submit would be glowing. But the world isn’t ideal and even the best products attract negative reviews. And as it turns out, that’s OK. Shoppers seek out negative reviews to make informed purchase decisions. And displaying this content helps you build trust with shoppers.

Consumers Seek Out Negative Reviews

Today, a staggering 96% of consumers specifically seek out negative reviews at least sometimes, compared to 85% in 2018 and 82% in 2014. 

Percentage of Consumers Who Seek Out Negative Reviews
2014
82%
2018
85%
2021
96%

And 69% always or regularly seek out this negative content. Interestingly, Millennial (38%) and Gen Z shoppers (38%) are more likely to indicate they always seek out negative reviews, when compared to Gen X (33%) and Boomer (28%) shoppers. 

Frequency at Which Consumers Seek Out Negative Reviews by Generation
Gen Z
Millennials
Gen X
Boomers

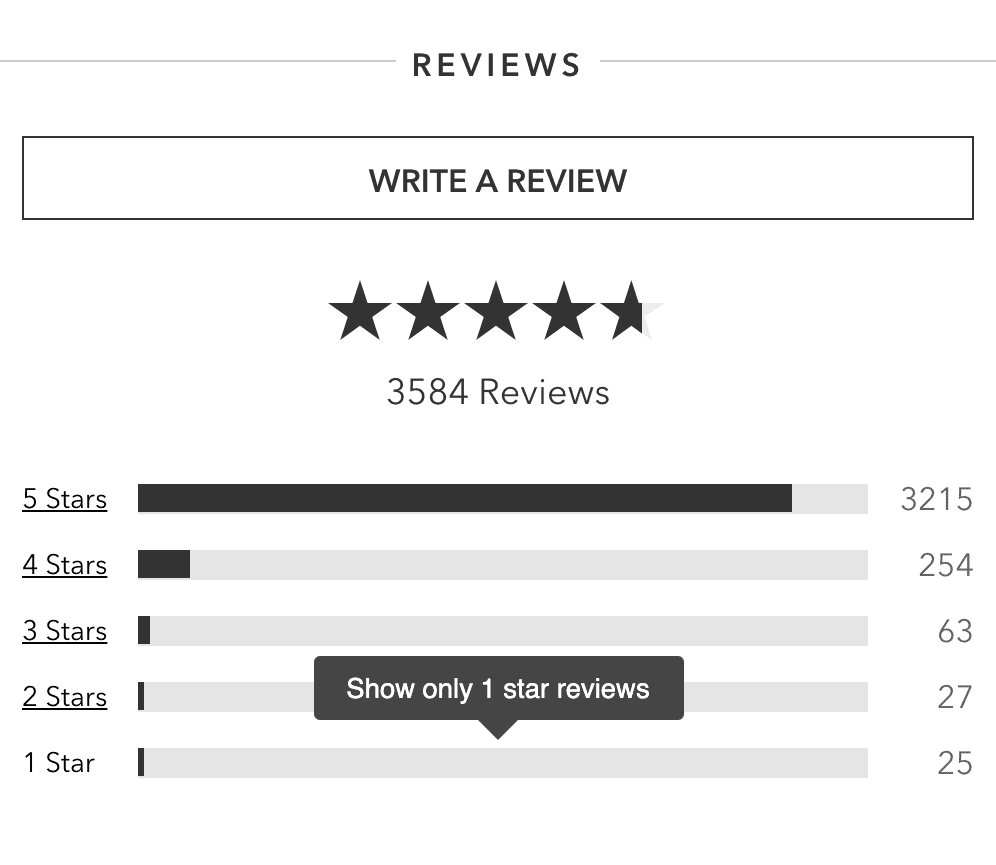
Nearly all shoppers seek out negative reviews to get a balanced look at what they can expect from a product. What’s more, over half (52%) of consumers explicitly look for one-star reviews. 

Half of Consumers Seek Out One-Star Reviews
Do you look for negative reviews about products before making a purchase decision?

It’s worth noting that Millennials are the generation most likely to look for one-star reviews. 60% do so, compared to 40% of Boomers.

Seeking Out One-Star Reviews by Generation
Do you look for negative reviews about products before making a purchase decision?
Gen Z
Millennials
Gen X
Boomers

Remember: reading one-star reviews for a product won’t necessarily deter a shopper from making a purchase. In fact, if a customer determines the worst case scenario isn’t a concern, they may purchase the product anyway.

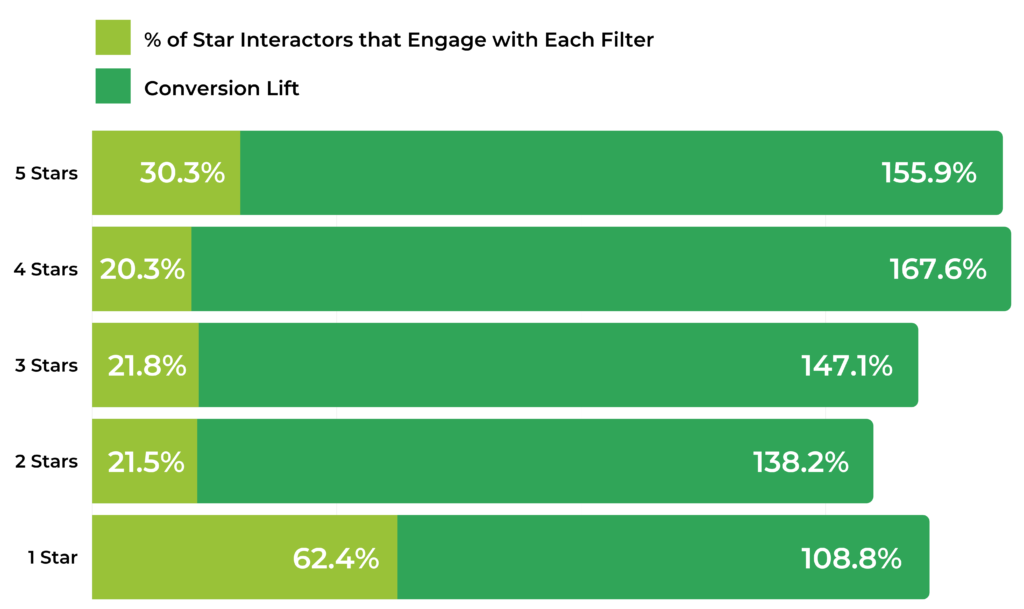
Case in point? Our recent analysis of the impact of various UGC features found that 62.4% of shoppers that interact with the star filter feature on a review display specifically filter to read only one-star content. And shoppers who do so still convert at a rate that’s 108.8% higher than the average page visitor!

Negative Reviews Boost Trust

Our research with Northwestern University found that shoppers are most likely to purchase products with an average star rating between 4.2 and 4.5. That’s because a perfect star rating is perceived as too good to be true. 

In line with this research, our most recent survey found that nearly half (46%) of consumers are suspicious of products with a perfect average star rating (five out of five). This number is even higher — 53% — among Gen Z shoppers.

Are you suspicious of products with a perfect 5 star rating?
Gen Z
Millennials
Gen X
Boomers

Resist the temptation to delete negative reviews. Consumers know that a product — no matter how good — can’t be all things to all people. By displaying negative reviews, you’re letting shoppers know you have nothing to hide. And that shows them you’re a brand they can trust.

Six Tips for Leveraging Reviews to Drive Sales

Reviews were once a novel concept. But today, they’re an expected part of the purchase journey, whether a consumer is shopping online or within the four walls of a brick-and-mortar store. Brands and retailers must make it a priority to collect and display reviews. If they don’t, they’ll lose customers to businesses that do.

Here are our top six recommendations based on the key findings of this report.

1
Solicit Reviews from Your Customers

Today, nearly all shoppers consult reviews when shopping online, and over half (57%) do so when they’re shopping in brick-and-mortar stores. Make collecting reviews from your customers a priority. The most effective way to do this is to send emails to your customers post-purchase, asking them to write reviews for the products they bought.

Remember: review quantity and recency are both important to shoppers. So be sure to collect a steady stream of reviews so your customers can always find a high volume of fresh content. If you have products in need of reviews, product sampling is an effective way to generate this content. 

Finally, ensure you have plenty of reviews for high priced items in your product catalog. After all, 80% of consumers say they read more reviews when they’re shopping for an expensive product.

If you’re looking for more guidance, our Guide is packed full of tips on how to generate more reviews.

Prominently Showcase Reviews

79% of shoppers specifically seek out websites with product reviews. So make it easy for your shoppers to find and interact with review content on your website — regardless of the device they’re using to shop. A best practice is to include a review “snippet” at the top of each product page that offers an overview of available review content — including the average star rating and review quantity. Shoppers can then click on this snippet to read, sort and filter review content.

Here are some ideas on how to leverage your review content in your own marketing.

2
3
Optimize Your Review Display

Shoppers particularly value certain review display features — including the ability to search existing content and filter on one-star reviews. And a previous analysis also tells us that those who interact with these features convert at a higher than average level.

So consider adding these features to your review display. Then, measure the impact and optimize accordingly.

The key is absorbing and acting on what your data tells you. Our analysis on the conversion impact of different review display features is a good place to start though.

Share Review Content Across Channels

Amazon, retailer and brand sites are top places shoppers seek out review content. And shoppers expect to find reviews — regardless of where they shop for your products. If you’re a brand, ask your ratings and reviews provider if it’s possible for the reviews that you collect on your own dot com to be shared to your key retail partners and Amazon. If you want to learn more about syndication, our Complete Guide to Ratings & Reviews has an entire chapter on this topic

4
5
Embrace Negative Reviews

Today, 96% of consumers seek out negative reviews. This content allows them to understand the worst case scenario — and determine whether it’s something they can live with. So resist the urge to hide negative reviews. Displaying this content can help you build trust with your shoppers — and drive sales. Check out this blog for ideas on how to best leverage negative reviews.

Analyze Reviews to Uncover Actionable Insights

Reviews are a rich (yet often untapped) source of insights that can help you identify ways to better serve your customers. Analyze your review content regularly to find ways to improve your products and experiences.

Your ratings and reviews provider should provide an analytics platform that makes it easy to uncover insights — and take action on them in ways that’ll positively impact your business. Here’s more on why and how analysis should be an integral part of your Ratings & Reviews program.

6
An analysis of how different elements of UGC impact conversion, based on the activity of 1.5MM online product pages from more than 1,200 brand and retailer sites throughout the course of 2020.

Power Points

  • Consumers who interact with Ratings & Reviews convert at 120.3% the rate of those who don’t; respective figure for Q&A is 157.1% and imagery is 91.4%

  • Consumers who click the “Helpful Yes” button within individual reviews convert at the highest rate of review interactors (314.7% conversion lift), followed by those who click “Foot Page Previous” (288.2% conversion lift)

  • When it comes to star filtering, 62.4% of star interactors filter on 1 star reviews (compared to 30.3% for 5 star reviews, the next most commonly filtered). These consumers still convert at 120.3% the rate of typical web visitors

  • Consumers who click the “Show More Answers” button convert at 164.7% the rate of general web visitors, making it the most impactful Q&A display interaction feature

  • Become outcome obsessed: Become data-led and conversion-first by analyzing your own data and optimizing your UGC strategy accordingly
Introduction

User-Generated Content Benefits Consumers and Businesses Alike

Today’s shoppers have come to depend on user-generated content (UGC), including ratings, reviews, Q&A, photos and videos — regardless of the type of product they’re shopping for. And if they don’t find the content they’re looking for on a brand or retailer site, they won’t hesitate to shop elsewhere.

of consumers typically read product ratings and reviews before making a purchase.
0 %
of shoppers abandon their online purchases if they can’t find quick answers to their questions.
0 %
of shoppers specifically look for photos and videos provided by other consumers before committing to a purchase.
0 %

On the other hand, businesses that do provide shoppers with the content they depend on to make smart purchase decisions are rewarded. Collecting and displaying UGC is proven to drive traffic, conversion and sales, while also providing brands with actionable insights they can use to improve products and experiences.

Focus on What’s Important

The positive impact of UGC is no longer debatable. As such, a growing number of customer-centric brands and retailers now make collecting and displaying plenty of this content integral to their ecommerce shopping experience. 

But all too often, businesses become so focused on creating brand-aligned, visually appealing UGC displays that they lose sight on what really matters: driving conversion.

So what’s the difference between a great review display that positively impacts conversion — and one that doesn’t?

Myriad UGC Features Impact Conversion

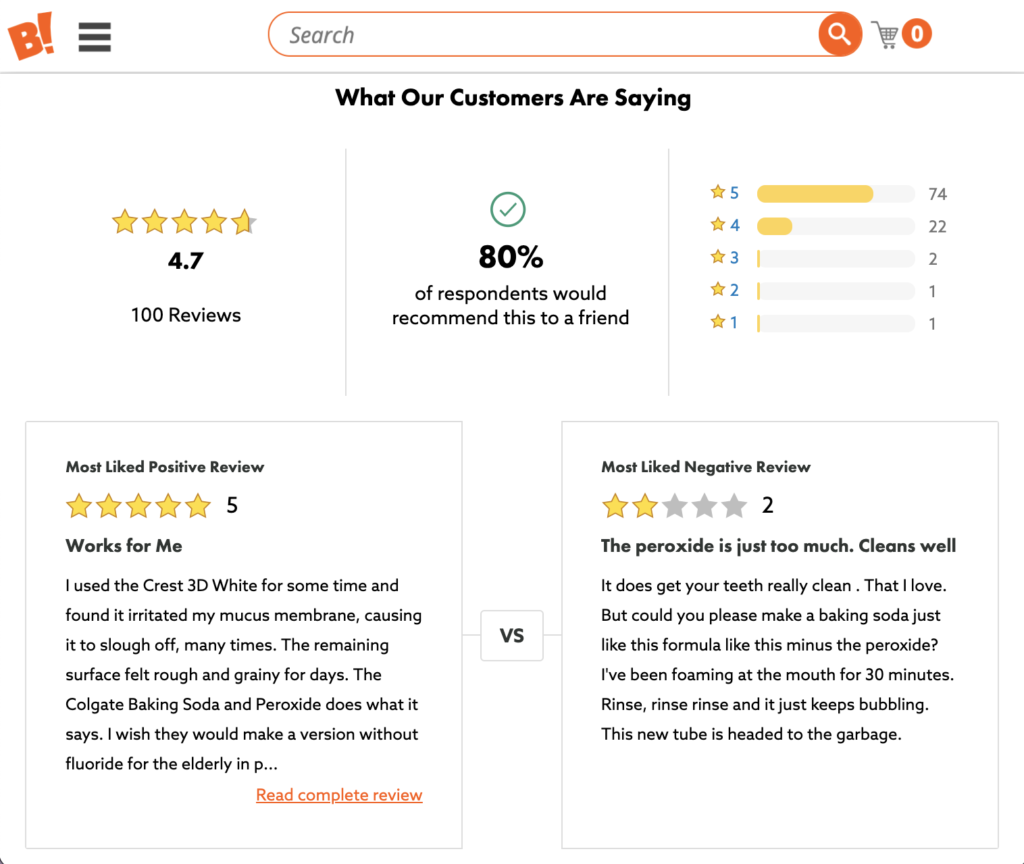
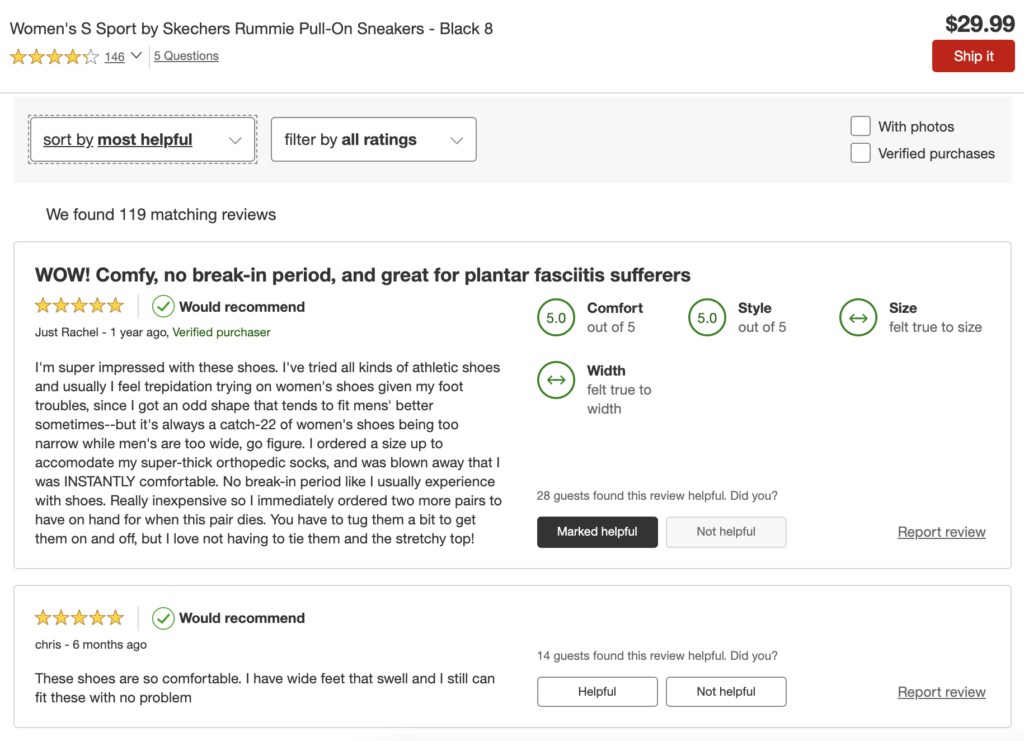
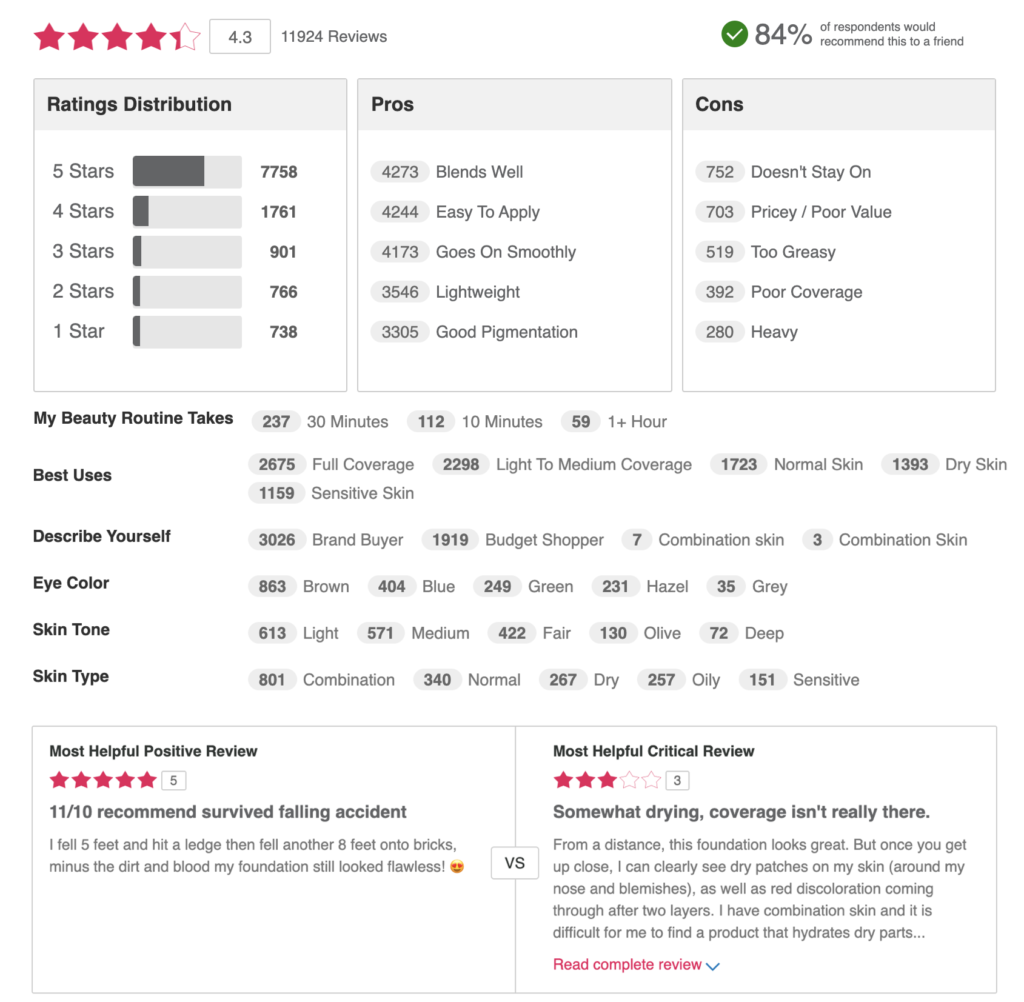
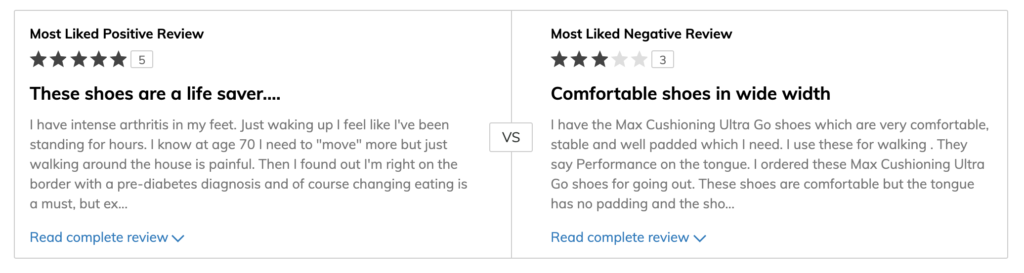
Each UGC display is unique and consists of different features and functionality. For example, while some review displays include a review “faceoff” highlighting the most helpful positive and negative reviews about a particular product, others don’t.

But how are consumers interacting with all of these features? And are these interactions impacting conversion? 

PowerReviews analyzed consumer activity during the entire year of 2020 across more than 1.5MM online product pages from more than 1,200 brand and retail sites to find out. Throughout this report, we’ll explore how user-generated content drives conversion for these brands and retailers. And we’ll drill it down all the way to the feature level.

Measure and Optimize Your UGC Display to Drive Bottom Line Results

Remember: There’s no magic, “one size fits all” display that’ll drive conversion across all brands. A feature that’s particularly impactful for one brand or category might not be as effective for others.

As such, it’s important to continuously measure the performance of different components of your own UGC display. You can then use that data to drive optimizations that’ll positively impact your bottom line.

Defining Conversion for this Report

Before diving deep into the data, it’s important to level set how we define the different metrics cited.
All analysis is taken for the period January 1, 2020 thru December 31, 2020.
Analysis is based on activity on Product Detail Pages (PDPs) from 1,200 ecommerce websites (totalling more than 1.5 million PDPs in total). These ecommerce websites exist across the full gamut of ecommerce categories.
The visitor conversion metric we use as a baseline for this report is calculated based on conversions from individual visitors in a 24 hour period. In other words, a new visitor session will start after every 24 hours with all accompanying downstream implications on the conversion metric.
Calculated for any consumer visiting a Product Detail Page running PowerReviews UGC technology. This means that page will display Ratings & Reviews in at least some format. The overwhelming majority of these highlight Ratings & Reviews for the product concerned (e.g. an average rating summary).

Calculated based on unique visitors who have scrolled the page enough to be served an impression of at least one type of UGC (review, image/video or Q&A). We EXCLUDE what we call our review snippet (the UGC element typically used at the top of PDPs to display a summary of the rating distribution, average rating and so on) from the UGC Impression metric. Throughout this report, we also use this metric to examine the different forms of UGC, specifically reviews, Q&A and visual media (i.e. video or imagery).

Calculated based on visitors who interact with UGC. Examples of interactions include clicking “read more” on a review, Q&A comment, opening a user-submitted image or using the search option to search review content. A full list of what we define as interactions can be found here.
The Overall Impact of UGC on Conversion

Before we dive into the individual features of UGC displays, let’s take a step back and look at the overall impact of UGC on conversion.

The Presence of UGC Positively Impacts Conversion Rates

During 2020, 3.4% of site visitors converted on the 1,200 sites we analyzed using PowerReviews UGC/Ratings and Reviews technology.

This is above typical benchmark conversion rates of the Product Detail Pages (PDP) you may have seen from other sources. There are two main reasons for this.

  1. How we calculate conversion rate: we base conversion on visitors rather than sessions (see above for our specific methodology).
  2. Assuming the PDP is built this way, which the overwhelming majority of them are – all shoppers in the data we analyzed are served some form of UGC above the fold (typically, a summary of rating distribution and average rating at the very least). Again, see above for more information on what we classify as a UGC impression or UGC interaction.

Regardless, when visitors scroll a page to the point they are served some form of UGC OR interact with UGC, they are MUCH more likely to convert.

There’s a 4.3% lift in conversion when a visitor is served at least one type of UGC (i.e. our Analytics platform records a visitor UGC impression as per the above definition, which excludes our top-of-page review snippet summary). And there’s a 108.4% conversion lift when a visitor interacts with UGC. We’ll go into more details about the different ways a visitor can interact with UGC later on.

Impact of UGC on Conversion
Ecommerce UGC Page Visitor Overall Conversion Rate
3.4%
UGC Impression Conversion Rate
3.6%
4.3% conversion lift from UGC Impression
UGC Interaction Conversion Rate
7.2%
108.4% conversion lift from UGC Interaction

The message here is quite clear: displaying UGC including reviews, Q&A and visual content in itself has a notable impact on conversion. But consumer interaction with UGC has a transformational effect.

But does presenting this information in different formats make a difference? Let’s take a closer look at how different features of each type of UGC can make a difference.

How Review Interactions Drive Purchase Behavior

As previously mentioned, 97% of consumers read product ratings and reviews before making a purchase. And as it turns out, when a shopper consumes this content, it significantly impacts their likelihood to purchase.

Reviews Double Conversion Rates

Purchasing a new product is risky. Even if a shopper reads all of the details provided by the brand or retailer, it’s impossible to know with certainty that a product will meet their needs. But when consumers read reviews written by others like them, this feedback often gives them the confidence they need to convert. 

In fact, there’s a 120.3% lift in conversion when a shopper interacts with ratings and reviews on a product page.

The Impact of Reviews on Conversion
Ecommerce UGC Page Visitor Overall
3.4%
Conversion for Those Who Interact with Reviews
7.6%
120.3% conversion lift when visitors interact with reviews

How Different Review Features Boost Customer Confidence -- and Conversion

Each review display a consumer comes across consists of different features. Let’s examine how some of these key features positively impact a shopper’s likelihood of converting. 

The Impact of Various Review Features on Conversion
Conversion lift among visitors that engaged with each ratings and reviews feature (in comparison to standard conversion figures for the same pages)
Helpful Yes
314.7%
Footer Page Previous
288.2%
Filter Merchant Specific Questions
270.6%
Review Search
202.9%
Helpful No
182.4%
Footer Page Next
182.4%
Faceoff Positive
138.2%
Review Snippet
129.4%
Footer Back to Top
129.4%
Faceoff Negative
120.6%
Filter Stars
111.8%
Review Sort
109.7%
More Details
105.9%
Filter Tag
35.3%

Helpful Votes

When a shopper reads a review, they can indicate that the content was helpful (or not) by clicking on the thumbs up or thumbs down icons.

The conversion rate increases by 314.7% among visitors who click the “helpful” icon. And interestingly, there’s a 182.4% conversion lift among those who click the “unhelpful icon”.

Footer Page

At the bottom of a review display, visitors can typically take a few different actions. They can navigate to the next page of reviews, go back to the previous one or return to the top. 

Here’s the conversion lift for shoppers that take each of these actions over those who do not:

Previous
288.2%
Next
182.4%
Back to Top
129.4%

Merchant Specific Question Filtering

Some brands and retailers ask merchant-specific questions in their “write a review” forms. For example, a beauty brand might ask a reviewer to include information about their skin type and beauty routine in a review for foundation.

Sometimes, brands also allow shoppers to filter reviews based on the answers to these questions. For example, a visitor can filter reviews to only see content written by those with dry skin. 

Shoppers who filter by these merchant specific questions end up converting at a rate that’s 270.6% higher than general visitors to the same Product Detail Pages!

Review Search

Many review displays allow shoppers to search for reviews that include specific terms relevant to their needs. For example, a shopper might seek out a vacuum cleaner that’ll effectively clean up her pet cat’s hair. They can type “cat” into the search feature and see all reviews that mention cats.

Once the shopper finds reviews relevant to their use case, they’re more likely to make a purchase. In fact, there’s a 202.9% conversion lift among visitors who use the search feature (over general visitors to the same page).

Review Faceoff

A review “faceoff” shows the most liked positive review alongside the most liked negative one. It’s a great way for shoppers to quickly understand the positives and the negatives of the product that have been most helpful for other shoppers to learn about.

There’s a 138.2% conversion lift for those who expand the positive review in the faceoff over general visitors to the same Product Detail Page.

And interestingly, there’s a 120.6% conversion increase among shoppers who click to expand the negative review. This once again proves the value of negative reviews in empowering shoppers to make informed purchase decisions.

Review Snippet

Many brands and retailers display a review “snippet” at the top of the product page. The snippet provides an overview of the reviews available for that product, and typically includes the average star rating, as well as the number of reviews that have been written for that product.  

If a shopper interacts with the snippet (aka they click within it), they’re taken to the full review display to get more details. In fact, there’s a 129.4% conversion lift for those who do.

Star Filters

Many review displays provide a breakdown of how many reviews have been written for each star rating. Shoppers can then click on any of the bars to see only reviews of a certain star rating. There’s a 111.8% conversion lift among those who do (in comparison to those who visit the same page and do not). 

Here’s an even closer look at how many shoppers filter reviews by specific star ratings — and how that behavior impacts conversion.  

Conversion Lift by Star Filtering

Of note, choosing to see only one-star content is the most common way shoppers filter by star rating.

However, it’s worth noting that visitors who take this action still convert at a rate that’s 108.8% higher than average.

Negative reviews are an important tool shoppers depend on to make informed purchase decisions. This content allows them to understand the worst possible scenario — and determine if they can live with it. And clearly, many don’t let the occasional negative review stand in the way of making a purchase.

Review Sorting

Typically, visitors can sort review content in a number of ways. For example, a visitor can sort reviews by recency — or they can choose to display reviews that include images first. 

Among those who sort reviews, there’s a 109.7% increase in conversion.

Let’s take a look at how different types of sorting behavior impact conversion.

Conversion Lift by Review Sorting Behavior
(Compared to General Visitors to the Same Page)
Review Sort Most Helpful
200%
Review Sort Images
170.6%
Review Sort Highest
158.8%
Review Sort Oldest
108.8%
Review Sort Lowest
102.9%
Review Sort Most Recent
73.5%

More Details

Once a shopper has zeroed in on a specific review, they can often expand that review even more to get additional details. For example, when a shopper clicks “more details” on this review for a jacket, they can see the pros and cons of the product, as well as more information about the fit and use cases. 

Based on our analysis, there’s an average 105.9% conversion lift for shoppers who click to get more details compared to visitors to the same pages who don’t do so. 

Tag Filtering

Some businesses ask reviewers to select the pros, cons and best uses for a specific product.

Future shoppers can then filter review content by specific best uses.

There’s a 35.3% increase in conversion among visitors who take this action. Although this is a notable increase, it’s far less impactful than the 120.3% lift in conversion for all review interactors.

This once again highlights the importance of building your review display according to what the data tells you.

Boost Trust (and Conversion) with Reviews

Reviews drive a 120.3% lift in conversion. And certain review features can impact conversion even more. Be sure you’re measuring the effectiveness of your review display regularly — and use the insights you uncover to make improvements that’ll drive conversion.

How Q&A Interactions Lift Conversion

No matter how comprehensive your product descriptions, some shoppers will still have questions. When this happens, a shopper is likely to navigate to the Q&A portion of your product page to see if a fellow shopper has gotten an answer to a similar question. And if that’s not the case, the shopper can submit their own question. 

And when shoppers interact with Q&A, it has a big impact on their purchase behavior.

Q&A is the Most Impactful Type of UGC

Of all the different types of UGC we analyzed for this report, Q&A is the most impactful. In fact, there’s a 157.1% conversion lift when shoppers interact with the Q&A on a product page! 

Impact of Q&A on Conversion
Overall Visitor Conversion
3.4%
Conversion for Those Who Interact with Q&A
8.8%
157.1% lift in conversion when visitors interact with Q&A

Various Q&A Interactions Impact Purchase Likelihood

Now, let’s take a look at some examples of different Q&A features shoppers engage with — and how each of these features drive purchase behavior.

The Impact of Q&A Features on Shopper Behavior
Conversion lift among visitors that engaged with each Q&A feature
Show More Answers
164.7%
Click Read Answers
158.8%
Answer Helpful
141.2%
Ask Question Snippet
137.1%
Answer Question
111.8%
Ask Question Header
79.4%

Show More Answers

A certain number of questions and answers appear on the product page for a given product. If there are more available, the shopper must click on the text that reads “Show more Q&A” to access them. 

A shopper that scrolls through this additional Q&A content is obviously committed to learning as much as they can about a product. And these shoppers convert at a higher rate than typical. There’s a 164.7% conversion lift when shoppers click “show more answers.” 

Click Read Answers

Typically, a single answer is automatically displayed for a question submitted via Q&A. If there are multiple responses (for example, an official brand response as well as one from a previous customer), the shopper must click “show 1 more answer” to see it.

There’s a 158.8% conversion lift among those who take this action. 

Answer Helpful

When a shopper reads an answer that’s been provided to a customer question, they can tap or click the thumbs up icon to indicate the answer was helpful to them. 

Those who do convert at a level that’s 141.2% higher than average for the page. 

Ask Question Snippet

Some brands and retailers display a “snippet” at the top of product pages that gives visitors a high level overview of the UGC available for that product — and provides a link they can click to ask their own product question. 

There is a 137.1% increase in conversion among shoppers who click “ask a question” in the UGC snippet. 

Answer Question

Some brands and retailers allow different experts to answer the questions submitted via Q&A — including existing customers. A visitor can answer an existing question by clicking on the “add your answer” text. 

There is a 111.8% conversion lift among shoppers who take this action.

Ask Question Header

Another way shoppers can ask questions is to click on the “ask a question” button of the Q&A header. 

There is a 79.4% increase in conversion when page visitors do this. 

Empower Shoppers to Ask Purchase Blocking Questions

Q&A is the most impactful form of user-generated content, driving a 157.1% lift in conversion. If you’re not already, add Q&A to your product pages. Being able to get quick answers to questions (and reading answers to questions that have already been asked) will give your visitors the confidence they need to convert. 

Remember: analyze the performance of your Q&A features — and use the data to make impactful optimizations that’ll increase conversion.

Find out how Skechers achieves a conversion rate of 80%+ for customers who have their questions answered by Q&A.
The Role of Imagery in Conversion

Many shoppers look for photos and videos of a product before making a purchase. And increasingly, they’re seeking out this content from others like them. 88% of shoppers specifically look for images and videos provided by other consumers before making a purchase.

And as it turns out, consuming this content positively impacts purchase behavior. 

Shoppers Who Interact with Imagery are More Likely to Convert

The overall conversion rate across the brand and retailer sites we analyzed was 3.4%. But when a site visitor interacts with user-generated photos and videos on a product page, the conversion rate goes up to 6.6%. That’s a 91.4% lift in conversion!

Impact of User-Generated Imagery on Conversion
Overall Visitor Conversion
3.4%
Conversion for Those Who Interact with Imagery
6.6%
91.4% lift in conversion when visitors interact with imagery

Of note, visual content has an even larger impact when a consumer is shopping for products in certain categories that are more visual in nature.

For example, there’s a 119.1% conversion lift when consumers shopping for apparel interact with user-generated imagery. And those who interact with imagery when shopping for home and garden products convert at a rate that’s 149.9% higher than average.

Different Imagery Interactions Drive Conversion

We know that those who interact with user-generated photos and videos convert at a higher level than average. Now, let’s take a closer look at different times of imagery interactions and how they impact conversion. 

Impact of Imagery Features on Shopper Behavior
Conversion lift among visitors that engaged with each imagery feature
Image Gallery
94.1%
Image Gallery Next
91.2%
Image Gallery Previous
79.4%

Image Gallery

It’s a best practice to display photos and videos submitted by shoppers in a gallery on the appropriate product page. Our analysis tells us there’s a 94.1% conversion lift among shoppers who click on any image within that gallery.

Image Gallery Navigation

Once a shopper has enlarged an image or video in the gallery by clicking on it, then can then navigate to other imagery by clicking on the arrows on either side of the image. Those who click to see the next image convert at a rate that’s 91.2% than average. And there’s a 79.4% conversion lift among shoppers who click the “previous image” arrow. 

Convert More Shoppers with User-Generated Imagery

User-submitted photos and videos can help you convert more browsers to buyers. This is especially true for categories that are highly visually in nature — such as apparel and home and garden — just to name a few. 

If you’re not already, start collecting photos and videos from your shoppers. Then, display the imagery you collect in galleries on your product pages and elsewhere on your website to boost shopper confidence and conversion. Finally, be sure to measure the performance of different imagery features — and make data-based optimizations to improve performance.

Find out how WEBS has natively collected and displayed over 4,000 images on their site since partnering with PowerReviews.
4 Tips for Boosting Conversion with UGC

It’s undisputable: shoppers who interact with user-generated content convert at higher than average levels. And certain features of UGC displays drive even larger conversion impact.

But remember: there’s not a one size fits all display that’ll work for every business. That’s why it’s critical to continuously measure the performance of your UGC displays — and then use that data to make optimizations that’ll drive an even bigger impact on conversion.

Read on for four recommendations for converting more shoppers with UGC, based on the findings of this analysis.

1
Prominently Display Reviews

Nearly all consumers read reviews. And there’s a 120.3% conversion lift among visitors who interact with this content. Make it easy for shoppers to find and consume the reviews that are most relevant to them. And consider adding features to your display that are proven to boost conversion, such as the ability to filter by star rating or search existing content. But don’t focus solely on creating an aesthetically pleasing display. Instead, continuously measure the performance of each feature of your display and use that data to drive impactful optimizations.

Empower Shoppers to Get Quick Answers to Purchase Blocking Questions

Q&A is the most impactful form of UGC, driving a 157.1% lift in conversion. So enable your shoppers to read the answers to questions that have already been asked — and submit their own questions too. Consider adding features to your Q&A display that have positively impacted conversion rates for other businesses. Then, measure the performance of these features on your own conversion rate, and use the data to further optimize your display and drive more sales.

2
3
Showcase Visual Content from Your Shoppers

88% of shoppers seek out photos and videos from others like them before making a purchase. And there’s an 91.4% lift in conversion when visitors interact with user-generated imagery on a product page. Ask shoppers to share photos and videos of your products in action. Then, feature this content on your product pages where it’s easy for shoppers to find and consume and elsewhere on your site. Measure the performance of your display, and follow the data to make changes that’ll impact conversion. 

Become Data-Led and Conversion-First

Remember: there’s no one UGC display that’ll work well for all businesses. In fact, features that drive conversion for one brand may have little to no impact for another. That’s why it’s critical to continuously measure the performance of your UGC program. Your UGC partner should make it easy for you to see which display components are driving conversion — and which are falling flat. And then you can use that data to make changes to your display that’ll yield even better results. 

4

This is the PowerReviews monthly snapshot trends report for April 2021, an analysis of consumer activity across more than 1.5MM online product pages from more than 1,200 retail/brand sites.

We started measuring at the start of Covid. To recap, a huge initial surge led to an overall 3x increase in online purchase volumes between February (pre-pandemic) to May 2020. However, the subsequent four months through to October led to a steady decline and then stabilization, with purchase volumes consistently between 40% and 70% higher than they were pre-pandemic (we actually re-aligned our reports to three month periods due to this stabilization).

We then saw a slight uptick in preparation for the Holidays (remember: shopping was expected to start early this year).

Then onto the Holidays, when the typical marked seasonal increase materialized, before a return to Covid-era normality despite the continuing vaccine rollout.

Key ecommerce market trends

01

More of the same as online purchase volumes and site traffic continue at Covid norm levels

02

Review Submission Volumes Consistently Up on Pre-Holiday Levels

03

Reviews driving purchases more than they were pre-Covid

More of the same as online purchase volumes and site traffic continue at “Covid-norm” levels

Prior to the Holidays, consumer behavior had clearly become more predictable, with purchase volumes consistently around 1.4x to 1.7x where they were before the pandemic (this was after a giant surge in April, May and June). So remember that is the baseline we’re dealing with in the chart below.

After the Holiday surge, ecommerce purchase volumes settled to similar levels to where they were pre-Holiday in January, February and this continued into March (i.e. in the range of 1.4x to 1.7x where they were pre-Covid).

Review Submission Volumes Consistently Up on Pre-Holiday Levels

In our Post-Holiday snapshot, we highlighted a giant surge in review volumes – largely to be expected given the seasonal purchase increases that occur at this time of year.

However, overall review volumes are up slightly on where they were before the Holidays – and this has consistently been the case over the past three months (i.e. after the end of the Holiday period).

Review length and sentiment continues to be stable

At the risk of sounding like a broken record, review length and sentiment (in the form of average rating) remains flat. This has been the case since we started our analysis a year ago.

So although Covid’s impact on ecommerce generally has been transformational, it has not affected the content of reviews submitted by consumers.

Reviews driving purchases more than they were pre-Covid

Over the last few monthly snapshots, we have included a deep dive into the impact of review content on the buyer journey – paying particularly close attention to year-on-year comparisons during the Holidays.

To recap, the charts in this section highlight the percentage of online shoppers who go onto purchase after they’ve interacted with review content (i.e. searched, filtered, clicked to extend the review from preview to view entire content etc.)

We found that review interactors consistently converted at around a 25% higher rate than they were a year previously (the conversion figure is typically around 5.25% in the three months prior to Black Friday 2020 compared to around 4.25% in the same period in 2019).

For context, this figure had come down from its Covid peak (as also demonstrated below) of 6.85% in April 2020. This is in line with when we saw the highest ecommerce purchase volumes (when they hit a peak of 210% above where they were pre-COVID at this time).

Through March, the influence of reviews on the buyer journey climbed steadily, peaking at 4.86% of review interactors going on to make a purchase. As a reminder, the figure for March 2020 – highlighted for year-on-year comparisons – was the start of Covid when we saw unprecedented growth across all our ecommerce metrics.

For context, this is between the pre and mid-Covid norms (4.25% and 5.32% respectively, as illustrated above).

Summary

In summary, we noted the following clear trends:

  • Purchase volumes and product page traffic stabilized at similar levels to pre-Holidays (at around between 1.4x and 1.7x where they were pre-Covid)
  • Review impact on purchase behavior crept back up after a temporary post-Holiday lull.
  • Steady overall increase in review submission levels since early November

As we mentioned in last month’s report, 2020 is likely to have accelerated the transition online like no other event in the Internet age. More sustainable growth is likely post-Covid – as the below projected chart from eMarketer outlines.

In fact, eMarketer predicts that ecommerce growth in 2021 will be significantly less than half of where it was in 2019. However, coming off the back of the biggest year of ecommerce growth in history (32.4% year-on-year according to eMarketer), the overall trend of an increasing share of dollars being spent online (compared to instore) is a continuing and unpreventable process.

How the Covid era has shaped consumers’ grocery shopping habits, according to research of 8,000 U.S. shoppers.

Survey at a Glance:

The PowerReviews Evolution of the Modern Grocery Shopper report is based on survey responses from 7,916 grocery shoppers across the United States. Key findings include:

More grocery shopping is happening online than ever before
  • 73% of consumers have purchased grocery items online within the most recent three months of being surveyed, compared to 17% when we asked the same question in 2017.

  • 61% of consumers shop for groceries online more now than they did pre-COVID.

  • Top reasons include time savings (59%), personal safety (49%) and avoiding impulse purchases (31%).

  • Ordering directly from a local grocery store (as opposed to — for example — online only ordering services like Instacart or Amazon Fresh) is the most popular way to shop for groceries online; 65% of consumers say they’ve done this.
Brick-and-mortar grocery is alive and well
  • 93% of consumers have made an in-store grocery purchase within the most recent three months of being surveyed.

  • 95% of consumers who have shopped for groceries online have also made an in-store grocery purchase within the same time period.

Ratings and reviews positively impact the behavior of both online and in-store grocery shoppers.
  • 82% of online grocery shoppers say they read reviews at least occasionally.

  • 83% of consumers are at least somewhat interested in accessing product ratings and reviews when they’re considering a new product while shopping in a brick-and-mortar grocery store.

  • 78% of online grocery shoppers are more likely to purchase an unknown grocery item if there are customer reviews for that product. The figure is 64% among in-store shoppers.

Introduction

Traditionally, Grocery Ecommerce Growth Has Lagged Behind Other Categories

Over the past decade, ecommerce has experienced steady growth. In 2010, ecommerce made up a mere 6.4% of overall retail sales. But by 2020, that number had grown to 21.3%. Other product categories, including electronics and footwear, have experienced even more significant growth.

But there’s one category that’s traditionally lagged behind when it comes to ecommerce growth: groceries.

In 2019, eCommerce accounted for only 3% of grocery shopping in the U.S.

According to Bain & Company Research, a mere 3% of grocery shopping in the U.S. happened online in 2019. And our own research from 2017 found that just 17% of consumers had purchased groceries online.

While consumers clearly enjoyed the convenience of shopping online for other product categories, many remained reluctant to purchase groceries online.

COVID Has Caused a Sea Change in Grocery Shopping Habits

Then, the COVID-19 pandemic hit, causing lasting impact to just about every aspect of daily life — including grocery shopping habits. 

With safety top of mind, many shoppers cut down on trips to the grocery store — or eliminated them altogether. And a record number of consumers opted to shop for groceries online — many for the first time ever.

Newly Adopted Grocery Shopping Habits May be Long-Lasting

Of course, some shoppers may abandon online grocery shopping post-pandemic. But many predict the grocery shopping habits adopted during COVID will stick, even when the pandemic is behind us. Case in point? A survey from Acosta found that 75% of shoppers plan to stick to at least some of their new shopping habits post-COVID.

75% of shoppers plan to stick to at least some of their new shopping habits post-COVID.

There’s Plenty of Opportunity for Grocery Brands and Retailers

Grocery shopping behavior continues to evolve. Brands and retailers must continuously adapt to meet (and exceed) the changing expectations of shoppers. 

And there’s plenty of opportunity for those that do. Incisiv predicts that by 2025, online grocery will account for 21% of total grocery sales, or $250 billion. That’s an 8% increase over pre-pandemic estimates.

By 2025, online grocery will account for 21% of total grocery sales.

Grocery Brands and Retailers Must Adapt to Thrive

But in order to grow market share, brands and retailers must first understand how grocery shopping habits are changing and evolving. After all, strategies and tactics that worked just a year ago may no longer be effective.

PowerReviews surveyed nearly 8,000 U.S. consumers to better understand where they’re now shopping for groceries, why they choose the channels they do and what information they depend on to make informed purchase decisions. We also sought to understand how these behaviors have changed in the four short years since we fielded a similar survey — and include these comparisons throughout.

This report explores the key findings of this research and provides impactful, data-driven actions grocery brands and retailers can take to better attract and convert grocery shoppers — both online and in-store.

For the purposes of this report, “grocery” is defined as any product typically found in a grocery store, including (but not limited to) produce, fresh/dry/frozen foods, cleaning products, health and beauty items, soft drinks and alcoholic beverages.
Who We Surveyed

Generations

Gen Z
(1997-present)
1%
Millennials
(1981-1996)
39%
Gen X
(1965-1980)
40%
Baby Boomers
(1946-1964)
20%

Geography

Household Income

Where Today’s Consumers Shop for Groceries

In the past, when it was time to stock up on food, drinks and other household essentials, a consumer had little choice but to head to the grocery store. But today, grocery shoppers have myriad digital options to choose from. And as it turns out, the pandemic has made them more likely to give these online grocery shopping options a try.

Online Grocery Shopping is Experiencing Explosive Growth

The pandemic ushered in unprecedented eCommerce growth. According to Digital Commerce 360, eCommerce sales were up 44% in 2020 year-over-year.

So it’s probably not surprising that grocery eCommerce also experienced a significant boost.

Our research found that nearly three-quarters (73%) of consumers have purchased grocery items online in the past three months. In comparison, a mere 17% of consumers answered yes to this question in 2017.

Growth of Online Shopping
Have you or anyone in your household made an online grocery purchase in the last 3 months?

Many shoppers have increased their use of online grocery shopping services during the pandemic, too. In fact, 61% of consumers say they shop online for groceries more now than they did before COVID. 

How COVID has Impacted Online Grocery Shopping
Do you buy groceries online more or less often now than pre-COVID?

Age, Geography, and Income Level Impact Likelihood of Online Grocery Shopping

It’s interesting to note that younger generations are more likely to shop for groceries online. 80% of Millennials and 74% of Gen Z shoppers had purchased groceries online in the most recent three months of being surveyed, compared to 60% of Baby Boomers and 72% of Gen X. 

Online Grocery Shopping by Generation
Have you or anyone in your household made an online grocery purchase in the last 3 months?

In addition, geographical location impacts a consumer’s likelihood of purchasing groceries online. 80% of city dwellers purchase groceries online, compared to 65% of consumers living in a town with a population less than 50,000 — which makes sense given there are more options for those living in larger cities. 

Online Grocery Shopping by Geographic Location
Have you or anyone in your household made an online grocery purchase in the last 3 months?

Finally, the higher the income, the more likely a consumer is to shop for groceries online. 80% of those who make over $100,000 have shopped online for groceries, compared to 64% of those who make $0-$25,000. This makes sense, as many grocery services charge a premium for online shopping. 

Online Grocery Shopping by Income Level
Have you or anyone in your household made an online grocery purchase in the last 3 months?

Consumers Buy Groceries Online to Save Time and Ensure Personal Safety, Among Other Reasons

More consumers are opting to purchase groceries online. But what are the reasons behind this dramatic shift in shopping behavior? 

Time savings is the most popular reason. 59% of consumers indicate it’s a key reason they choose to purchase groceries online, which indicates that the trend is likely to stick post Covid. And 49% say they purchase groceries online for personal safety reasons, which makes sense in the midst of the ongoing pandemic.

Top Reasons Consumers Choose to Shop for Groceries Online

Brick-and-Mortar Grocery Shopping is Still Alive and Well

Online grocery shopping is experiencing a surge in popularity. But that’s not to say grocery stores will soon be a thing of the past. Quite the opposite: brick-and-mortar grocery continues to thrive. Nearly all (93%) of consumers said they had made a grocery purchase in a physical store location within the most recent three months of being surveyed. 

93% of consumers have made an in-store grocery purchase within the most recent three months of being surveyed.

And as it turns out, most consumers are doing a blend of online and in-store grocery shopping. 95% of consumers who have shopped for groceries online have also made an in-store grocery purchase within the same time period.

95% of consumers who have shopped for groceries online have also made an in-store grocery purchase within the most recent three months of being surveyed.
How Consumers Shop for Groceries Online

It’s clear that online grocery shopping is quickly growing in popularity. But where exactly are these online shoppers purchasing their groceries? And what items are they buying when they do? 

Consumers Use a Variety of Online Grocery Services

Today, there are a growing number of online grocery shopping options. Which are winning among consumers?

When asked where they’d purchased grocery items online from, more than half (65%) said they’d ordered pickup or delivery from a traditional grocery or big-box store. In comparison, only 38% chose this option when we surveyed consumers in 2017. 

Nearly a quarter (22%) use an online-only service, such as Amazon Fresh or Boxed.com. Other popular options are a third party delivery service, such as Instacart (20%) and meal boxes (15%), such as Blue Apron or Hello Fresh. 

It’s also worth noting that a third (34%) of online grocery shoppers use more than one online grocery service.

Top Online Grocery Services
2017 vs. 2021

Online Grocery Shoppers Fill Their Shopping Baskets with a Variety of Items

Four years ago when we asked grocery shoppers what types of products they’d purchased online, items that didn’t require refrigeration topped the list. 

And that’s still the case. 70% of online shoppers indicate they’ve purchased non-perishable packaged foods online. Other popular product categories for online grocery shopping are personal care items (64%), home care items (61%) and soft drinks (58%). 

But online shoppers aren’t completely steering clear of perishable items. 56% have purchased fresh food, such as meat, product and dairy online, and 54% have purchased frozen foods. 

It’s also interesting to note that the percentage of shoppers purchasing every single category has increased since 2017.

Online Grocery Shoppers Purchase a Variety of Items
2017 vs. 2021

Online Grocery Shoppers are Willing to Try New Products

There’s no doubt online grocery shoppers stock up on the same tried-and-true items staples time and time again. For example, most families probably add the same brands of milk, bread and eggs each time they place an order. 

But the majority (83%) of online grocery shoppers are also open to purchasing products they’ve never tried before. Millennials (89%) are the generation most likely to try new products when shopping online for groceries, and Baby Boomers (72%) are the least likely.

Openness to New Products
Are you open to buying products online that you haven't bought in-person?
Openness to New Products By Generation
Are you open to buying products online that you haven't bought in-person?

In addition, as household income increases, so too does likelihood that a shopper will try a new product. 77% of those who make $0-$25,000 are open to buying new grocery products online, compared to 85% of consumers with incomes higher than $100,000.

Openness to New Products By Income Level
Are you open to buying products online that you haven't bought in-person?

In addition, nearly a quarter (21%) of shoppers say they’re more open to buying a new (to them) product when shopping online than they would if they were shopping in a brick-and-mortar store. And over half (58%) say they’re as likely to try a new product online as they are in a store. This is interesting, as it proves that online grocery shoppers don’t necessarily need to see and touch a new product in person before committing to a purchase. We’ll dig into what gives them the confidence to try a new product later in this report. 

Are you more or less open to buying a new grocery product online than you are in-store?
The Impact of Reviews on Online Grocery Shopper Behavior

By now, the importance of reviews is well understood. But just how impactful is this content for online grocery shoppers? Let’s take a closer look.

Most Online Grocery Shoppers Depend on Reviews

Shoppers turn to reviews when shopping for just about all types of products. And groceries are no exception. 82% of online grocery shoppers say they read reviews at least occasionally. Of online grocery shoppers that read reviews, 17% always read reviews and 25% do so regularly. 

Frequency of Review Consumption Among Online Grocery Shoppers

As expected, review consumption is more frequent among younger grocery shoppers. 

Review Consumption by Generation
Boomers
Gen X
Millennials
Gen Z

Reviews Entice Online Grocery Shoppers to Learn More About a Product

When grocery shoppers browse online, reviews often spark interest — and increase the likelihood of clicking through to a product page to learn more. 

Nearly half (47%) say they’re more likely to click through to a product page from search results or a grocery store’s homepage if there are ratings and reviews highlighted in these locations. 

Reviews Positively Impact Click Through Rate
Are you more or less likely to click through to a product page (from search results, homepage, etc.) if there are ratings and reviews highlighted?

Millennials and Gen Z shoppers are even more likely to be influenced by the presence of reviews. Over half (53%) of each of these age groups indicate they’re more likely to click through to a product page if there are ratings and reviews highlighted on the homepage or in search results. 

Impact of Reviews on Click Through Rate, By Generation
Are you more or less likely to click through to a product page (from search results, homepage, etc.) if there are ratings and reviews highlighted?
Boomers
Gen X
Millennials
Gen Z

Reviews Give Online Shoppers Confidence to Try New Grocery Products

As mentioned earlier in this report, the majority of online grocery shoppers are open to purchasing products they’ve never tried before. But there’s a level of risk involved with purchasing a new or unknown product — especially when a shopper can’t first see it in person. What helps online grocery shoppers overcome that risk and convert? Oftentimes, reviews.

Over three-quarters (78%) of online grocery shoppers say they’re more likely to purchase a grocery item they’ve never bought before if there are customer reviews for that product, up from 72% in 2017. This number is even higher among Millennial (83%) and Gen Z (89%) shoppers.

How Reviews Impact Likelihood of Trying New Products By Generation
Are you more likely to purchase a new grocery product if there are customer reviews for it?

What elements of reviews and other types of user-generated content do grocery shoppers find most useful when making purchase decisions? 67% of shoppers say it’s useful to read other customers’ opinions on specific details relevant to a product. A product’s average star rating is valuable information to 65% of shoppers, and the volume of reviews matters for 53%. 

Many grocery shoppers also value other types of UGC, including Q&A (50%) and visual content such as photos (36%) and videos (16%).

UGC Elements that Online Grocery Shoppers Find Most Useful

These findings point to the importance of generating a steady stream of reviews, Q&A and visual content for all of your grocery products. 

Meeting the Expectations of Online Grocery Shoppers

In order to attract and retain the growing number of online grocery shoppers, businesses must consistently meet (and exceed) customer expectations. One key way of doing that? Providing online shoppers with all of the content they need to make confident shopping decisions — including reviews — in the places they want to find this content.

Shoppers Seek Reviews for a Variety of Grocery Products

We know that the majority of online shoppers read reviews at least occasionally. But do reviews matter more for certain types of grocery products? 

Some categories do rise above the others. Three-quarters (76%) of online grocery shoppers want to access reviews for personal care items, and 70% desire this content for home care products. But the reality is, modern consumers want to access ratings and reviews for a wide array of grocery products, from non-perishable items and frozen foods to soft drinks and baby care items. And their appetite for this content has only grown since we last surveyed grocery shoppers in 2017.

Online Shoppers Want Reviews for a Variety of Grocery Products
2017 vs. 2021

Where Online Grocery Shoppers Want to Access Reviews

Online shoppers want to access reviews for a wide variety of grocery products. But where do they ideally want to find this content? 

80% want to find reviews directly on the website or app they’re purchasing from. And 40% seek reviews for grocery products on Amazon. Other preferred spots for finding reviews are search engines (27%) and third party reviewers or review sites (22%).

Where Online Grocery Shoppers Want to Find Product Reviews

This points to the importance of collecting reviews for plenty of your grocery products — then displaying this content so it’s easy to find on your website and mobile app. If you don’t, you risk losing shoppers to Amazon or another service that displays this content. 

How Today’s Shoppers Navigate Brick-and-Mortar Grocery Stores

While online grocery shopping has hit record levels, it’s important to remember that physical store locations aren’t going anywhere anytime soon. As we revealed earlier, nearly all (93%) of those we surveyed said that someone in their household made an in-store grocery purchase within the last three months. And 95% of online grocery shoppers also make in-store grocery purchases. 

But while brick-and-mortar grocery is certainly alive and well, the way shoppers navigate the aisles and the information they use to make purchase decisions is changing.

Most Shoppers Use Their Mobile Phones In-Store

The majority of shoppers (87%) use their mobile phone as a tool while shopping in a physical grocery store. In comparison, 59% said they used their phone to aid in in-store grocery shopping when we asked this question in 2017.

The most popular activities in-store grocery shoppers are using their phones for are finding or redeeming coupons (67%), reviewing shopping lists (47%) and reading product ratings and reviews (42%). It’s worth noting that in-store shoppers are doing all of these activities much more frequently than they were in 2017.

How In-Store Grocery Shoppers Use Their Phones
2017 vs. 2021
How Reviews Can Impact In-Store Grocery Shopping Behavior

Online grocery shoppers depend on reviews to make informed purchase decisions. And as the findings of this survey indicate, this content has the power to impact in-store grocery shopping, too. 

In-Store Shoppers Want Reviews for New or Unknown Products

An in-store shopper is unlikely to consult reviews for their tried-and-true grocery products. But when they’re considering a product they’ve never purchased before, this content can be extremely valuable.

The majority (83%) of consumers are at least somewhat interested in accessing product ratings and reviews when they’re considering a new product while shopping in a brick-and-mortar grocery store. This is up significantly from 2017, when 68% of consumers indicated they wanted access to this content. Of note, Millennials are the generation most likely to be interested in reviews when considering a new product in-store.

Consumer Interest in Reviews When Considering a New Product In-Store
When considering a new grocery product, how interested are you in accessing product ratings and reviews while shopping in a grocery store?

Reviews Boost In-Store Shoppers’ Confidence

We already know that 78% of online grocery shoppers are more likely to purchase an unknown grocery item if there are customer reviews for that product. And as it turns out, this content can boost confidence for in-store shoppers, too. 

When shopping in a grocery store, 64% of shoppers say they’re more likely to purchase a grocery item that they’ve never purchased before if they are able to read customer reviews for the product. In 2017, 52% of consumers indicated this was the case. In line with other survey findings, younger grocery shoppers are even more likely to be persuaded to buy unknown products after reading reviews.

Impact of Reviews on the Likelihood to Purchase a New Grocery Product In-Store
While shopping in a grocery store, are you more likely to purchase a grocery item you’ve never bought before if you’re able to read customer reviews?
Impact of Reviews on the Likelihood to Purchase a New Grocery Product In-Store By Generation
While shopping in a grocery store, are you more likely to purchase a grocery item you’ve never bought before if you’re able to read customer reviews?
Boomers
Gen X
Millennials
Gen Z

How Grocery Shoppers Want to Access Reviews While Shopping In-Store

In-store grocery shoppers want to read customer reviews — especially for products they’ve never purchased before. But how do they want to access this content when receiving communications from a grocery provider or shopping in a grocery store?

The most popular answer is through the store or grocery provider’s app, with 49% of in-store grocery shoppers indicating this is where they want to find ratings and reviews. But plenty of shoppers want to see reviews on in-store signage, as well as through other print and digital marketing channels.

Where In-Store Grocery Shoppers Want to See Ratings and Reviews
When receiving communications from a grocery provider or shopping in a grocery store, where do you want to see ratings and reviews?

Make sure you have easily accessible reviews on your mobile app. And look for opportunities to enhance your in-store signage and marketing campaigns with this powerful social proof. 

5 Ratings & Reviews Recommendations for Grocery Businesses

The way consumers are shopping for groceries has changed — perhaps for good. Grocery brands and retailers must adapt quickly in order to attract, convert and retain shoppers — whether they shop online, in-store or a combination of the two. 

Read on for five impactful actions to take to better meet (and exceed) the expectations of modern grocery shoppers, based on the key findings of this report.

1
Collect reviews.

Online and in-store shoppers alike have a growing appetite for reviews across a number of grocery categories. And the presence of this content increases the likelihood that a shopper will try a product they haven’t purchased before. If you’re not already, start collecting reviews across your product catalog.

Display reviews on your website and mobile apps.

Once you’ve started collecting reviews, be sure to prominently display this content on your website and mobile apps. Both online and in-store grocery shoppers are seeking out reviews on these channels.

2
3
Display review content in-store.

Nearly half (49%) of in-store grocery shoppers want to access ratings and reviews via your website or mobile app. But there’s also a good number of shoppers who want to find this content within the store itself. So look for opportunities to enhance your shelf tags, price labels, store signage and even the packaging of your products with star ratings and review information.

Consider product sampling.

Reviews are especially important when shoppers are considering grocery items they’ve never purchased before. So if you’re launching new grocery items in the coming year (or if you have products with a high volume of traffic and a low volume of reviews), consider sending out free samples in exchange for honest reviews. After all, three-quarters (78%) of online grocery shoppers and 64% of those who shop in-store are more likely to purchase a grocery item if they’re able to read reviews for the product first.

4
5
Regularly analyze review content to identify areas to improve.

Reviews are a gold-mine of insights that can help you understand what your shoppers love about your products — and what they don’t. By regularly analyzing your review content, you can uncover opportunities to improve your products and your customer experience. And by making data-based, impactful changes, you’ll boost customer loyalty — and your bottom line. 

This is the PowerReviews monthly snapshot trends report for March 2021, an analysis of consumer activity across more than 1.5MM online product pages from more than 1,200 retail/brand sites.

We started measuring at the start of Covid. To recap, a huge initial surge led to an overall 3x increase in online purchase volumes between February (pre-pandemic) to May 2020. However, the subsequent four months through to October led to a steady decline and then stabilization, with purchase volumes consistently between 40% and 70% higher than they were pre-pandemic (we actually re-aligned our reports to three month periods due to this stabilization).

We then saw a slight uptick in preparation for the Holidays (remember: shopping was expected to start early this year).

Then onto the Holidays, when the typical marked seasonal increase materialized.

Read on to find out the key trends post-Holidays as the Covid vaccine began to be rolled out across the country.

Key ecommerce market trends

01

Purchase volumes and site traffic return to pre-Holidays “norms”

02

Review submission volumes increase

03

Reviews still driving purchases more than they were a year ago

Purchase volumes and site traffic return to pre-Holidays “norms”

Prior to the Holidays, consumer behavior had clearly become more predictable, with purchase volumes consistently around 1.4x to 1.7x where they were before the pandemic (this was after a giant surge in April, May and June). So remember that is the baseline we’re dealing with in the chart below.

After the Holiday surge, ecommerce purchase volumes settled to similar levels to where they were pre-Holiday (i.e. in the range of 1.4x to 1.7x where they were pre-Covid).

Review Submission Volumes Increase

In the last snapshot, we noted a surge in review submission volumes – when we saw the biggest increase in review collection of the year, with a giant surge evident at the end of November.

This trend – broadly speaking – held throughout the entire month of December – and on December 28 actually peaked at a level 90% higher than where it was at the start of October.

Interestingly, this broad trend continued throughout January and February – this is potentially a hangover from the significant increase in sales volumes over the Holidays. But – as our recent survey proved – most consumers leave reviews within a week of receiving a product having used it once or twice.

Despite the increase in volumes, trends evident in review length and sentiment were broadly consistent with everything we saw throughout 2020. However, there was a very slight dip in length – fluctuating at a maximum of -10% and +15% of where they were at the start of November – during this period.

Review length and sentiment continues to be stable

Reviews still driving purchases more than they were a year ago

Over the last few monthly snapshots, we have included a deep dive into the impact of review content on the buyer journey – paying particularly close attention to year-on-year comparisons during the Holidays.

To recap, the charts in this section highlight the percentage of online shoppers who go onto purchase after they’ve interacted with review content (i.e. searched, filtered, clicked to extend the review from preview to view entire content etc.)

We found that review interactors were consistently converting at around a 25% higher rate than they were a year previously (the conversion figure is typically around 5.25% in the three months prior to Black Friday, compared to around 4.25% in the same period for in 2019).

For context, this figure had come down from its Covid peak (as also demonstrated below) of 6.85% in April. This is in line with when we saw the highest ecommerce purchase volumes (when they hit a peak of 210% above where they were pre-COVID at this time).

However, the influence of reviews surged to their highest rate of the year during the 2020 Cyber 5, with 7.41% of review interactors going on to purchase (an increase of 30%). As you can see from the charts, this is entirely in line with typical trends. Reviews always become more impactful on the buyer journey during the Holidays.

During January and February 2021, reviews continued to be more influential on the buyer journey than they were a year prior. But the difference was much less marked. We’ll wait before calling this a trend in light of what we saw pre-Holidays.

Summary

In summary, we noted the following clear trends:

  • Purchase volumes and product page traffic stabilized at similar levels to pre-Holidays (at around between 1.4x and 1.7x where they were pre-Covid)
  • Reviews are still having more of an impact on purchase behavior than this time last year but the extent to which this is the case has fallen compared to what we saw pre-Holidays
  • Review submission levels have increased steadily over the past three months

Realistically,  as we look ahead to the rest of 2021, it’s likely that 2020 accelerated the transition online like no other event in the Internet age. More sustainable growth is likely in a post-Covid world – as the below projected chart from eMarketer outlines.

In fact, eMarketer predicts that ecommerce growth in 2021 will be significantly less than half of where it was in 2019. However, coming off the back of the biggest year of ecommerce growth in history (32.4% year-on-year according to eMarketer), the overall trend of an increasing share of dollars being spent online (compared to instore) is a continuing and unpreventable process.

How today’s consumers are shopping for beauty products in the midst of the COVID-19 pandemic, according to responses of 10,000+ shoppers.

Survey at a Glance:

The PowerReviews Changing Face of the Beauty Shopper Study draws on survey responses from 10,646 active beauty consumers across the country. Key findings include:

Beauty spending has shifted online
  • 87% say they spend more or the same online than before Covid

  • 49% say they now spend more than $50 online on beauty products; compared to 16% than when we asked this same question in 2019

  • 57% of shoppers say that they had never tried more of a quarter of the beauty products they bought online in 2020 (i.e. they were first time purchases)

  • However, in-store beauty spending at this level has also increased: 41% say they now spend more than $50 in store, compared to 21% in 2019; 55% also say they use curbside pick-up more than before the pandemic

User Generated Content (i.e. Ratings & Reviews) is CRITICAL regardless of shopping channel and has increased in importance
  • 99% always or sometimes read ratings and reviews when shopping for beauty products online, same figure for in-store shoppers is 85%

  • 79% focus on average star rating, 58% care about overall volume of reviews and 49% say they look for recent review content.

  • 41% say they rely on reviews more than they did pre-Covid. This is most prominently the case among younger generations, with 58% of Gen Zers claiming this to be the case.

  • User-generated imagery and video is also key, with 38% saying it’s more important than before the pandemic (again this figure is highest among Gen Zers at 53%)

Social and political issues are also now significantly impacting shopping behaviors:
  • 76% focusing on buying products that are sustainably made

  • 50% actively seek out products made by Black-owned beauty brands.

Introduction

Beauty Shopping is at an Inflection Point

In the past, when a shopper was in the market for a beauty product such as lipstick, mascara or moisturizer, they’d drive to their neighborhood drug store or pay a visit to a beauty counter at a local department store. And when they did, they’d find shelves dominated by products manufactured by a relatively small number of legacy brands.  

But that’s no longer the case. The way consumers shop for beauty products is constantly evolving — a process supercharged by the Covid pandemic.

A growing number of consumers now purchase beauty products online. This has inevitably led to an increased dependence on user-generated content as shoppers seek validation for their purchases.

What’s more, new beauty brands and products seem to emerge daily. And the criteria shoppers use to make purchase decisions is evolving; increasingly, shoppers seek out brands and products that align with their values. 

The Covid Pandemic Has Impacted Beauty Shopping Habits -- Perhaps for Good

Just when it seemed businesses finally had a handle on the shopping habits and preferences of beauty shoppers, Covid hit. The global health crisis has had a huge (and lasting) impact on just about every facet of life — including the way we shop.

There’s Plenty of Opportunity for Customer-Centric Beauty Businesses

Beauty brands and retailers must adapt their plans and strategies to effectively reach and convert today’s shoppers. And there’s plenty of opportunity for those that do. According to a report from Fior Markets, the global beauty and personal care products market was $493 billion in 2018. By 2026, it’s expected to reach $756 billion.

By 2026, the global beauty and personal care products market is expected to reach $756 billion.

In order to develop effective strategies, though, brands and retailers must first understand how consumers are shopping for beauty products — and how the global health crisis has shaped these habits.

Adjust Your Strategy to Attract and Convert More Beauty Shoppers

Recently, PowerReviews surveyed 10,646 consumers to shed light on the shopping habits and preferences of those purchasing beauty products — specifically makeup and skincare items. We also aimed to understand how beauty shopping habits have changed since 2019, when we fielded a similar survey

This report will share the key findings of our research — as well as practical, impactful actions beauty brands and retailers can take to meet (and exceed) the expectations of today’s beauty shoppers…and boost their bottom line. 

For the purposes of this report, “beauty” is defined as products in the makeup and skincare categories.
Who We Surveyed

Generations

Gen Z
(1997-present)
3%
Millennials
(1981-1996)
49%
Gen X
(1965-1980)
36%
Baby Boomers
(1946-1964)
12%

Type of Beauty Shopper

Beauty Novice
Just getting into the beauty space and curious what’s out there.

15%
Brand Loyalist
Mostly sticks to the products and brands that are tried and true.
19%
Beauty Enthusiast
Always searching for the next best beauty products and brands.
66%

Shopper Type by Generation

Gen Z
Millennials
Gen X
Boomers
Gen Z is the generation most likely to identify as beauty enthusiasts.

Household Income

Impact of Covid on Consumers’ Beauty Habits

The pandemic has turned peoples’ lives upside down. Many people are working from home — while simultaneously supervising their childrens’ eLearning. And the vast majority of vacations and events have been cancelled — at least for the time being.

Beauty Habits Have Evolved

These lifestyle changes have led to changes in beauty habits, too. For example, many consumers are cutting back on makeup use, likely because they’re not leaving the house as much.

In fact, our survey found that more than half (54%) of consumers indicate they wear less makeup now than pre-COVID.

On the other hand, it seems many consumers are making skincare a priority. More than half (56%) indicate they’re more focused on skincare now than they were before the pandemic. 

People are spending more time at home, which means they may have more time to devote to more thoroughly caring for their skin.

Consumers are Focusing Less on Makeup, and More on Skincare

Beauty Spending Has Changed

The pandemic has had a negative financial impact for many consumers. According to the Department of Labor, the U.S. unemployment rate was 6.7% in December 2020.

With so many unemployed (and underemployed) people, it’s not surprising that 41% of consumers say they spend less money on beauty products now than before COVID. Over a third (38%) indicate their beauty spending hasn’t been impacted by COVID, and the remaining 21% say their beauty spending has actually increased.

The Effect of COVID on Beauty Spending

Beauty enthusiasts are the least likely to have decreased their beauty in the midst of COVID (and most likely to have increased spending), when compared to beauty brand loyalists and beauty novices.

The Impact on Spending Habits for Different Types of Beauty Shoppers
Beauty Novice
Beauty Brand Loyalist
Beauty Enthusiast

Income also seems to impact whether shoppers have decreased their beauty spending — but perhaps not as much as expected. Those making higher incomes are just slightly less likely to have cut beauty spending post-COVID than those with smaller incomes.

The Impact of Income on Post-COVID Beauty Spending
  I spend less money on beauty products now than before COVID I spend more money on beauty products now than before COVID The amount of money I spend on beauty products has not changed
$0 – $25,000 44% 18% 38%
$26,000 – $50,000 42% 20% 38%
$51,000 – $75,000 39% 21% 40%
$76,000 – $100,000 38% 23% 39%

$100,000+

38% 24% 38%
Prefer not to say 43% 16% 41%
Where Consumers Shop for Beauty Products

Online Beauty Shopping is Growing

There’s been a well-reported uptick in eCommerce shopping since the start of the COVID-19 pandemic. So it’s probably no surprise that a growing number of shoppers are purchasing beauty products online, too.

More than half of shoppers (53%) buy more beauty products online now, compared to pre-COVID. This number is even higher among younger consumers. 66% of Gen Z shoppers and 58% of Millennials say they spend more online on beauty products now than they did before the pandemic.

Also of note, 60% beauty enthusiasts are spending more online now, compared to 39% of beauty brand loyalists. What’s more, those with incomes of $100,000 or higher are more likely to have increased online beauty spending than their lower-income counterparts.

The Impact of COVID-19 on Online Beauty Spending
Change in Online Spending by Beauty Shopper Type
Beauty Novice
Beauty Brand Loyalist
Beauty Enthusiast
Change in Online Beauty Spending by Income
  I buy less beauty products online now compared to before COVID I buy more beauty products online now compared to before COVID My beauty purchasing habits have not changed
$0 – $25,000 18% 43% 39%
$26,000 – $50,000 13% 50% 37%
$51,000 – $75,000 11% 56% 33%
$76,000 – $100,000 11% 49% 40%

$100,000+

11% 62% 27%
Prefer not to say 14% 47% 39%

We also asked consumers to indicate how much they spend each month on online beauty purchases. And as it turns out, they’re spending significantly more each month compared to just a few years ago when we asked consumers the same question. For example, in 2019, just 2% of respondents indicated they spent more than $101 per month on online beauty purchases. In 2021, that number has grown to 23%!

Monthly Spending on Beauty Products Purchased Online
Roughly how much money did you spend per month on online beauty purchases?
2019
2021

Amazon is Actually Declining in Importance

When it comes to online shopping, there are nearly endless options. So where do online shoppers most often start the purchase journey for beauty products?

The starting point of nearly half (44%) of shoppers is a beauty retailer’s website — think Ulta.com or Sephora.com. Amazon is a distant second, with 22% of shoppers indicating its where they start the online purchase journey for beauty products.

It’s worth noting that when we asked this same question just two years ago, 47% of shoppers indicated they typically start shopping on Amazon. This suggests that Amazon has become less of a threat to beauty retailers.

And by providing great online shopping experiences, it’s very much possible for beauty businesses to compete (and win) against the eCommerce giant.

Beauty Retailer Websites Reign
Where beauty shoppers most often start shopping online

In-Store Beauty Shopping Continues to Thrive

Make no mistake: the rise in beauty eCommerce doesn’t mean stores are dead.

In fact, our data tells us that the amount consumers spend on beauty products in stores each month has actually increased from 2019.

For example, in 2019, during any given month, just 3% of consumers spent more than $101 in a store on beauty products. In 2021, that number grew to 18%.

Monthly Spending on Beauty Products Purchased in a Brick-and-Mortar Store

A key finding of this research is that stores remain a popular place to buy tried-and-true products — and discover new ones. We’ll explore this in more detail later in this report.

Stores Serve as Fulfillment Centers

Curbside pickup — also known as Buy Online Pick up in Store (BOPIS) offers shoppers the best of both worlds. They can browse online and minimize in-person contact — but still enjoy the (nearly) instant gratification of in-store shopping.

The popularity of BOPIS has grown significantly among beauty shoppers. In fact, 55% say they use curbside pickup for beauty products more now than they did pre-pandemic.

Younger generations are taking advantage of curbside pickup even more. 60% of Millennials and 58% of Gen Z shoppers say they’ve ramped up their use of BOPIS services for beauty products.

BOPIS is Growing for Beauty Shoppers
Do you use curbside pickup more now than pre-pandemic?
The Role of UGC in Beauty Shopping

User-generated content — including reviews, Q&A, photos, and videos — has a big impact on purchase decisions. That’s not exactly news.

But thanks to this survey, we can now clearly see that for beauty shoppers, this content has never been more important.

Reviews Fuel Smart Beauty Purchase Decisions Online and In Store

Our research found that all shoppers (99%) read reviews at least sometimes when shopping online for beauty products, with 54% saying they always do so.

Reviews matter for in store shoppers, too. 85% say they read reviews at least sometimes when shopping for beauty products within the four walls of a brick and mortar store.
How do they want to access reviews when shopping in a store? Nearly half (45%) prefer to find reviews by visiting the brand or retailer’s website on their phones.

The message here? Ensure your reviews are easy for shoppers to find and consume — regardless of device.

Online and In Store Shoppers Read Reviews
Where In-Store Shoppers Want to Find Reviews

What elements of reviews do beauty shoppers value when making purchase decisions?

79% say the average star rating is important. More than half (58%) care about the overall number of reviews for a product. And 49% say the number of recent reviews is important. Note: respondents could select all that applied.

Review Elements that Matter to Beauty Shoppers

This highlights the importance of consistently generating a steady stream of great reviews.

Helpful Hint: Recency, quantity and quality of reviews all matter to beauty shoppers! So make it a priority to collect plenty of great reviews on an ongoing basis.

During the Pandemic, Dependence on Reviews Has Increased

It seems shopper dependence on reviews has only grown in the midst of the COVID-19 pandemic. 41% of beauty shoppers indicate they’re more reliant on ratings and reviews now than they were before the start of the global health crisis. This number is even higher — 58% — among Gen Z shoppers.

41% of beauty shoppers are more reliant on ratings and reviews now than pre-pandemic. This number increases to 58% for Gen Z shoppers.
Increased Dependence on Reviews by Generation
Are you more reliant on reviews now than before COVID?

Beauty Shoppers Rely on User-Generated Visual Content

Beauty products are highly personal purchases. While a children’s toy will look the same regardless of who buys it, a makeup item will look different on every person.

Customer-submitted photos and videos help shoppers understand what a beauty product will look like on someone like them. During Covid, user-submitted visual content has become even more important.

Just over a third (38%) of those we surveyed say they are more reliant on user-submitted visual content now, compared to pre-Covid. This number soars to 53% among Gen Z shoppers. Clearly, these younger consumers have an appetite for user-submitted photos and videos.

38% of beauty shoppers are now more reliant on user-submitted visual content than they were pre-COVID. This number increases to 53% among Gen Z shoppers.
Increased Dependence on User-Submitted Visual Content by Generation
Are you more reliant on user-submitted photos and videos now than before COVID?
Helpful Hint: User-generated photos and videos help beauty shoppers get realistic expectations of products -- especially when they can’t try them out in person first! Be sure to collect plenty of photos and videos from your shoppers.

For Online Beauty Shoppers, Q&A Replaces the In-Store Associate

When a consumer is shopping in a brick-and-mortar store and has a question about a beauty product, they can ask an in-store associate. But when they’re shopping online, they often turn to the product’s Q&A (and as we mentioned earlier, consumers are shopping online a whole lot more these days).

So it’s probably not surprising that over a third (36%) of beauty shoppers say they’re more reliant on Q&A now than pre-COVID. Gen Z is the generation with the largest increase in dependence on Q&A. Nearly half (46%) say they depend on this content more now than they did before COVID.

36% of beauty shoppers are now more reliant on Q&A than they were pre-COVID. At 46%, this number is significantly higher for Gen Z shoppers.
Increased Dependence on Q&A by Generation
Are you more reliant on Q&A now than before COVID?
How Shoppers Restock on Tried-and-True Beauty Products

There are beauty products that a given consumer will turn to time and time again. Perhaps it’s a foundation that perfectly matches a shopper’s skin tone — or maybe it’s an eye cream that instantly makes them look like they got a solid eight hours of sleep.

Let’s take a closer look at how consumers shop for these tried-and-true beauty products.

Beauty Brands and Retailers are Gaining Traction

Consumers have countless shopping options. But when it comes to shopping for beauty products they’ve tried before, a few of those options rise to the top.

Nearly a quarter (22%) will buy on a specialty beauty retailer’s website, and 21% will opt for a mass retailer’s store — such as Walmart or Target. Another 18% will purchase at a specialty beauty retailer’s store and 17% will buy on Amazon.

Other less popular spots for stocking up on tried-and-true beauty products include mass retailers’ websites (12%) and brands’ websites (10%).

Interestingly, the popularity of speciality beauty retailer stores and websites — as well as brand websites — has soared since the last time we surveyed beauty shoppers.

On the other hand, the popularity of Amazon and mass retailers seems to have waned — at least when it comes to beauty products. Cleary, it’s very much possible for beauty brands and retailers to compete and win.

Where Consumers Shop for Tried-and-True Beauty Products

When stocking up on tried-and-true products, what makes a shopper choose one store or website over another? Some of the top reasons include convenience, low prices, free shipping, fast delivery and loyalty points.

A Variety of Factors Attract Beauty Shoppers Stocking up on Habitual Products
Why do you choose one store or website over another?

Consumers Purchase Habitual and New Beauty Products at the Same Time

When consumers are stocking up on their go-to beauty products, they don’t just grab what they need and head for the checkout.

Instead, 94% of consumers say that when they’re purchasing a habitual product, they’re at least somewhat likely to also buy a new product during the same transaction. This is up from 82% when we asked the same question just a couple years ago.

It seems today’s beauty shoppers are more willing to try something new than they were just a few years ago — which we’ll explore more in the next section.

Shoppers More Likely to Try Something New
When purchasing a habitual product, how likely are you to also buy a new product during the same transaction?
How Consumers Discover New Beauty Products

Today, consumers are spending more time at home. Many are using this as an opportunity to do things they didn’t have the time for before — like trying out new beauty products.

In fact, two in five (40%) of those we surveyed said they’re more likely to try new-to-them beauty products now than pre-Covid. This number is even higher for Millennials (46%) and Gen Z (53%). What’s more, beauty enthusiasts are more likely to try new beauty products (45%) than those who identify as beauty brand loyalists (26%) and beauty novices (36%).

Beauty Enthusiasts are Trying New Products Post-COVID
Are you more likely to try new-to-you beauty products now than pre-Covid?

Where are they shopping for these products? And what information do they depend on to make confident purchase decisions? Let’s take a closer look.

Shoppers Purchase New Beauty Products From a Variety of Sources

Whether they’re shopping online or in-store, beauty shoppers are spending a good chunk of their budget on products they’ve never tried before.
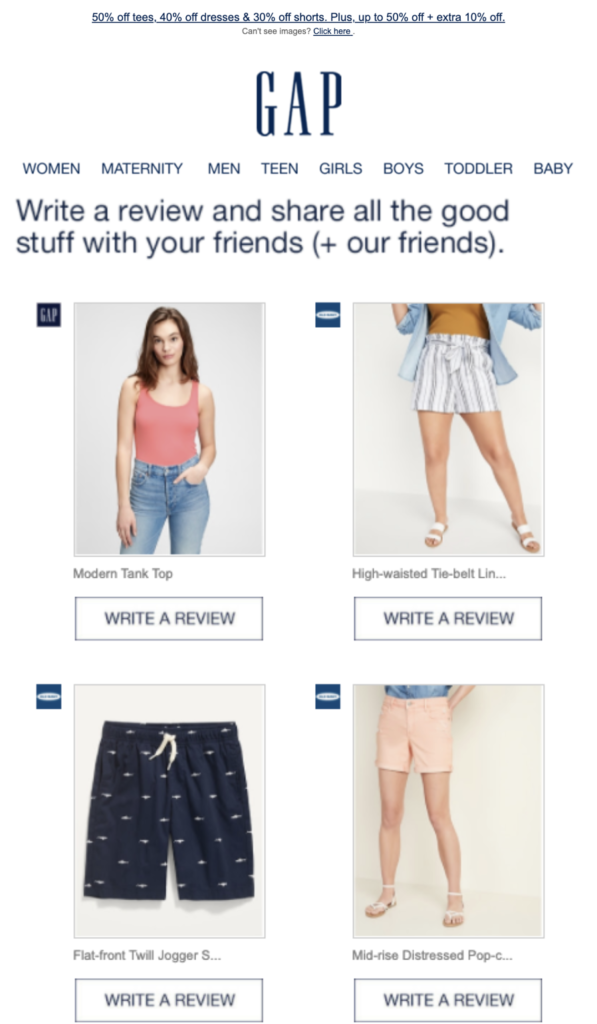
Of note, online shoppers are slightly more likely to spend 51-100% of their budget on new products than those shopping in-store.
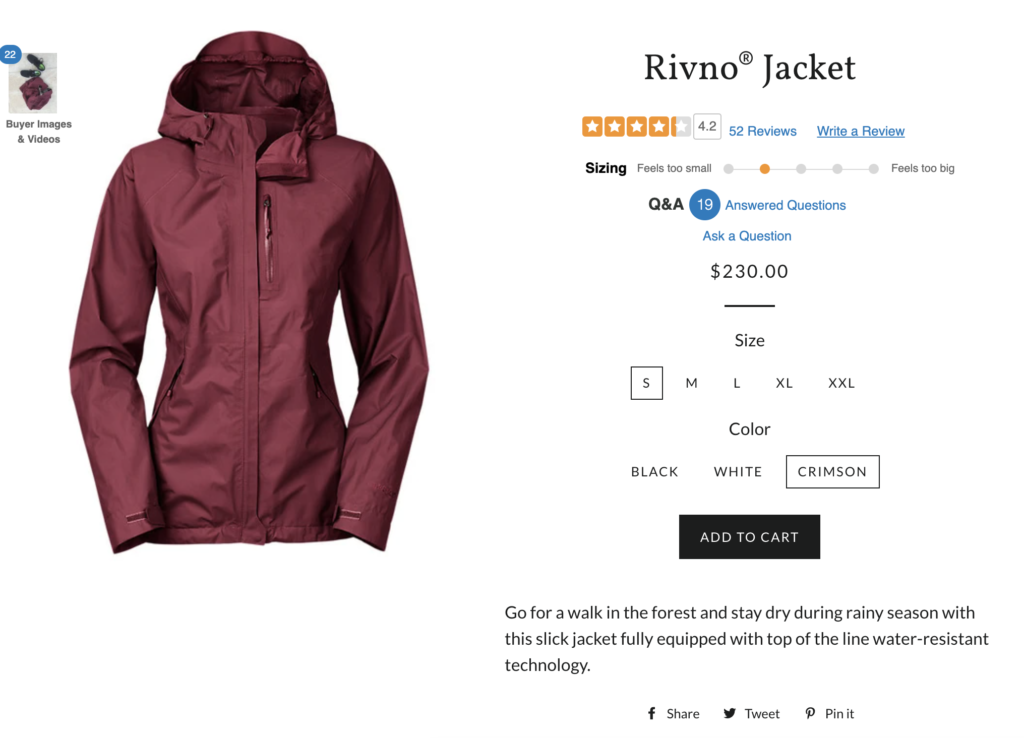
What Percentage of Your 2020 Beauty Purchases Were For Products You’d Never Tried Before?
Online vs In Store

Where are consumers shopping for these new-to-them beauty products? The top five destinations for purchasing new beauty products are a specialty beauty retailer’s website (24%), Amazon (18%), a speciality beauty retailer’s store (17%), a mass retailer’s store (15%) and a brand website (11%).
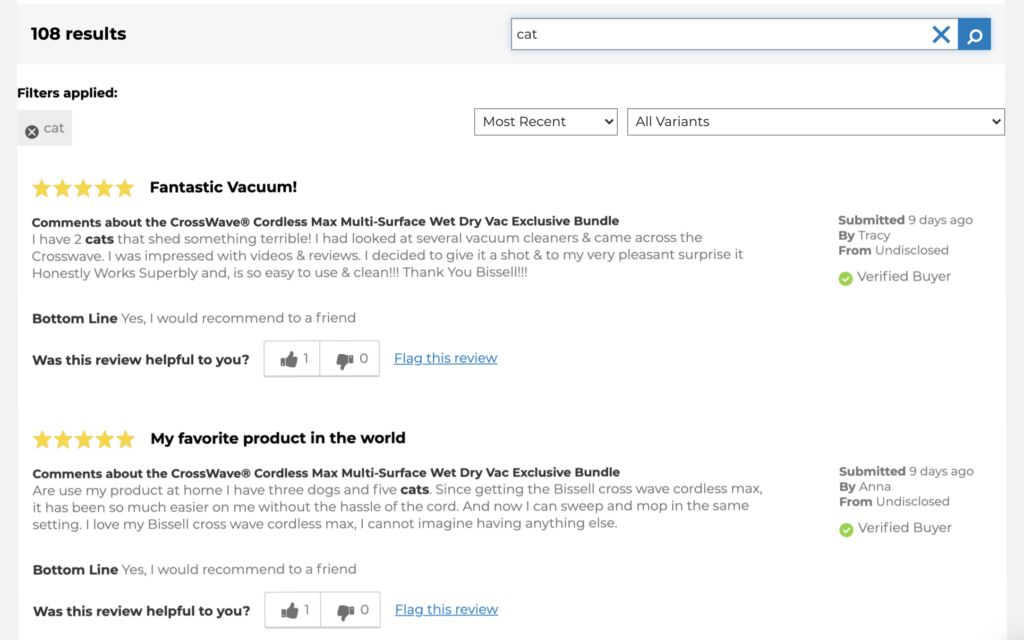
Consistent with other findings in this survey, brand and specialty beauty retailer stores and websites are gaining traction when compared to our results from 2019 — with Amazon losing favor.

Where Do Consumers Shop for New-to-Them Beauty Products?
2019 vs 2021

Reviews Motivate Beauty Shoppers to Try New Products

There’s a certain level of risk associated with purchasing a product you’ve never bought before. So how do shoppers gain the confidence they need to purchase new-to-them beauty products?

Three-quarters (74%) say ratings and reviews motivate them to try new beauty products. This number jumps to 79% for both Millennial and Gen Z beauty shoppers.

In fact, for all age groups, it seems this content is significantly more impactful than recommendations from family and friends (47%) and price (37%)!

Top 5 Motivators for Trying New Beauty Products
The Impact of Influencers on Shopping Behavior

Our survey found that nearly half (45%) of shoppers are motivated by social media to try new beauty products. This number is even higher for Millennials (52%) and Gen Z (63%).

So it makes sense that a growing number of brands are investing in influencer marketing. MediaKix predicts that brands will spend up to $15 billion on influencer marketing by 2022.

But how exactly are beauty shoppers swayed by influencers? Let’s explore.

Shoppers of all Ages are Swayed by Beauty Influencers

Over half (56%) of consumers say they are swayed by the influencers they follow to purchase beauty products. And younger shoppers are even more likely to be influenced.

Three-quarters (74%) of Gen Z shoppers and 66% of Millennials say they are swayed to purchase beauty products by influencers they follow.

Influencers Sway Beauty Shoppers of All Generations
Are you swayed by influencers to buy beauty products?

What’s more, beauty enthusiasts are much more likely to be swayed by influencers than other types of beauty shoppers. This makes sense, as those who identify as beauty enthusiasts are always on the lookout for the next big thing.

Power of Influencers by Shopper Type
Are you swayed by influencers to buy beauty products?

Beauty Shoppers are Loyal to Their Trusted Influencers

Does the number of followers an influencer has impact how much beauty shoppers trust them? For many, it doesn’t.

Over half (52%) of consumers say they trust the influencers they’re loyal to no matter their follow count.

A third (32%) say they’re more willing to trust beauty suggestions from influencers they personally know, and 11% indicate they’re more likely to trust micro-influencers with less than 100,000 followers.

Just 5% of beauty shoppers say they most trust macro-influencers with more than 100,000 followers.

Beauty Shoppers Trust Influencers of all Kinds
Which type of influencer are you most willing to trust when they recommend products?
The Changing Priorities of Today’s Beauty Shoppers

In the past, shoppers weighed factors like price, brand and quality when choosing beauty products. Of course, these factors still matter. But increasingly, beauty shoppers also seek out products and brands that align with their values.

The Majority of Shoppers Plan to Purchase Eco-Friendly Products

For many, the state of the environment is a growing concern. As such, an increasing number of shoppers are seeking out eco-friendly products and brands.

Beauty shoppers are no exception. More than three-quarters (76%) of shoppers plan to buy beauty products in the future that are made sustainably.

Gen Z shoppers (86%) and Millennials (80%) are even more likely to purchase sustainable beauty products.

Beauty Shoppers Across All Generations will Seek Out Sustainable Products

Half of Shoppers Plan to Support Black-Owned Beauty Brands

In 2020, a growing number of consumers took action in the fight for racial justice. One way consumers chose to support this cause was by seeking out and buying from Black-owned businesses.

According to Yelp, from May 25 to July 10, 2020 there were more than 2,500,000 searches for Black-owned businesses — up 7,043% from the same period in 2019.

So it may come as no surprise that half (50%) of consumers say they plan to actively seek out beauty products made by Black-owned beauty brands. This number is even higher among Gen Z (75%) and Millennials (58%).

Younger Consumers Plan to Seek Out Black-Owned Beauty Brands

In addition, beauty enthusiasts are much more likely to seek out Black-owned beauty brands (55%) than beauty brand loyalists (38%) and novices (45%). That makes sense, as these shoppers are typically more open to trying out new products.

Beauty Enthusiasts Most Likely to Seek Out Black-Owned Beauty Brands
6 Recommendations for Beauty Brands and Retailers

The way consumers shop for beauty products is evolving. And the COVID-19 pandemic has only sped up this evolution. Brands and retailers must adapt to meet and exceed the expectations of beauty shoppers — or risk losing them for good.

Read on for six practical, impactful actions to take, based on the key findings of this report.

1
Provide great shopping experiences across channels.

A growing number of consumers are shopping for beauty products online, especially in the midst of the COVID-19 pandemic. But at the same time, brick-and-mortar retail is still very much alive and well. Be sure you’re providing great, seamless shopping experiences across channels. Remember: your shoppers should be able to find all of the information they need to make smart purchase decisions — regardless of whether they’re shopping online or in-store.

Collect and display ratings and reviews.

Shoppers depend on reviews to make informed purchase decisions both online and in-store. And 41% of beauty shoppers rely on this content even more now than pre-COVID. This number is even higher among younger shoppers. Recency, quantity and star rating all matter — so be sure to collect a steady stream of reviews on an ongoing basis. Finally, remember that reviews motivate three-quarters of shoppers to try new beauty products. So if you’re launching new products in the coming year, consider sending out free samples in exchange for honest reviews.

2
3
Showcase visual content from your shoppers.

Beauty products are highly personal. As such, shoppers want to see how a product works (or doesn’t) for someone with similar characteristics. User-submitted photos and videos allow them to do that. And over a third of beauty shoppers are more reliant on user-submitted visual content now than they were pre-COVID. This number is even higher for younger shoppers. So be sure to collect and display photos and videos of your shoppers using your products “in real life.” Collect this content both natively and where it already lives: on social media.

Empower online shoppers to ask questions.

A third of shoppers (and an even greater number of younger shoppers) rely on Q&A more now than they did pre-COVID. If you don’t have Q&A software on your product pages, now’s the time to add it. It’ll help shoppers make smarter purchase decisions — which will lead to happier customers and fewer returns. Also, consider allowing previous customers to answer shopper questions. After all, consumers trust the opinions of others like them!

4
5
Leverage everyday influencers.

Influencers have the power to sway beauty shoppers. But over half of beauty shoppers consider the number of followers an influencer has to be irrelevant. So think about ways to leverage the micro-influencers who love your brand and products. For example, send samples to these everyday influencers, and in exchange, ask them to write an honest review. Or, ask them to post a photo of your product in action on their Instagram account — and then repurpose that content on your website.

Showcase your key differentiators.

Factors like price and packaging are still important. But today, a growing number of beauty shoppers also want to purchase products that align with their values. Specifically, we found that many shoppers are actively seeking out products that are sustainably made and created by Black-owned businesses.

If there’s something unique about your brand or products, be sure to showcase it. Or if you’re a beauty retailer, make it easy for shoppers to find products that align to the things that matter most to them. For example, Ulta features sections on their website that make it easy for shoppers to find products from Black-owned brands — and those that are eco-friendly.

6