The Sweet Spot for conversion is 4.75-4.99 stars

Key Findings:

  • 4.75 – 4.99 stars is the optimal product rating for conversion. Products in this band have – on average – the highest conversion rates.

  • The biggest leap in conversion – in percentage terms – between bands is from 3 – 3.49 stars to 3.5 – 3.99 stars (20%), closely followed by 3.5 – 3.99 to 4.0 – 4.24 stars (19%).

  • A 4 star average rating is where the conversion rate rises above 4%, with overall highest conversion rates in the 4.25 – 4.99 range.

  • Products with average ratings of 5 stars have comparable conversion rates to products with 3.0 – 3.49 stars.
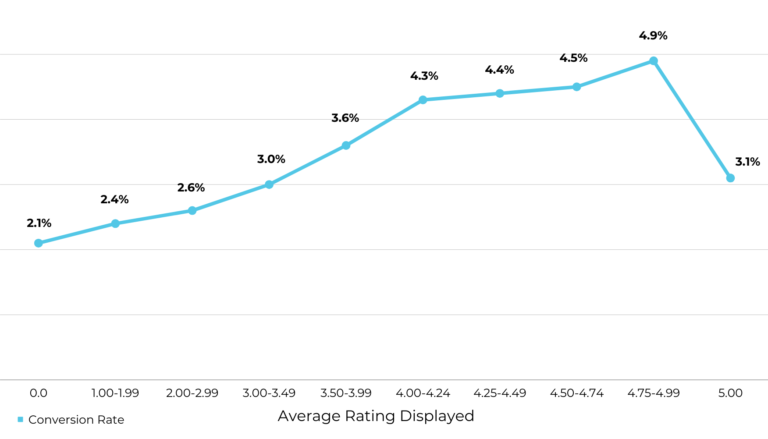
Methodology: Analysis of lifetime Ratings and Reviews submitted across 20MM+ online product pages on 1,000+ brand and retailer ecommerce sites (Qualifier: page must have had activity in the full calendar year prior to March 7, 2022). Conversion is defined here as orders (i.e. purchases) as a percentage of page visits. Average rating recorded is the average rating at time of data extraction on March 7, 2022.

The takeaway here for ecommerce practitioners wondering what targets they should set themselves: anything above 4 stars is good, 4.25 stars better, 4.5 stars better still and 4.75 stars the “North Star” goal.

All the while, you need to underpin any targets you do set yourself with the context of the specifics of your own business (e.g. vertical you operate in and competitors you’re up against, pricepoint of your product, etc). Ultimately, consumer expectations – which are a big part of how shoppers approach submitting ratings and reviews – are dictated by a number of factors that are likely unique to your business.

These results make one thing completely clear: consumers pay attention to the average rating. That might sound obvious in and of itself but remember star ratings are rounded to the nearest half star – in other words, both a 4.75 average rating and a 5.0 average rating will appear as a 5 star on a product page. There is a significant difference between the conversion rates in both of these bands. This means that shoppers clearly look beyond the star visual when deciding whether to purchase a product.

One finding – again – is clear and unmistakable. Consumers don’t trust 5-star average ratings. This supports much of our research: we have found a sizable proportion of consumers are suspicious of perfect 5-star ratings, including 46% of shoppers overall and 53% of Gen Z shoppers

Five Snackable Data-Backed Average Rating Tips

  1. Continually collect ratings and reviews: A Ratings and Reviews program needs constant work (consumers value review recency more than total volume nowadays). A continual focus on collection – in the right way – will also increase your average rating or, if you’re in a good spot already, maintain an existing high rating. We have loads of tips on collecting more review content in our Complete Guide.

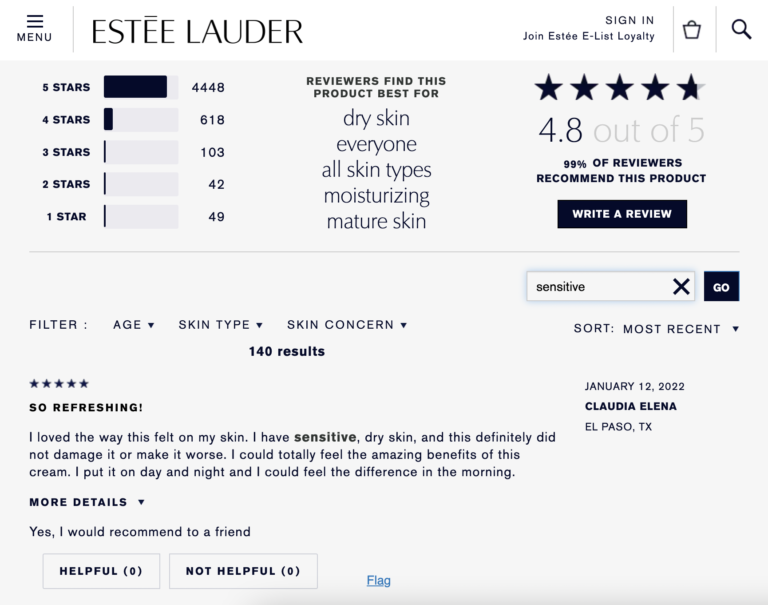
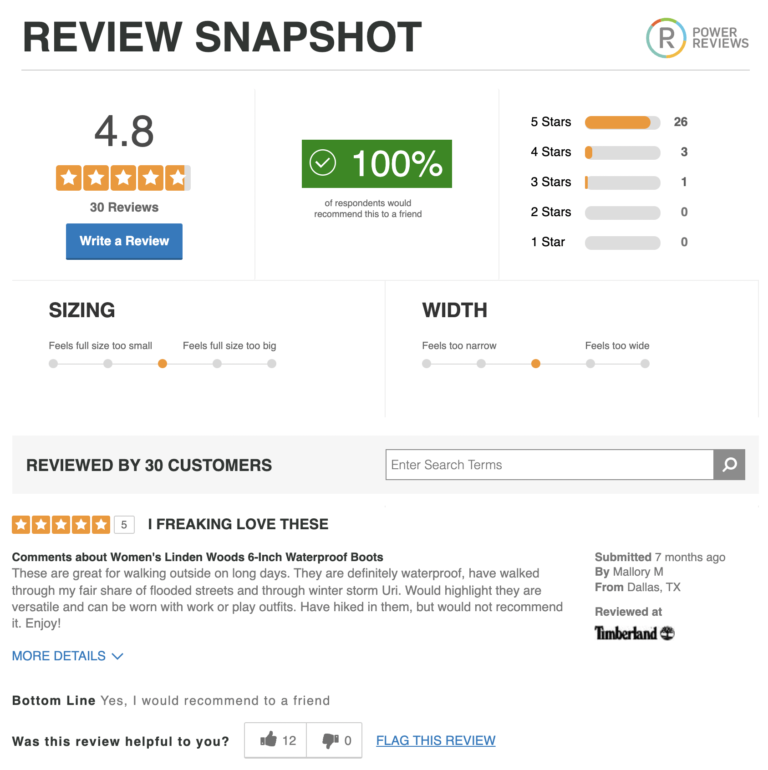
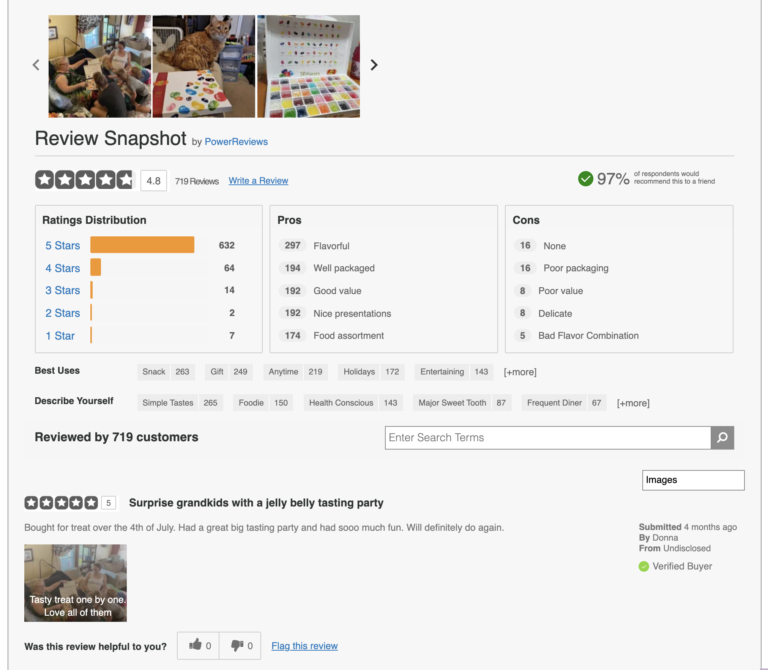
  2. Prominently display the average rating AND rating breakdown on product detail pages: Consumers look beyond the star rating visual (99% say they do so at least sometimes), which indicates they are thirsty for deeper information. So make sure you give them it. Highlighting the average rating is a good start but also enables them to see how many shoppers rated the product 5, 4, 3, 2, or 1 stars. This allows shoppers to filter for reviews of a certain star rating (shoppers who click on these filters convert at 111.8% the rate of those who visit the same page and do not).

  3. Embrace negative reviews: The general population has become increasingly suspicious of what they see online in recent years. This has been clear in how shoppers approach Ratings and Reviews, where so-called “fake reviews” have been a big concern. While not manufacturing or faking review content is an obvious first step to fostering authenticity, also embrace negative reviews. 62.4% of shoppers actively seek out one-star reviews by clicking on these star breakdowns — and they still convert at a rate that’s 108.8% higher than those who don’t interact with review content.

  4. Analyze quantitatively and qualitatively: Your review content contains a goldmine of likely untapped product experience feedback. For products you want to improve average ratings, identify some common themes why, and then dig into individual review comments for the specific context. This will provide clear and actionable guidance on how to make improvements.

  5. Build good products and manage consumer expectations: Maybe obvious, but weak products generate poor reviews. Something else that creates poor reviews: unrealistic expectations around how the product will perform. Performance in both these areas will be evident if you analyze your review content (as per recommendation 4). Make sure the messaging on your product pages and throughout your site is accurate and isn’t going to set you up for failure. When asked what motivates them to write a review, 91% of consumers responded with “a positive experience,” while 76% said “a negative experience.”

More Benchmarks

Sorry, we couldn't find any posts. Please try a different search.

Brands and retailers live and die on the performance and reputation of their product. This is why it’s critical for them to understand how they stack up against their competition.

The PowerReviews Brand Health Index: Coffee & Cereal Edition ranks brands based on insights gleaned from more than 900k individual product reviews pulled from 12K product pages covering 305 brands on three major retailers and marketplaces (Amazon.com, Walmart.com and Target.com)

Check out the ungated report to find out:

(No form fill required!)

New survey of 11,000+ consumers highlights the pervasive shift to digital two years following the onset of the pandemic. Ratings and reviews offer grocers exceptional customer engagement opportunities in this new digital-first era.

MARCH 31, 2022—CHICAGO—Two years into the pandemic, US grocery consumers continue to shift their buying habits online and the way grocers market their products is shifting too. The grocery sector, once a laggard in digital experience, is surging ahead to keep pace with consumer expectations, including the need to showcase social proof via product reviews – on grocery websites and mobile apps.

A new survey of more than 11,000 US consumers reveals over seventy percent of consumers (71%) have made an online grocery or consumer packaged goods (CPG) purchase within the most recent three-month period (compared to 73% a year ago and 17% in 2017), and 72% say they shop online for groceries more now than they did pre-pandemic.

Over half (57%) say the proportion of their grocery spending that occurs online has increased in the last 12 months, with time-savings and the desire to avoid impulse purchases being the two primary motivating factors.

These insights are from a new survey from PowerReviews, a leading provider of ratings and reviews technology solutions. The PowerReviews Meeting Grocery and CPG Shopper Digital Expectations in the Post Pandemic Era study draws on survey responses from 11,162 grocery shoppers across the country, surveyed in February 2022.

The largest portion (28%) of consumers shop for groceries online monthly, and 25% do so once
per week. The top spending categories for online purchases in 2022 are:

  • Non-perishable packaged foods, such as cereal, canned soups, and snack foods: 70%
  • Personal care items, such as soap, shampoo, body wash: 70%
  • Home care items, such as detergent and cleaners: 66%
  • Soft drinks, such as juice, soda and bottled water: 61%
  • Fresh food, such as meat, produce and dairy: 56%
  • Frozen foods: 54%
  • Baby care items, such as baby food and diapers: 20%
  • Alcoholic beverages, such as beer, wine and spirits: 20%

While consumers continue to embrace online grocery shopping, nearly all online grocery shoppers (97%) have also shopped in-store for groceries or CPG items within the most recent three months.

While the popularity of online services from non-traditional grocery stores have grown over the past few years (i.e. Amazon Fresh, Drizly.com, etc.), pickup or delivery from traditional grocery or big box stores is still the predominant choice, with 68% of respondents using this option for fulfillment in the 90 days prior to being surveyed.

Strong Digital Experience Key to Engaging Today’s Online Shoppers

As the pandemic unfolded in 2020, the grocery sector witnessed tens of million of grocery app downloads; as a result, grocers today are focused on mobile-first channel-less user experiences. 89% of consumers surveyed say they use their mobile phone in grocery stores to help them shop, up slightly from 87% in 2021, and product ratings and reviews are becoming a key item on shoppers’ digital grocery checklist.

Both online and in-store grocery shoppers value reviews

  • 90% of online grocery shoppers read ratings and reviews at least occasionally – up significantly from 82% in 2021.
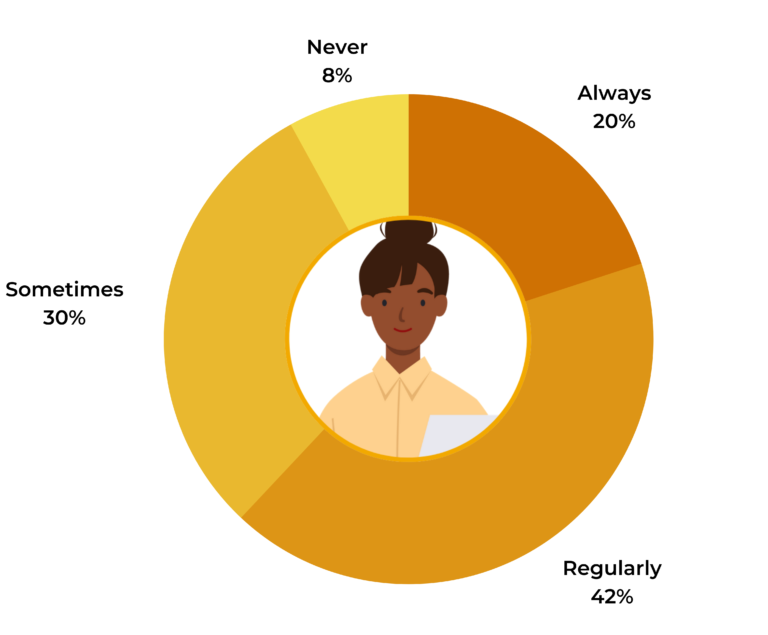
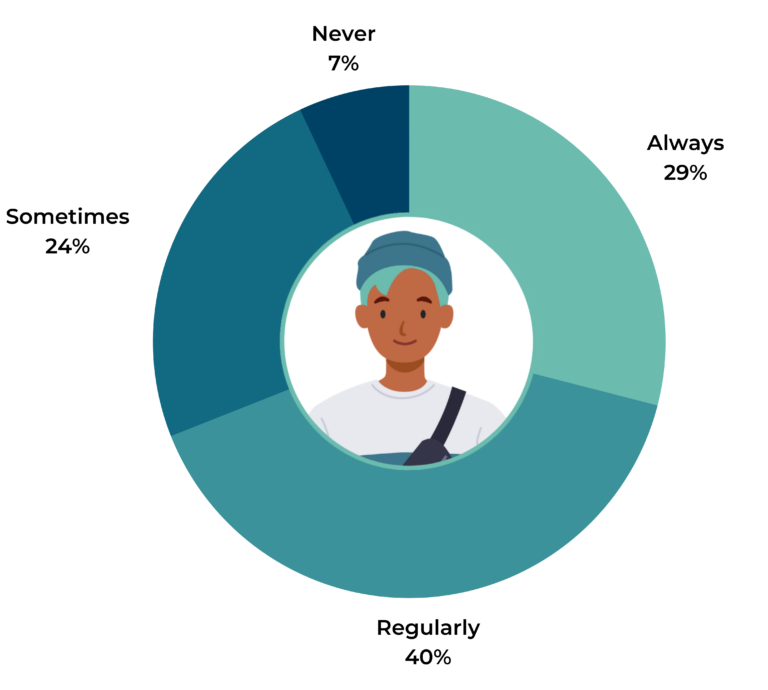
    • Younger shoppers consult reviews more frequently when shopping online for grocery and CPG items. Notably, 35% of Gen Z shoppers say they always read ratings and reviews when purchasing grocery items online, compared to 20% of Millennials, 15% of Gen X’ers and 13% of Boomers.
  • 81% of in-store grocery shoppers are at least somewhat interested in being able to access this content and 29% will call or text a friend or family member for opinions on products.
  • 50% of shoppers are more likely to click through to the product page if ratings and reviews are highlighted when browsing for a specific product before navigating to the actual product page.

Ratings and reviews increase shoppers’ likelihood to try a new brand or product

  • 92% of shoppers are open to purchasing products they’ve never tried before, up from 83% last year.
  • 83% say they’re more likely to purchase a product they’ve never tried before if there are reviews from other customers.
  • When shopping in a brick-and-mortar store, 58% of consumers are more likely to purchase an unfamiliar grocery or CPG item if they’re able to read reviews first.

Andrew Smith – VP, Marketing at PowerReviews, says:
“In the post-Covid era, grocery shoppers continue to buy online at high levels. However, a higher percentage of shoppers have also returned to or continued to shop at brick-and-mortar grocery and consumer packaged goods retailers. A hybrid strategy is needed to attract these consumers, because, while it makes sense to invest in digital, grocers can ill-afford to do so at the expense of their brick-and-mortar operations.

“Instead, make it a priority to deliver winning, seamless experiences across all channels. To win, grocers must follow the example set by other more digitally evolved industries. Consumers’ expectations are rising and the time to meet them is now.

“Product reviews are tremendously influential. Make consistently collecting reviews across all your grocery and consumer packaged goods a goal. Then be sure to prominently display this content where both online and in-store shoppers can find it – from in your app and on your website but also incorporated into in-store signage, packaging, and other marketing initiatives.

“While generating reviews across your entire catalog, be sure to focus on those new or recently released brands and products – where they have a particularly big impact. Over the past two years, grocers have been faced with stockouts, often having to source new brands, many of which have less consumer brand recognition. Focusing on reviews for these products can improve sell-through and consumer consideration and adoption of these new brands.”

Research Methodology

The Meeting Grocery and CPG Shopper Digital Expectations in the Post Pandemic Era consumer survey draws on responses from 11,162 active grocery shoppers across the United States who have opted in to offers and discounts from retailers. The survey took place in February 2022. Throughout the survey, we defined Boomers as born in the years 1946 to 1964 (aged 57-75 on Dec 31, 2021), Gen X as born in the years 1965 to 1980 (aged 41-56 on Dec 31, 2021), Millennials as born between 1981-1996 (aged 24-39 on Dec 31, 2021) and Gen Zers born in or after 1997 (ages 32 and younger on Dec 31, 2021).

ABOUT POWERREVIEWS
PowerReviews (PowerReviews.com) The Ratings and Reviews Specialist Doing More with UGC to Grow Your Business. We enable you to collect and share more and better user-generated content, display it for maximum conversion impact and analyze it to benchmark and improve product experiences. PowerReviews is headquartered in Chicago, IL, USA.

Media Contact
Erin Lutz
Lutz Public Relations (for PowerReviews)
erin@lutzpr.com
949-293-1055

The lasting impact of Covid on grocery shopping habits, according to a survey of 11,000+ consumers

Survey at a Glance:

The PowerReviews Meeting Grocery and CPG Shopper Digital Expectations in the Post Pandemic Era study is based on survey responses from 11,162 grocery shoppers across the United States in March 2022 (and is an update of our 2021 study, The Evolution of the Modern Grocery Shopper). Here’s a snapshot of our key findings.

Two Years into the Pandemic, Consumers Continue to Embrace Online Grocery Shopping
  • 71% of consumers have made an online grocery or CPG purchase within the most recent three month period (compared to 73% a year ago and 17% in 2017).
  • 72% say they shop online for groceries more now than they did pre-Covid.
  • For 57% of consumers, online grocery spending has increased in the past 12 months.  
  • Top reasons for online grocery shopping include time savings (66%), avoiding impulse purchases that are common in-store (37%) and personal safety (34%).
  • Pickup or delivery from a traditional grocery or big box store remains the most popular online grocery shopping option; 68% of consumers have done this.
Grocery and CPG Shoppers Still Frequent Brick-and-Mortar Stores
  • 95% of consumers have purchased grocery or CPG items from a brick-and-mortar store within the most recent three month period. 
  • Nearly all online grocery shoppers (97%) have also shopped in-store for groceries or CPG items within the most recent three months. 
Both Online and In-Store Grocery Shoppers Have an Appetite for Ratings and Reviews
  • 90% of online grocery shoppers read ratings and reviews at least occasionally. This is up from 82% last year. 
  • Top categories for which online grocery shoppers want to access reviews include personal care items (79%), home care items (72%), non-perishable packaged foods (49%), frozen foods (41%) and soft drinks (37%), among others. 
  • 81% of consumers are at least somewhat interested in accessing ratings and reviews while in a brick-and-mortar grocery store.
Ratings and Reviews Increase Shoppers’ Likelihood to Try a New Brand or Product
  • 92% of shoppers are open to purchasing products they’ve never tried before, up from 83% last year.
  • 83% of those purchasing grocery and CPG products online say they’re more likely to purchase a product they’ve never tried before if there are reviews from other customers.
  • When shopping in a brick-and-mortar store, 58% of consumers are more likely to purchase an unfamiliar grocery or CPG item if they’re able to read reviews first.
Chapter 1

Introduction

The Pandemic Has Had a Lasting Impact on The Way We Shop for Groceries

When the pandemic first hit and stay-at-home orders were put in place, the shopping habits of many consumers quickly shifted. Namely, they cut back on trips to brick-and-mortar stores and instead flocked online to purchase what they needed – including groceries. 

As a result, online grocery, a category that has historically trailed behind other ecommerce categories, experienced explosive growth. According to eMarketer, in 2020, grocery ecommerce grew 54% year-over-year. And our own research early last year found that 73% of consumers had made a grocery or CPG purchase online, up from 17% in 2017.

In 2020, grocery ecommerce grew 54% year-over-year.

Today, we’re more than two years into the pandemic. Though Covid isn’t over, vaccines are now widely available. And many consumers have settled into their “new normal.” 

But have grocery shopping behaviors regressed back to pre-pandemic times? Or have some of those new habits stuck? 

Recently, we surveyed 11,162 U.S. consumers to understand where they’re shopping for groceries, how they’re navigating the purchase journey across channels, and what information they’re using to make informed purchase journeys. 

In this report, we’ll explore the key findings from this survey. We’ll also discuss how grocery and CPG shopping behaviors and expectations vary based on demographics, as well as how habits have evolved in the past year since we last fielded a similar survey. 

Consumers have many options when it comes to purchasing grocery and CPG items. Understanding the habits and expectations of these shoppers can empower you to refine your strategy to attract and convert more of them – wherever they opt to spend their grocery and CPG budgets.

Chapter 2

Who We Surveyed

This report is based on a survey conducted in March 2022 of 11,162 US consumers. Here’s a closer look at who we surveyed.

Generations

Gen Z
(1997-present)
1%
Millennials
(1981-1996)
50%
Gen X
(1965-1980)
36%
Baby Boomers
(1946-1964)
13%

US Census Region

Midwest
25%
Northeast
19%
South
39%
West
17%

Type of Geographical Location

A large city with a population of 500,000+
18%
Suburban area within 30 miles of a major city
37%
A city with a population between 50,000 - 500,000
19%
A city/town with a population below 50,000
26%

Income

$0-$25,000
11%
$26,000-$50,000
20%
$51,000-$75,000
19%
$76,00-$100,000
15%
$100,000+
30%
Prefer not to say
5%

Overall (Grocery and Non-Grocery) Monthly Online Spend for Household

$0
4%
$1-$250
34%
$251-$500
32%
$501-$1,000
22%
$1,001-$2,000
6%
$2,000+
2%
Chapter 3

Where Consumers Shop for Groceries & CPG Items (and How Often They Do So)

These days, consumers have nearly endless options when they’re shopping for just about any product category – including groceries and CPG.

Are the majority of consumers browsing and buying grocery and CPG products online? Or are they navigating the aisles of physical store locations to get what they need?

The answer lies somewhere in the middle. 

Online Grocery Growth Has Leveled Off

In the past, consumers remained reluctant to shop for groceries online. But when the pandemic initially hit, more consumers than ever before gave online grocery shopping a try. In 2021, 73% of the consumers we surveyed said they’d made an online grocery purchase in the past three months – compared with 17% who said this was the case in 2017.

Today, many consumers continue to shop online for groceries. In fact, 71% of consumers have made an online grocery purchase in the past three months. While this is down slightly from last year, it’s proof positive that online grocery shopping isn’t going away.

Many Consumers Continue to Purchase Groceries Online
Have you made an online grocery purchase in the past 3 months? (i.e. from Instacart or similar, Amazon Fresh or similar, Walmart.com, Target.com, your local grocery store(s) etc.)
2017
17%
2021
73%
2022
71%

Prevalence of Online Grocery Shopping Varies Based on Many Factors

The popularity of shopping for groceries online depends on many factors. Our survey shed light on three: age, geographical location and income. 

Interestly, Boomers are the generation least likely to shop online for groceries; 53% do so. Millennials, on the other hand, are the group most likely to shop for groceries online. 77% do so. 

Many Consumers Continue to Purchase Groceries Online
Have you made an online grocery purchase in the past 3 months? (i.e. from Instacart or similar, Amazon Fresh or similar, Walmart.com, Target.com, your local grocery store(s) etc.)
Gen Z
69%
Millennials
77%
Gen X
70%
Boomers
53%

In terms of geography, large city dwellers are the group most likely to purchase groceries online, with 77% doing so. In comparison, 65% of those in small cities and towns with a population below 50,000 shop online for groceries. This makes sense, as there are typically more options for consumers living in larger cities. 

Online Grocery Shopping by Geography
Have you made an online grocery purchase in the past 3 months? (i.e. from Instacart or similar, Amazon Fresh or similar, Walmart.com, Target.com, your local grocery store(s) etc.)
A large city with a population of 500,000+
77%
A suburban area within 30 miles of a major city
71%
A city with a population between 50,000 - 500,000
74%
A city/town with a population below 50,000
65%

In addition, higher income is correlated with an increased likelihood of online grocery shopping. 61% of shoppers who make $25,000 or less shop online for groceries, compared to 76% of those making $100,000 or more. A possible explanation is that online grocery shopping can come with additional costs, such as item markups and delivery charges. And those with tight budgets can’t afford those additional expenses. Or they perhaps believe they may be more able to shop cost efficiently in person.

Online Grocery Shopping By Household Income
Have you made an online grocery purchase in the past 3 months? (i.e. from Instacart or similar, Amazon Fresh or similar, Walmart.com, Target.com, your local grocery store(s) etc.)
$0-$25,000
61%
$26,000-$50,000
69%
$51,000-$75,000
72%
$76,000-$100,000
73%
$100,000+
76%
Prefer not to say
64%

Covid Has Had Long-Term Impact on Where Consumers Shop

It’s no secret that Covid has had an impact on where many consumers opt to shop for groceries. This year, 62% of consumers indicate they shop online for groceries more now than they did pre-Covid. Last year, 61% of consumers said this was the case.

Covid Has Had a Lasting Impact on Where Consumers Shop for Groceries
Which of the following best describes how Covid has impacted your online grocery shopping?
"I shop online for groceries more now than I did before Covid."
2021
61%
2022
62%
"I shop online for groceries less now than I did before Covid."
2021
2%
2022
3%
"Covid hasn't impacted my online grocery shopping habits."
2021
37%
2022
35%

Why Consumers Shop Online for Groceries

Many consumers shop online for groceries. What are their motivations for doing so? The top reason is that it saves time; 66% indicate this is a reason they choose to purchase groceries online. 

Of note and possibly unsurprising, personal safety seems to be less of a concern now. 

Top Reasons Consumers Purchase Groceries Online: 2021 vs 2022
Why do you choose to purchase grocery items online?
It saves time
2021
59%
2022
66%
It helps me avoid impulse purchases that often happen in-store
2021
31%
2022
37%
Personal safety (i.e. reduce risk of Covid exposure)
2021
49%
2022
34%
It’s easier to compare products and prices online
2021
24%
2022
29%
I can easily access information about products, including product reviews
2021
22%
2022
27%
It’s difficult to get to a grocery store
2021
20%
2022
23%

Consumers Still Frequent Brick-and-Mortar Establishments

A large portion of consumers purchase grocery and CPG products online. Does this mean grocery stores have become ghost towns? 

Hardly.

Nearly all (95%) of consumers have purchased a grocery or CPG product in a brick-and-mortar store within the last three months. This is up slightly from 2021, when 93% shopped in-store for groceries.

Brick-and-Mortar Grocery Continues to Thrive
Have you or anyone in your household made an in-store grocery purchase in the last three months?
2021
93%
2022
95%

When it comes to grocery shopping, it’s not a case of online versus in-store shopping. That’s because most consumers are doing both. In fact, 97% of those who shop online for groceries also shopped in-store during the same time period.

97% of those who have shopped for groceries online during the last 90 days have also shopped in-store during the same time period.

Grocery and CPG brands and retailers must be equipped to reach consumers – and meet their expectations – regardless of whether they shop online, in-store, or, most commonly, some combination of the two.

How Often Consumers Shop For Groceries Across all Channels

We have a clear idea of where consumers are shopping for groceries. But how often are they doing so? The most common frequency is a few times per week.

Consumers Grocery Shop Frequently
Approximately, how often do you or your household shop for groceries (either in-store or online)?
Daily
4%
A few times per week
45%
Once per week
42%
Monthly
7%
Once every 3 months +
2%
Chapter 4

How Consumers Browse and Buy Groceries and CPG Products Online

The vast majority of consumers are purchasing at least a portion of their groceries and CPG items online. Let’s take a closer look at how frequently these consumers shop online, how they’re navigating the purchase journey, and where they’re most frequently shopping. 

A Growing Portion of the Grocery Budget is Spent Online

We know the vast majority of consumers are doing a combination of online and in-store grocery shopping. But for many, a growing portion of the grocery budget is spent online. 

Over half (57%) say the proportion of their grocery spend that occurs online has increased in the last 12 months. A third (32%) indicate their online grocery spending has stayed the same, and only 11% claim it’s decreased. 

Over Half of Consumers Have Ramped Up Online Grocery Shopping
In the last 12 months, would you say the proportion of your grocery spend that occurs ONLINE has:
Increased
57%
Decreased
11%
Stayed the same
32%

Precisely how much are shoppers spending online on grocery and CPG items each month? 

The largest portion of shoppers – 49% – spend $250 or less online each month on groceries and CPG items. And 22% spend between $251 and $500.

Most Shoppers Spend $500 or Less Online Each Month on Groceries
Approximately how much do you personally spend online on GROCERY (i.e. items listed above) per month on average?
$0
17%
$1 - 250
49%
$251 - $500
22%
$501 - $1,000
10%
$1,001 - $2,000
2%

Consumers Shop for Groceries Online Less Frequently Than Average

We know the largest portion of shoppers (45%) shop for groceries across all channels (both online and in-store) a few times per week, and 42% do so once per week. Are consumers shopping online at the same frequency? 

In general, consumers are shopping online less frequently. The largest portion (28%) of consumers shop for groceries online monthly, and 25% do so once per week. 

However, 57% say they’re spending more online than they did 12 months ago. A likely explanation is that they’re placing larger, less frequent orders – perhaps loading up on shelf-stable goods, such as pantry items and CPG products.

Frequency of Online Grocery Shopping
Approximately, how often do you or anyone in your household shop for groceries ONLINE?
Daily
1%
A few times per week
14%
Once per week
25%
Monthly
28%
Every 3 months
11%
Every year
3%
Less often than every year
18%

Pickup or Delivery from a Traditional Grocery or Big Box Store Remains the Most Popular Option

We know how frequently consumers are shopping online for groceries – and how much they’re spending. But where exactly are they going to spend their online grocery shopping dollars? 

Pickup or delivery from a traditional grocery or big box store is the most popular option, as was the case last year. 68% of shoppers have taken advantage of this service, compared to 65% in 2021.

Most Popular Online Grocery Services
Which of the following have you used or ordered over the past three months?
Pickup or delivery from traditional grocery or big box store:
2017
38%
2021
65%
2022
68%
An exclusively online service not affiliated with a traditional grocery store (e.g. Amazon Fresh, Drizly.com or similar):
2017
39%
2021
22%
2022
26%
Third party service that pairs you with a personal shopper who then buys your groceries from grocery store and then delivers to your home (e.g. Instacart):
2017
17%
2021
20%
2022
22%
Meal boxes (i.e. Blue Apron, Home Chef, Hello Fresh or similar):
2017
34%
2021
15%
2022
18%

Shoppers Add Many Types of Grocery Items to Their Online Shopping Baskets

Last year when we asked grocery shoppers what types of products they typically purchase online, non-perishable foods topped the list. This year, this category remains at the top of the list; it’s tied with personal care CPG items, such as soap, shampoo, and body wash. 

However, it seems no grocery categories are off bets from online shoppers – including beverages, fresh food, and frozen items. 

Consumers Purchase Myriad Grocery Products Online
What types of products do you typically purchase when using online grocery services?
Non-perishable packaged foods, such as cereal, canned soups, and snack foods:
2017
58%
2021
70%
2022
70%
Personal care items, such as soap, shampoo, body wash:
2017
49%
2021
64%
2022
70%
Home care items, such as detergent and cleaners:
2017
45%
2021
61%
2022
66%
Soft drinks, such as juice, soda and bottled water:
2017
33%
2021
58%
2022
61%
Fresh food, such as meat, produce and dairy:
2017
47%
2021
56%
2022
56%
Frozen foods:
2017
32%
2021
54%
2022
54%
Baby care items, such as baby food and diapers:
* Not an option in 2017 & 2021
2022
20%
Alcoholic beverages, such as beer, wine and spirits:
2017
12%
2021
17%
2022
20%

Many are Willing to Try New Brands and Products

As mentioned earlier, one of the top reasons consumers shop for groceries online is that it helps them avoid impulse purchases that often happen in-store. So, are most online shoppers sticking to their tried and true products? Or are they open to trying new options – sight unseen?

The vast majority – 92% – indicate they’re open to buying products they’ve never tried before, up from 83% last year.

Increasingly, Online Grocery Shoppers are Open to New Products
When shopping for groceries online, are you open to buying products you’ve never tried before?
2021
83%
2022
92%

Consistent with last year’s results, Boomers are the group least likely to be open to buying new products, while Gen Z shoppers are the most likely.

Younger Shoppers are More Open to New Products
When shopping for groceries online, are you open to buying products you’ve never tried before?
Gen Z
94%
Millennials
93%
Gen X
91%
Boomers
84%

In addition, consumers with higher incomes are more willing to try new products than their lower-earning counterparts. This makes sense, as they likely have more disposable income – and thus the risk is lower if they don’t like a product. 

Higher Income Correlates with Openness to Try New Products
When shopping for groceries online, are you open to buying products you’ve never tried before?
$0-$25,000
88%
$26,000-$50,000
91%
$51,000-$75,000
92%
$76,00-$100,000
93%
$100,000+
93%

Also of note, 25% of shoppers say they’re more open to buying a new grocery or CPG product they’ve never tried before when shopping online than they would be when shopping in-store. This is up slightly from 21% last year. Over half (55%) say they’re as open to buying a new (to them) grocery or CPG product when shopping online as they are when shopping in-store. 

Those shopping for groceries online don’t need to see a new (to them) product in person to be willing to try it. Later on in this report, we’ll explore what gives these shoppers the confidence to buy unknown grocery products, sight unseen.

Consumers Don’t Need to See a New Product in Person to be Open to Buying It
When shopping for groceries online, are you more or less open to buying products you’ve never tried before than when you shop for groceries in-store?
2021
More
21%
Less
21%
The Same
58%
2022
More
25%
Less
20%
The Same
55%
Chapter 5

The Impact of Reviews on Online Grocery and CPG Shopping

A large (and growing) portion of consumers turn to reviews to make informed purchase decisions. But do consumers read reviews when shopping for grocery and CPG products? And does the presence of this content have any impact on purchase likelihood?

Online Grocery Shoppers Frequently Consult Ratings and Reviews

The vast majority of online grocery shoppers – 90% – read ratings and reviews at least occasionally, up significantly from 82% last year.

Clearly, reviews are becoming increasingly important for grocery and CPG shoppers.

Consumers Don’t Need to See a New Product in Person to be Open to Buying It
When shopping for groceries online, are you more or less open to buying products you’ve never tried before than when you shop for groceries in-store?
2021
Always
17%
Regularly
25%
Sometimes
26%
Occasionally
14%
Never
18%
2022
Always
18%
Regularly
28%
Sometimes
25%
Occasionally
19%
Never
10%

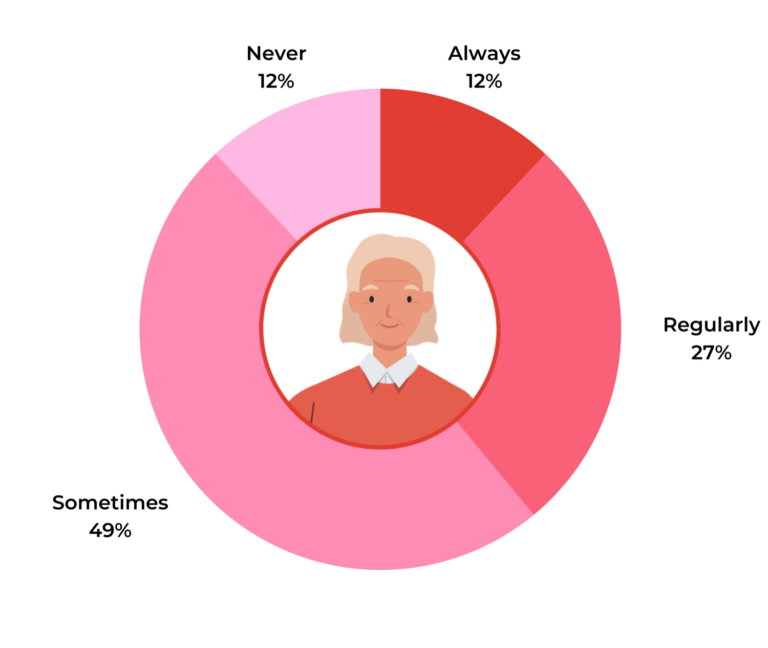
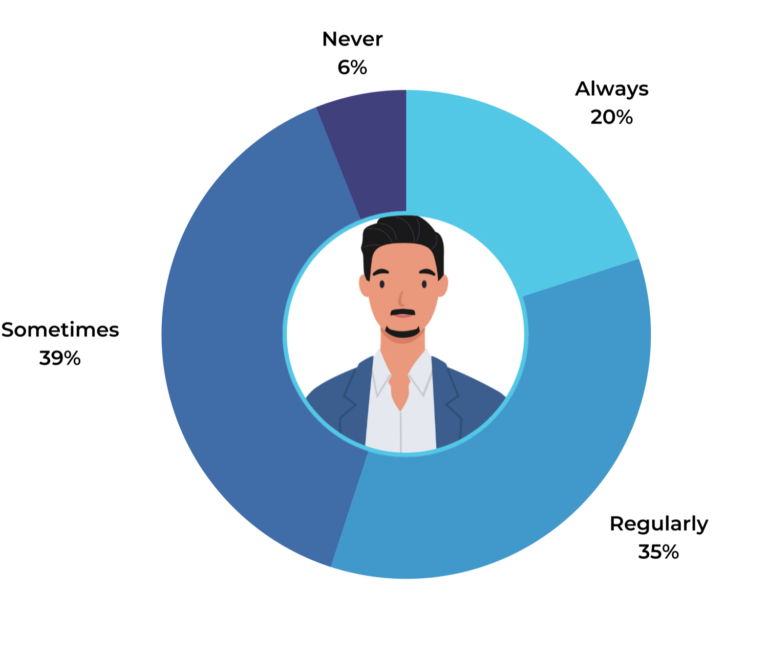
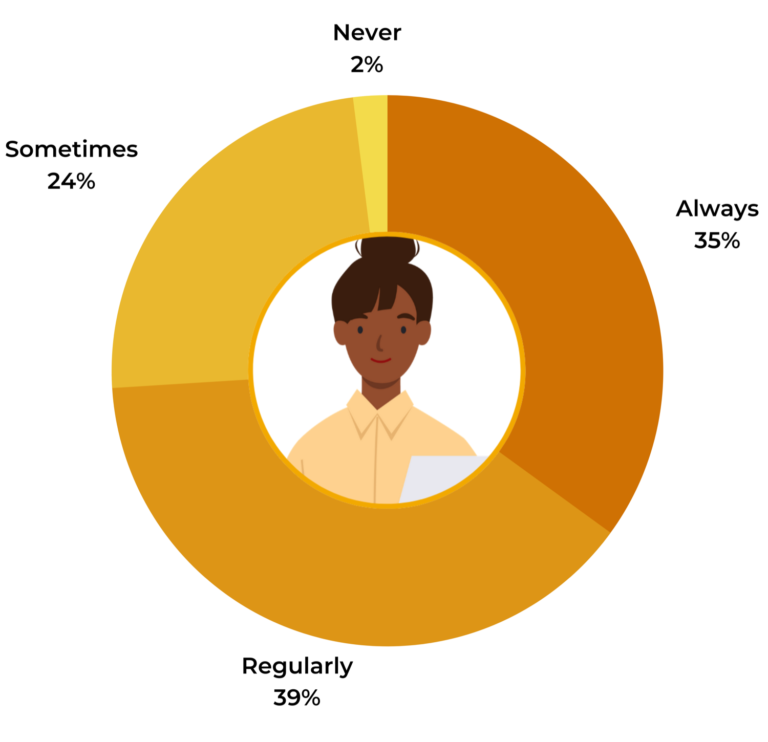
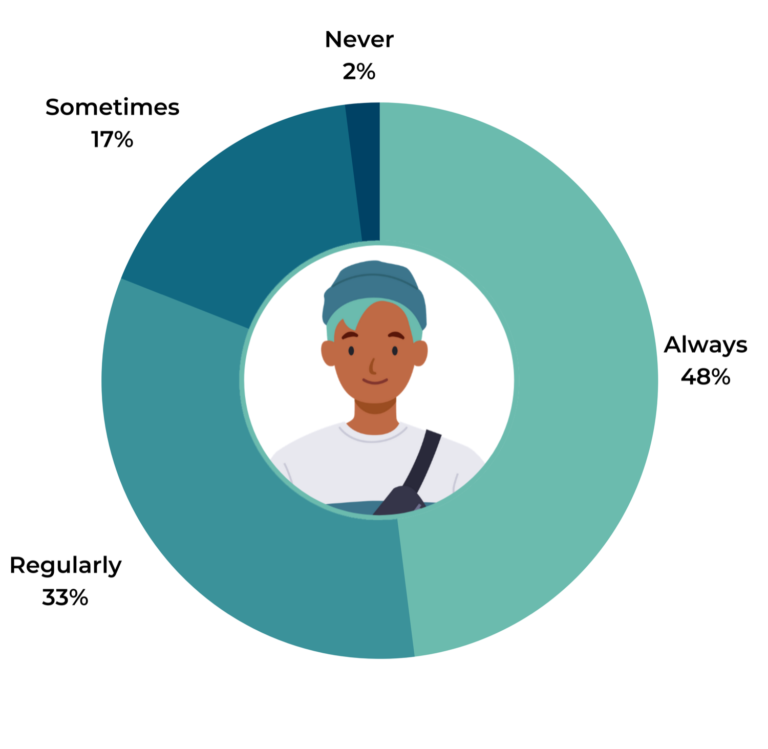
As expected, younger shoppers consult reviews more frequently when shopping online for grocery and CPG items. Notably, 35% of Gen Z shoppers say they always read ratings and reviews when purchasing grocery items online, compared to 15% of Gen X’ers and 13% of Boomers. In addition, a mere 5% of Gen Z’ers indicate they never read reviews when shopping online for groceries and CPG items, compared to 13% of Boomers. 

Consumers Don’t Need to See a New Product in Person to be Open to Buying It
When shopping for groceries online, are you more or less open to buying products you’ve never tried before than when you shop for groceries in-store?
Gen Z
Always
35%
Regularly
27%
Sometimes
23%
Occasionally
10%
Never
5%
Millennials
Always
20%
Regularly
28%
Sometimes
25%
Occasionally
17%
Never
10%
Gen X
Always
15%
Regularly
27%
Sometimes
27%
Occasionally
20%
Never
11%
Boomers
Always
13%
Regularly
27%
Sometimes
25%
Occasionally
22%
Never
13%

Also of note, those with higher overall monthly online spending consult reviews more frequently than those who spend less online each month. 21% of those who spend $2,001+ and 25% of those who spend $1,000-$2,000 always consult reviews. In comparison, 15% of those who spend $1-$250 always consult reviews when shopping for groceries online.

Consumers Don’t Need to See a New Product in Person to be Open to Buying It
When shopping for groceries online, are you more or less open to buying products you’ve never tried before than when you shop for groceries in-store?
$0 Average Monthly Overall Spend
Always
19%
Regularly
15%
Sometimes
17%
Occasionally
15%
Never
34%
$1-$250 Average Monthly Overall Spend
Always
15%
Regularly
26%
Sometimes
27%
Occasionally
21%
Never
11%
$251-$500 Average Monthly Overall Spend
Always
20%
Regularly
28%
Sometimes
25%
Occasionally
18%
Never
9%
$501-$1,000 Average Monthly Overall Spend
Always
16%
Regularly
30%
Sometimes
26%
Occasionally
18%
Never
10%
$1,001-$2,000 Average Monthly Overall Spend
Always
25%
Regularly
27%
Sometimes
21%
Occasionally
16%
Never
11%
$2,001+ Average Monthly Overall Spend
Always
21%
Regularly
31%
Sometimes
25%
Occasionally
15%
Never
8%

Many Online Grocery Services Fail to Meet Shopper Expectations

While 90% of consumers read reviews when shopping online for groceries, less than half (47%) can confidently say there are reviews available for the online grocery service they primarily use. 

If you aren’t providing reviews, shoppers must look elsewhere for this content. And when they do, they’re likely to get distracted – and spend their grocery and CPG dollars elsewhere.  

Many Online Grocery Options Services Aren’t Providing Shoppers with Reviews
Are there product reviews available for the online grocery service you primarily use?
Yes
47%
No
10%
Unsure
43%

Online Grocery Shoppers Value Various UGC Elements

Many online grocery shoppers consult ratings and reviews and other types of user-generated content (UGC). What elements of UGC content do shoppers value most?

The greatest portion of shoppers (66%) pay attention to average star rating, followed closely by customer opinions on specific extra details relevant to the product (64%) – for example, freshness of product or packaging of dry food.

Over half (55%) of shoppers pay attention to the quantity of reviews, and 49% take note of customer questions and answers on the page. A significant portion of online shoppers pay attention to customer-submitted imagery (38%) and customer-submitted videos (17%).

Be sure you’re generating a steady stream of UGC for your grocery products, including reviews, Q&A, photos, and videos. Consumers pay attention to it – and its presence can positively impact purchase behavior. 

UGC Elements Most Valued by Online Grocery Shoppers
When considering whether to buy a grocery item, which of the following do you pay attention to?
2021
Average star rating
65%
Customer opinion on specific extra details relevant to the product (freshness for fruit and vegetables, packaging for dry food, etc)
67%
Volume of reviews (the more reviews, the more credible it seems)
53%
Customer-answered questions and answers on the page
50%
Customer-submitted imagery
36%
Customer-submitted videos
16%
2022
Average star rating
66%
Customer opinion on specific extra details relevant to the product (freshness for fruit and vegetables, packaging for dry food, etc)
64%
Volume of reviews (the more reviews, the more credible it seems)
55%
Customer-answered questions and answers on the page
49%
Customer-submitted imagery
38%
Customer-submitted videos
17%

Reviews Attract Customers – and Increase Click Through

When browsing for grocery and CPG products online, consumers don’t typically navigate directly to a product page. Instead, they start their search on a search engine or navigate to a grocery service or retailer’s homepage.

Reviews influence where they go from there. Half of online grocery shoppers say they’re more likely to click through to a product page from a search engine or a grocery service’s home page if there are ratings and reviews highlighted in those locations, up slightly from 47% last year.

Reviews Motivate Online Shoppers to Learn More About Grocery and CPG Products
When browsing for a specific product before navigating to the actual product page (e.g. when browsing the search results, homepages or elsewhere in the site), are you more or less likely to click through to the product page if ratings and reviews are highlighted here?
2021
More
47%
Less
4%
No difference
49%
2022
More
50%
Less
4%
No difference
46%

Younger shoppers are even more likely to be enticed to click through by the presence of reviews. 68% of Gen Z’ers and 56% of Millennials are more likely to click through to a product page (from a search engine or home page) if there are reviews present.

Be sure to include reviews on your home page, category pages, search engine ads, and other digital advertisements. It’s a surefire way to increase clickthrough.

Reviews Give Online Grocery Shoppers Confidence to Try Unfamiliar Brands and Products

Nearly all grocery shoppers (92%) are willing to try grocery and CPG products they’ve never tried before when shopping online. But there’s always risk involved with purchasing a product you don’t have experience with – especially when you can’t touch and see the product. 

Reviews can help shoppers overcome that risk. 

83% of online grocery shoppers indicate they’re more likely to purchase a grocery item they’ve never purchased before if there are customer reviews for that product, up from 78% in 2021.

Reviews Increase the Likelihood an Online Shopper will Try a New Brand or Product
When shopping for groceries online, are you more likely to purchase a grocery item that you’ve never purchased before if there are customer reviews for that product?
2017
72%
2021
78%
2022
83%

The presence of reviews is even more likely to boost purchase likelihood among younger shoppers. 93% of Gen Z’ers and 85% of Millennials say they’re more likely to purchase an unknown grocery or CPG item if there are reviews available for it.

Generational Comparison: How Reviews Impact Likelihood of Trying New Grocery or CPG Products
Are you more likely to purchase a grocery item that you’ve never purchased before if there are customer reviews for that product?
Gen Z
93%
Millennials
85%
Gen X
81%
Boomers
75%

Reviews can give shoppers the confidence they need to try a new brand or product. Be sure to generate plenty of reviews across your product catalog – especially for new products and lesser known brands. 

Chapter 6

Giving Online Grocery and CPG Shoppers the Type of Reviews They Want, Where They Want Them

There was a time that consumers had no choice but to head to the grocery store to pick up food, drinks, home care, and personal care items. But today, that’s no longer the case. Instead, grocery shoppers have more options than ever before. 

In a competitive market, brands and retailers must work extra hard to meet the needs of online shoppers. One way of doing this is to provide grocery shoppers with reviews, which they so clearly are seeking out. 

But what types of grocery and CPG products do consumers want to find reviews for? And where do they want to find this content? 

Online Shoppers are Hungry for Reviews Across Categories

We know 90% of consumers read product reviews when shopping online for grocery and CPG items. But are there categories for which this content is particularly important? 

Again this year, two categories rise about the rest. 79% of consumers want to access product reviews for personal care items (think soap, shampoo and body wash) and 72% want to access this content for home care items (think detergent and cleaners).

However, a significant portion of online shoppers want to be able to find ratings and reviews for each of the types of grocery and CPG items we asked about. As such, it’s imperative to collect reviews across all grocery and CPG products.

Online Shoppers Want Reviews for Many Types of Grocery and CPG Products
What types of products do you want to access product reviews for prior to purchase?
Personal care items, such as soap, shampoo, body wash:
2017
68%
2021
76%
2022
79%
Home care items, such as detergent and cleaners:
2017
54%
2021
70%
2022
72%
Non-perishable packaged foods, such as cereal, canned soups, and snack foods:
2017
45%
2021
54%
2022
49%
Frozen foods:
2017
39%
2021
46%
2022
41%
Soft drinks, such as juice, soda and bottled water:
2017
23%
2021
40%
2022
37%
Fresh food, such as meat, produce and dairy:
2017
31%
2021
42%
2022
35%
Alcoholic beverages, such as beer, wine and spirits:
2017
21%
2021
25%
2022
25%
Baby care items, such as baby food and diapers:
* Not an option in 2017
2021
25%
2022
24%

Online Grocery Shoppers Don’t Want to Look Hard to Find Reviews

Consumers want to be able to find reviews for many different types of grocery products. And they don’t want to have to go searching for this content.

As was the case last year, the majority of shoppers (79%) want to access product reviews directly on the website or app they purchase from. Four in ten shoppers want to be able to find reviews for products they’re considering on Amazon, while 27% want to find this content via a search engine.  

Online Grocery Shoppers Want Reviews Where They Shop
Where do you want to access product reviews prior to purchase?
2021
Directly on the website or app where I purchase
80%
Amazon
40%
Search engine
27%
Third party reviewers/review sites
22%
2022
Directly on the website or app where I purchase
79%
Amazon
41%
Search engine
27%
Third party reviewers/review sites
22%
Chapter 7

How Consumers Navigate the Aisles of Brick-and-Mortar Grocery Stores

Today, most consumers spend a portion of their grocery and CPG budget online. However, they’re certainly not abandoning stores altogether. 

As we mentioned earlier, a whopping 95% of consumers have made a grocery or CPG purchase in a brick-and-mortar store within the most recent three months. 

However, there’s no doubt we’re seeing some significant shifts in how consumers shop in grocery stores – and what criteria they’re using to assess potential purchases.

Consumers Rely on Mobile Phones to Aid In-Store Grocery Shopping

These days, consumers don’t go anywhere without their phones. So it’s not surprising that 89% of consumers say they use their mobile phone in grocery stores to help them shop, up slightly from 87% in 2021.

In-Store Grocery Shoppers Use Their Mobile Phones for Many Activities

How are consumers using their mobile phones to aid in their in-store shopping? 68% use their mobile phone to find or redeem coupons, making it the most popular activity. In-store grocery shoppers also use their mobile phones to review shopping lists (47%), read product ratings and reviews (46%) and search for competitor prices (45%). 

Of note, consumers are significantly more likely to use their phone in-store to read ratings and reviews and search for competitor prices this year than they were in 2021. This reflects the growing importance of reviews, as well as increased price sensitivity, given increasing inflation. According to data from the U.S. Bureau of Labor Statistics (reported in Grocery Dive), food-at-home prices grew 8.6% during the past year, which is the fastest pace of growth since 1981.

How Consumers Use Their Mobile Phones in Grocery Stores
How have you used your mobile phone in grocery stores to help you shop?
Find or redeem coupons
2017
32%
2021
67%
2022
68%
Review shopping lists
2017
30%
2021
47%
2022
47%
Read product ratings and reviews
2017
17%
2021
42%
2022
46%
Search for competitor prices
2017
16%
2021
27%
2022
45%
Browse recipes
2017
20%
2021
35%
2022
36%
Call or text a friend or family member for opinions on products
* Not an option in 2017 & 2021
2022
29%
Chapter 8

The Impact of Reviews on In-Store Grocery Shopping Behavior

Previous research found that over half of consumers read reviews when shopping in brick-and-mortar stores. 

Our most recent research found that grocery shoppers are no exception. They want to be able to find reviews, and the presence of this content positively impacts their purchase behavior.

Most In-Store Grocery Shoppers Want Reviews for Unfamiliar Products

Consumers may not typically consult reviews when buying familiar grocery products. However, this content can help them learn more about products that are new to them.

81% of consumers are at least somewhat interested in accessing product ratings and reviews while shopping in a grocery store; 31% are very interested. 

In-Store Shoppers Want Reviews for New (to Them) Grocery Products
When considering a new grocery product, how interested are you in accessing product ratings and reviews while shopping in a grocery store?
2021
Very interested
33%
Interested
24%
Somewhat interested
26%
Not interested
17%
2022
Very interested
31%
Interested
24%
Somewhat interested
26%
Not interested
19%

Of note, Gen Z shoppers are the generation most likely to be very interested in accessing product ratings and reviews when considering a new (or new to them) product in a grocery store. 

Younger In-Store Shoppers Have a Bigger Appetite for Reviews for New Grocery Products
When considering a new grocery product, how interested are you in accessing product ratings and reviews while shopping in a grocery store?
Gen Z
Very interested
48%
Interested
25%
Somewhat interested
17%
Not interested
10%
Millennials
Very interested
35%
Interested
24%
Somewhat interested
25%
Not interested
16%
Gen X
Very interested
28%
Interested
25%
Somewhat interested
25%
Not interested
22%
Boomers
Very interested
23%
Interested
21%
Somewhat interested
31%
Not interested
25%

But make no mistake: a significant portion of consumers across all generations are interested in accessing reviews for new grocery and CPG products they’re considering while shopping in-store. Make sure they can find what they’re looking for. 

The Presence of Reviews Boosts Purchase Likelihood In-Store

There’s risk involved with straying away from tried-and-true products. But as it turns out, the presence of reviews can help in-store shoppers overcome that risk.

When shopping in a brick-and-mortar grocery store, over half (58%) of consumers are more likely to purchase a grocery item they’ve never bought before if they’re able to read customer reviews first. 

Reviews Boost In-Store Grocery Shoppers’ Confidence
While shopping in a grocery store, are you more likely to purchase a grocery item that you’ve never purchased before if you are able to read customer reviews for that product (either while or before shopping)?
Yes
58%
No
8%
Makes no difference
34%

When considering new products, younger in-store shoppers are even more likely to be swayed by reviews. 78% of Gen Z’ers and 63% of Millennials say they’re more likely to purchase a new (to them) product while shopping in a grocery store if there are reviews available for the product in question, compared to 54% of Gen X’ers and 49% of Boomers.

Younger Shoppers are Especially Swayed by Reviews for New (to Them) Products
While shopping in a grocery store, are you more likely to purchase a grocery item that you’ve never purchased before if you are able to read customer reviews for that product (either while or before shopping)?
Gen Z
Yes
78%
No
7%
Makes no difference
15%
Millennials
Yes
63%
No
7%
Makes no difference
30%
Gen X
Yes
54%
No
8%
Makes no difference
38%
Boomers
Yes
49%
No
9%
Makes no difference
42%

Where In-Store Grocery Shoppers Want to Access Ratings and Reviews

When considering a new (or new to them) product in a grocery store, the majority of consumers are interested in accessing ratings and reviews. And this content can positively impact the likelihood they’ll purchase the product in question.

But where do in-store grocery shoppers want to access this content?

As was the case last year, the largest portion of shoppers (49% both this year and last) want to be able to access ratings and reviews through the store’s mobile app.

However, many shoppers also want to be able to find ratings and reviews in the store itself – including shelf tags, product packaging, and store displays.

Where In-store Grocery Shoppers Want to Find Reviews
When receiving communications from a grocery provider or shopping in a grocery store, where do you want to see ratings and reviews?
Through the store’s app
2021
49%
2022
49%
On your mobile phone while in the store
* Not an option in 2021
2022
43%
The shelf tag (cooler door for fresh goods/shelf for dry goods by price label)
2021
35%
2022
39%
Social media (e.g. Instagram and Facebook posts etc)
2021
31%
2022
31%
On the packaging of the actual item
2021
30%
2022
30%
On store displays, like in the lobby or on ends of aisles
* Not an option in 2021
2022
26%
Within emails you receive from the store
2021
26%
2022
23%
Within mailed ads and other promotional materials you receive like a weekly sales flier
2021
25%
2022
23%
Large display boards as you shop around the store
2021
16%
2022
17%
Chapter 9

5 Key Takeaways for Grocery Brands and Retailers

Grocery shopping sure looks a lot different than it did in early 2020. Brands and retailers must adapt their approaches to attract and convert grocery and CPG shoppers, whether they’re shopping online, in-store, or some combination of the two.

Here are our five key takeaways from our latest survey.

One
Online Grocery Shopping is Here to Stay

Some expected consumers to return to their pre-Covid shopping habits once vaccines were widely available. But that hasn’t been the case. 

Today, 71% of consumers have purchased grocery or CPG products online in the most recent three months, driven by motivations including time savings, less likelihood of impulse purchases, and safety, among others. And over half say the portion of their grocery and CPG budget that’s spent online has increased in the last 12 months. 

Online grocery and CPG shoppers have nearly endless options. You must ensure you have a strong strategy in place to attract these consumers.

Two
In-Store Grocery Shopping Continues to Thrive

Though consumers are embracing the convenience of browsing and buying groceries online, that doesn’t mean brick-and-mortar grocery is dead. 

95% of those we surveyed have made a grocery or CPG purchase in a brick-and-mortar store in the most recent 90 days. And 97% of online grocery shoppers also shop in-store.

While it makes sense to invest in digital, don’t do so at the peril of your brick-and-mortar locations. Instead, make it a priority to deliver winning, seamless experiences across all channels. 

Three
Online and In-Store Grocery Shoppers Alike Value Reviews

Grocery and CPG shoppers leverage ratings and reviews to make informed purchase decisions, wherever they shop.

90% of online grocery shoppers read ratings and reviews at least occasionally. And 81% of in-store grocery shoppers are at least somewhat interested in being able to access this content.

Make it a priority to collect a high volume of reviews across all of your grocery and CPG products.

And then once collected, be sure to prominently display this content where both online and in-store shoppers can find it. Of course, this means showcasing reviews on your website and mobile app. But in addition, look for opportunities to enhance in-store signage, packaging, and other marketing initiatives with star ratings and review content.

Four
Reviews are Especially Important for Unknown Grocery and CPG Products

Most consumers don’t consult reviews for grocery and CPG items they habitually purchase – such as diapers or cereal. However, most consumers are open to trying new grocery brands and products. And the availability of reviews can positively impact whether or not they follow through with a purchase. 

83% of consumers are more likely to purchase an unknown grocery or CPG item online if there are reviews for it. And 58% of consumers say this is the case when they’re shopping in-store. 

While it’s important to generate reviews across your entire catalog, be sure to focus on those new or recently released brands and products. Product sampling is a great way to quickly generate a high volume of reviews prior to launching a new product – or for lesser known brands and products in need of additional review coverage.

Five
Grocery Brands and Retailers Must Consistently Measure and Optimize Accordingly

Clearly, reviews are an important resource for both online and in-store grocery and CPG shoppers. If you’re looking to grow market share, you’ve got to make it a priority to collect and display more of this content so consumers can find it, wherever they shop.

When you’re developing your collecting and display strategies, it’s great to start with best practices – especially those that are specific to your industry. However, every business is different, and what works for one might not work for all. 

With that in mind, you must consistently measure the performance of your UGC programs. When you do, you’ll shed light on opportunities to improve your collection and display efforts – and start more effectively attracting and converting grocery and CPG shoppers. 

BFA is the parent company of IPSY (the largest beauty subscription service in the world) and BoxyCharm (the #1 searched beauty box brand on YouTube and – according to Inc. – one of the fastest growing companies in the US).

Over the course of their history, IPSY and BoxyCharm have amassed a huge ratings and reviews footprint from a highly enthusiastic member community. In total, the two brands combined have captured 82 million product ratings and reviews – which equates to more than 10,000 reviews per product on average. On average, they collect more than 1.6 million reviews per month. 

Join Doak Sergent (VP Brand Partner Strategy) and Natasha Zaveri (Manager, Brand Partnerships at BFA/IPSY/BoxyCharm) to hear:

  • An overview of the BFA ratings and reviews collection strategy
  • How BFA has used review content content historically and how this has evolved
  • Need to knows for brands about BFA’s review syndication program launching this month

In a rather uncertain world, there are some things we can be sure of. Caffeine is life. Change is inevitable. And reviews are a really big deal. 

Reviews, which were once a “nice to have” are now a must-have, regardless of whether a consumer is looking for a new couch for their living room, a new beach read for an upcoming vacation, or even a new sitter to watch their kids while they enjoy a night out.

But – digging deeper – what exactly are they looking for when they browse reviews on a product page?

A key insight from our recent research is that consumers consider a bunch of different factors when reading reviews – and deciding whether to purchase the product in question. But there are two factors that rise to the top: review volume and review recency.

Review Volume and Recency Defined – and Why These Factors Matter

Before we dive into a discussion about when review volume and recency are particularly important, let’s get aligned on what these terms mean – and why they’re important.

What is Review Volume?

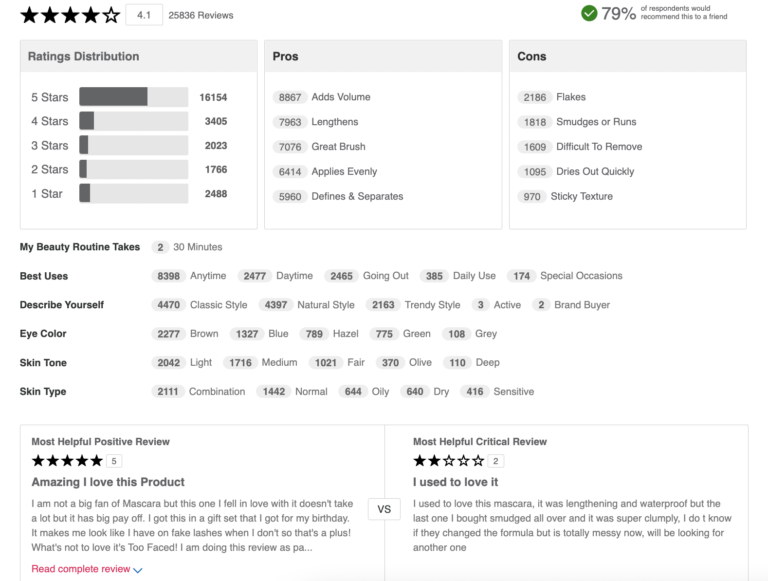
As you might have guessed, review volume is a term used to describe the number of reviews available for a given product. Let’s say a consumer is shopping for mascara. They come across one product with three reviews, and another with over 25,000 reviews.

Do they notice the difference in quantity? And do they care? 

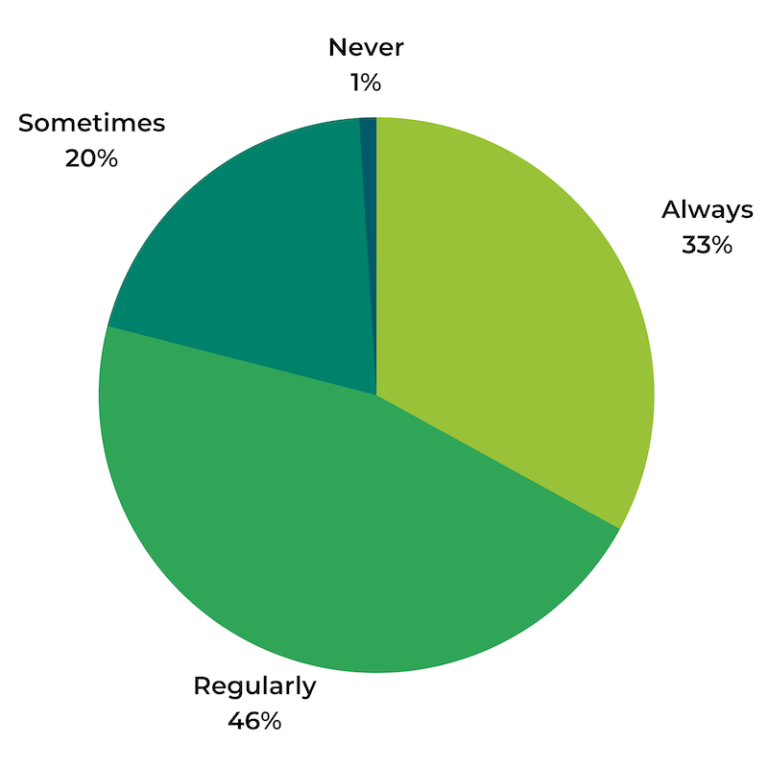
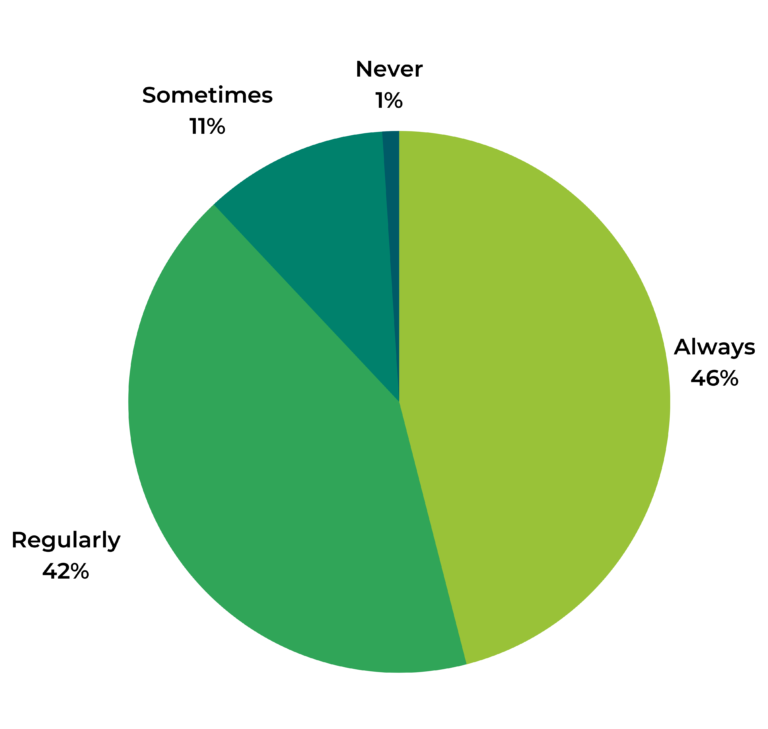
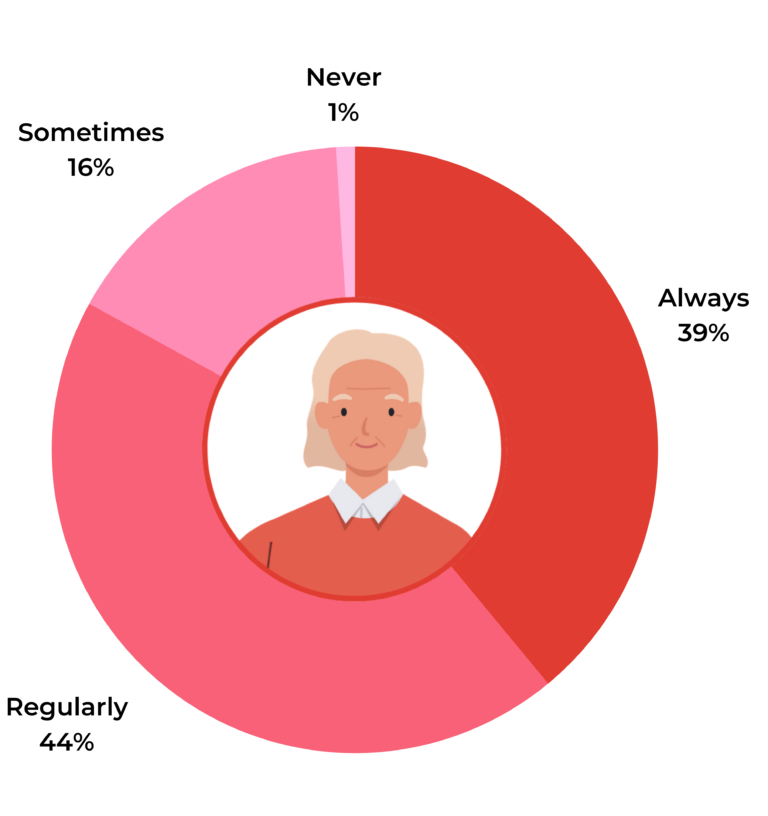
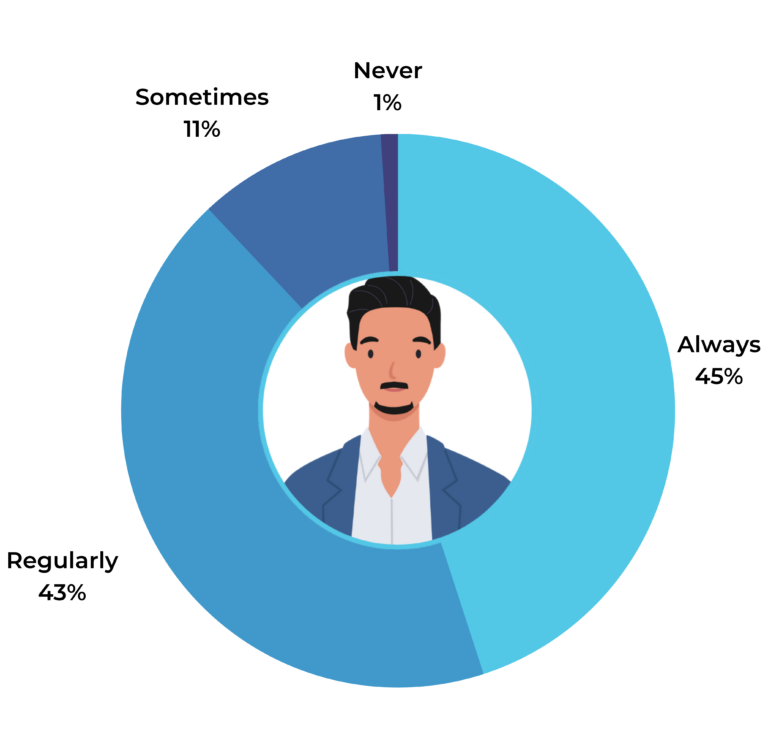
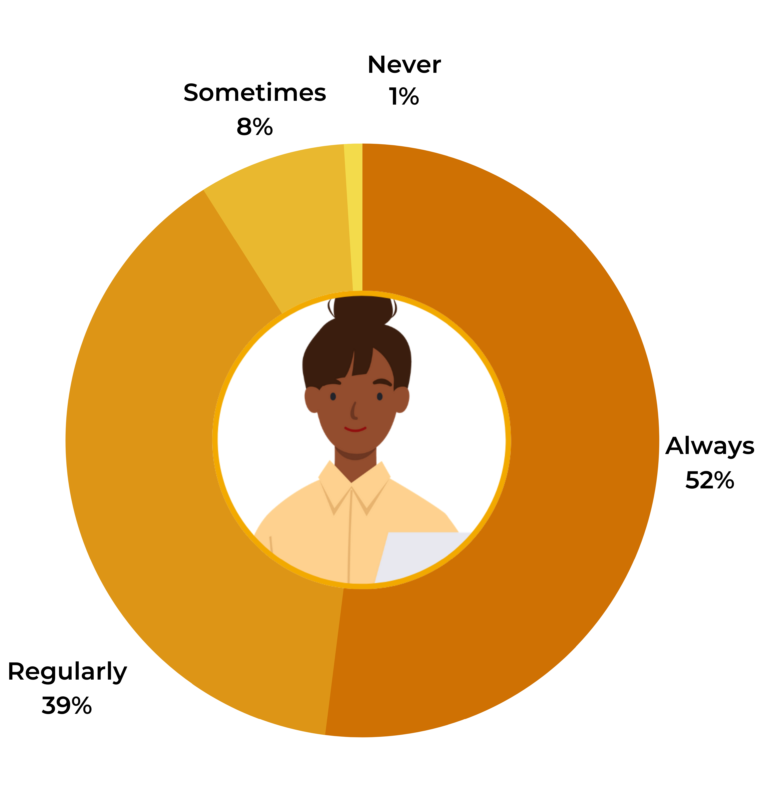
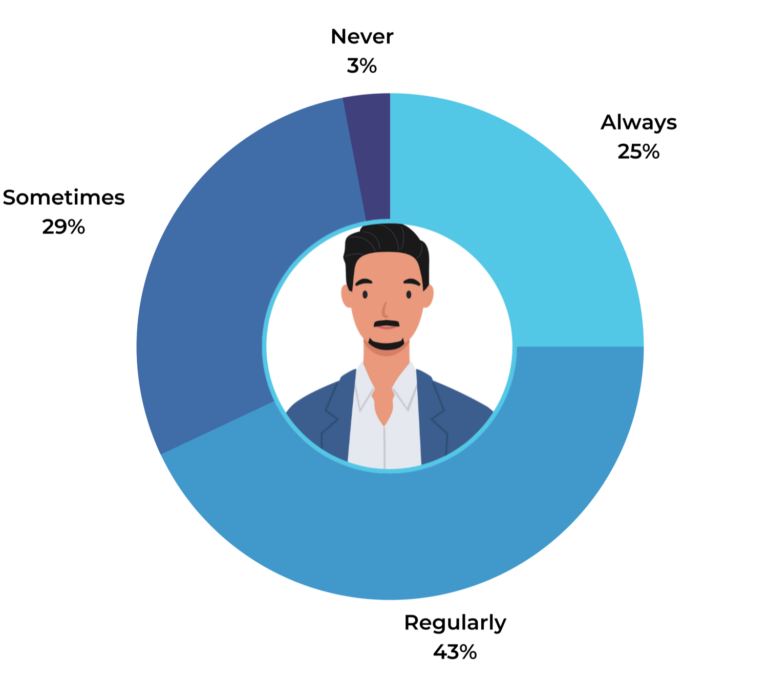
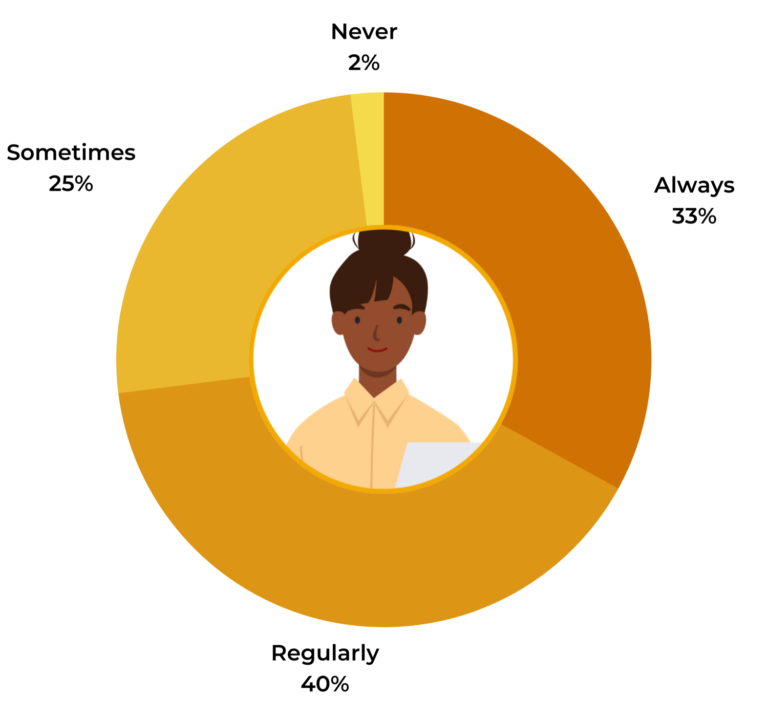
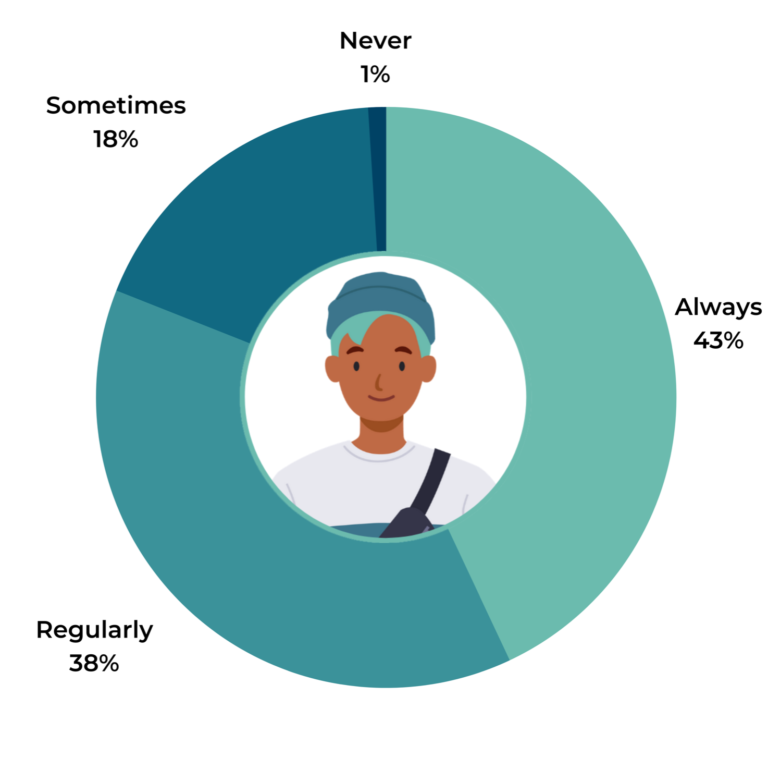
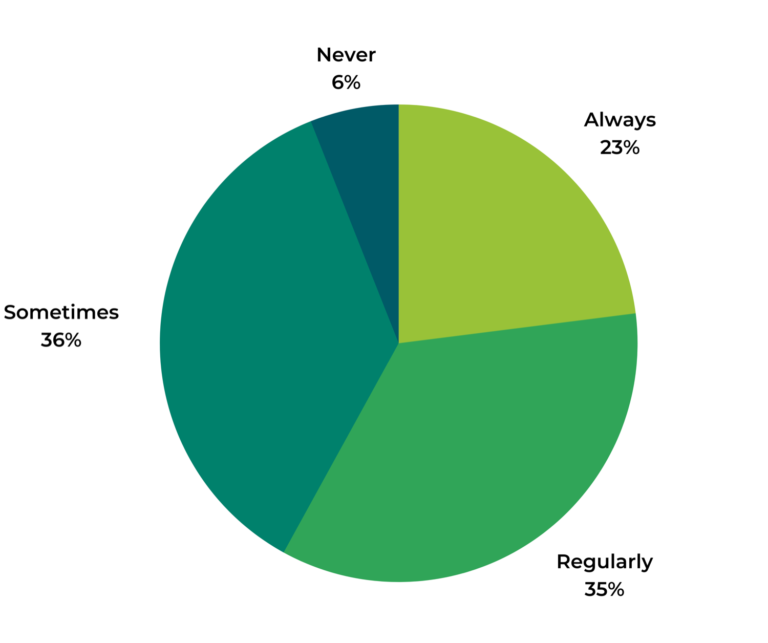
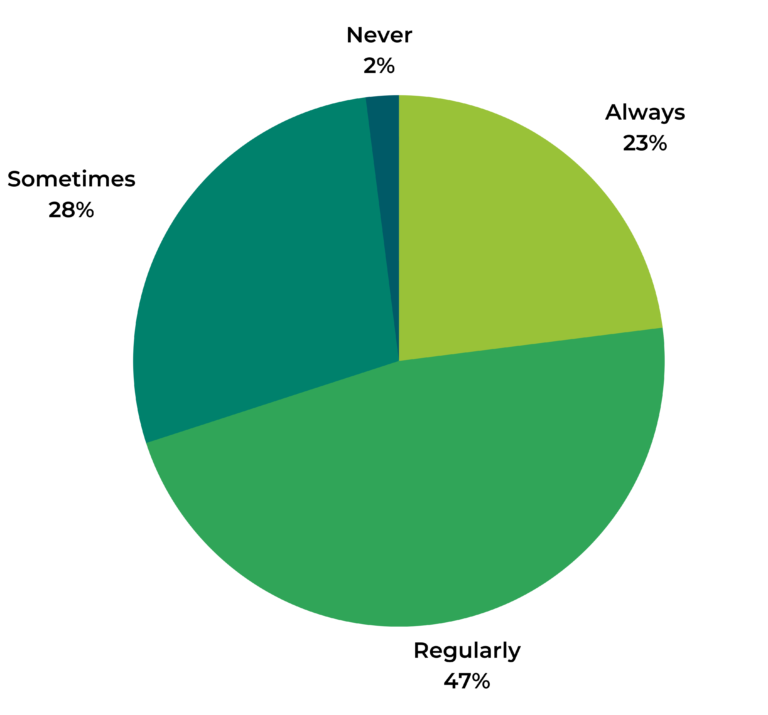
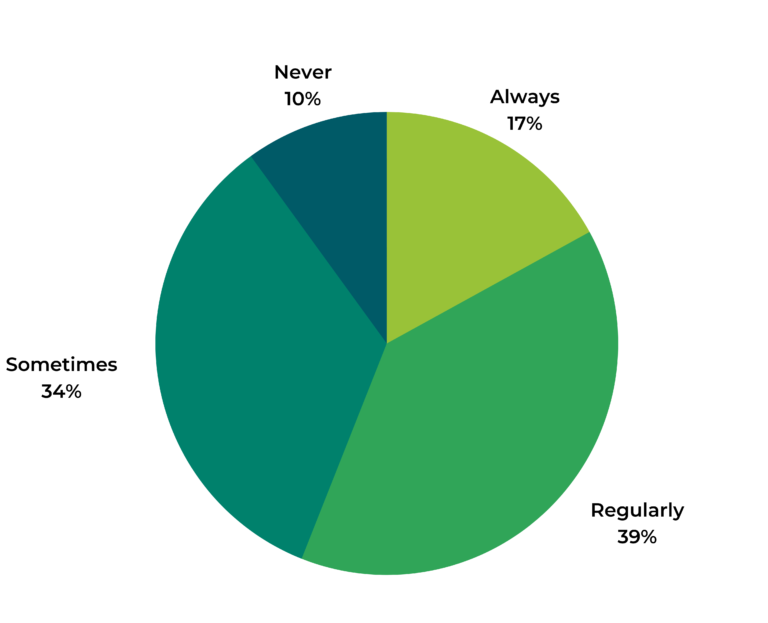
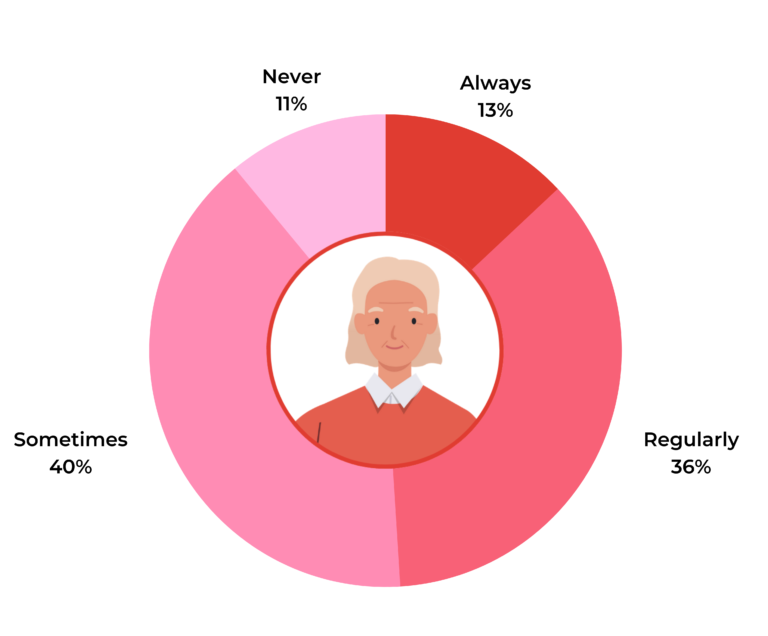
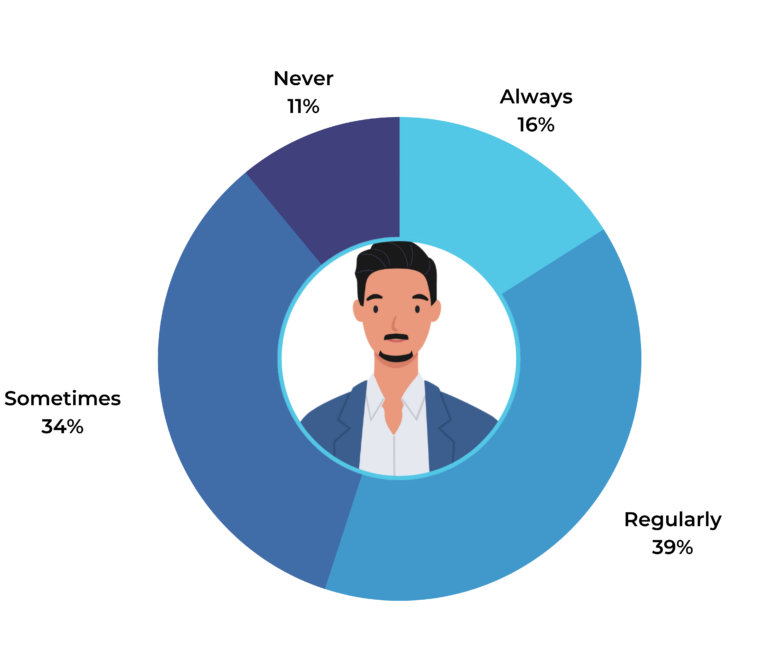
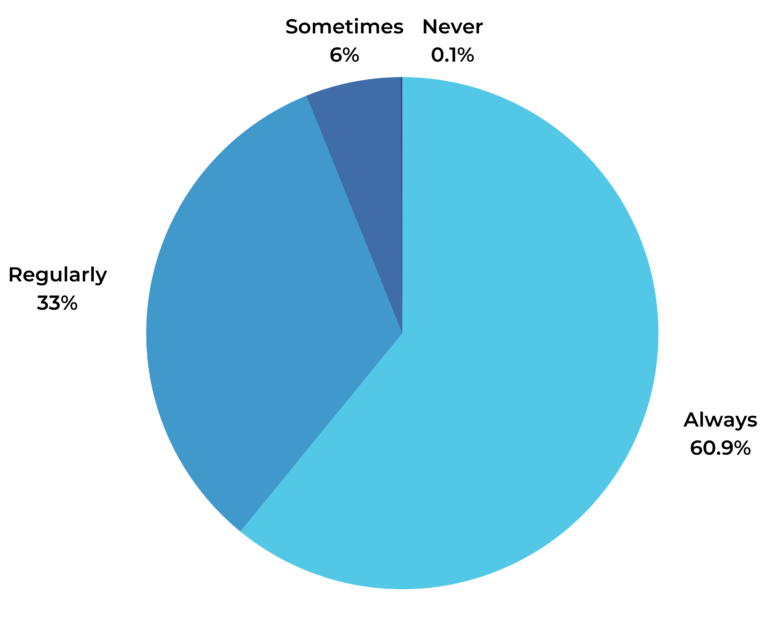
Absolutely! Our recent research found that a whopping 79% of consumers consider volume regularly or always when reading reviews. 

Importance of Review Volumes
When reading product reviews, how often do you consider how many reviews the product has?

Our own analysis of consumer activity across more than 1.5MM online product pages from more than 1,200 brand and retail sites further proves that more reviews = more sales.

Conversion Lift Relative to Number of Reviews Displayed
0 Reviews Displayed
0%
1-100 Reviews Displayed
76.7%
101-250 Reviews Displayed
143.2%
251-500 Reviews Displayed
166.4%
501-1000 Reviews Displayed
172.1%
1001-5000 Reviews Displayed
224.7%
5000+ Reviews Displayed
292.6%

If you’re interested in digging deeper into the importance of review volume (and are curious how many reviews you need for your products), check out this recent post

What is Review Recency?

Review recency is (yup, you guessed it) how recently a review was written. 

Do consumers notice that one of these reviews was written 3 years ago, while the other is from last week?

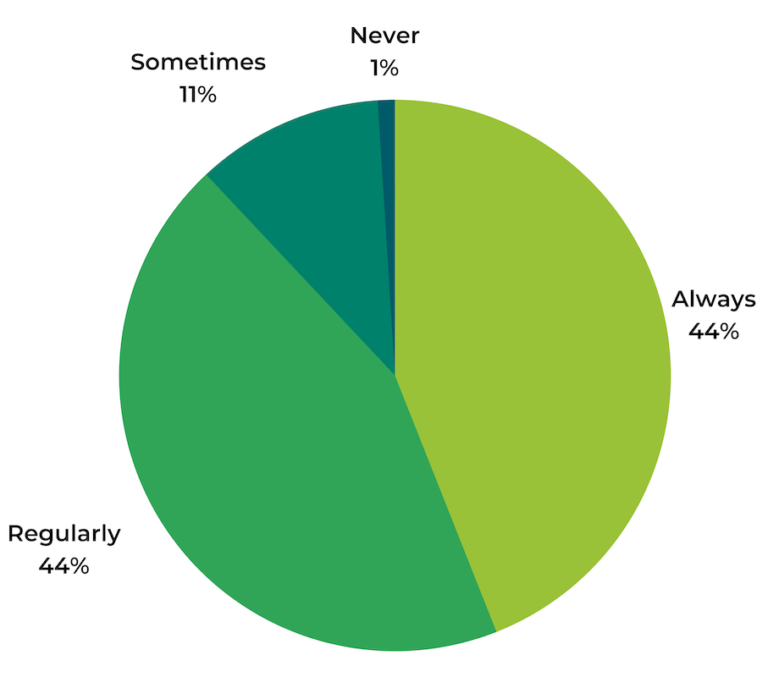
Yes! Per our research, 88% of consumers consider when a given review was written. 

Consumers Frequently Consider Review Recency
When reading product reviews, how often do you consider when the review was written?

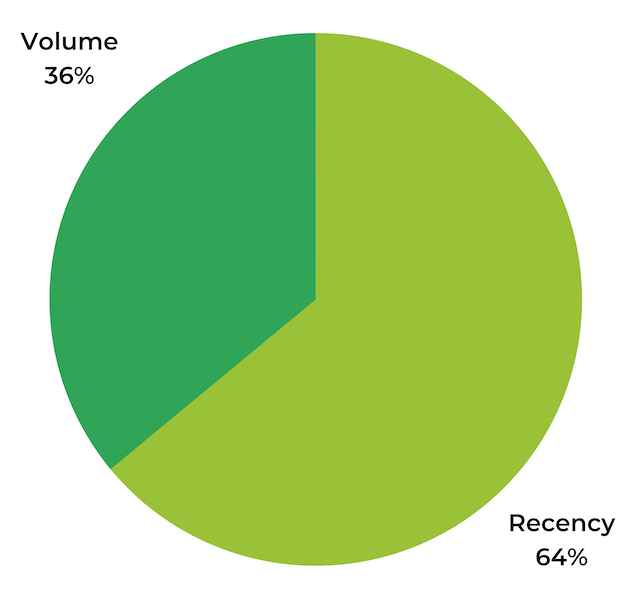
In fact, recency actually outweighs volume for many shoppers. 64% indicate they’re more likely to buy a product with fewer, more recent reviews than one with a high volume of reviews that were published 3+ months ago. 

Now that we’ve defined volume and recency – and why brands and retailers should care – let’s explore  when these factors are most important.

When Review Volume Matters Most

We’ve established that consumers pay attention to the volume of reviews for a given product. And, there are three circumstances when review volume is especially important to shoppers. 

1. When They’re Purchasing New or Unknown Products or Brands

There are certain products you probably buy time and again, without giving it much thought. Maybe it’s dog food or skincare products or items on your grocery list. You’re not taking chances when you buy these products; you’ve used them in the past and know exactly what to expect.

But then there are those times when you feel like branching out and trying a new (or new to you) brand or product. There is risk involved here, because you don’t have any experience with the product. You could get it and end up hating it. 

What helps shoppers overcome the risk of purchasing an unknown product? Reading a bunch of reviews. 71% indicate review volume is more important when considering a new product or brand. This number is especially high – 84% – for Gen Z’ers. 

So make it a priority to boost your volume of reviews – especially if you’re releasing new products or are a relatively new brand to the market.

2. When They’re Purchasing Products in Certain Categories

Let’s be clear: review volume matters for all product types. But, there’s also no denying that volume is especially important when consumers are shopping for products within certain categories. Four categories, in particular, rise to the top. 

Consumer electronics and appliances

80% of consumers consider review volume when purchasing these types of products. And this totally makes sense. Products in these categories are typically higher priced, which (as we’ll explore more in a bit) presents risk. Reading a high volume of reviews can help shoppers overcome that risk. In fact, there’s a 174.3% lift in conversion among those exposed to 5,000+ reviews for electronics and appliances, when compared to those exposed to no reviews.

Health and beauty

There are products that work largely the same – regardless of who purchases them – for example, a vacuum cleaner. Then, there are products like health and beauty items that are highly personal; they work differently for different kinds of people. For example, a concealer might work well for someone with combination skin – but not so great for someone with dry skin. 

Review volume is super important for those shopping for health and beauty products; 71% of consumers consider volume when purchasing products in this category. And the more reviews, the better. There’s a 367.3% lift in conversion among health and beauty shoppers exposed to 5,000+ reviews, when compared to those exposed to no reviews. 

Why? Most likely, because shoppers exposed to a ton of reviews are better able to find content that’s most relevant to their needs and use cases. And this gives them the confidence to purchase.

Clothes, shoes, and accessories

This is another example of a product category that’s highly personal. For example, a dress is going to fit and look different depending on a person’s height and body type. 

63% of shoppers consider review volume for products in this category. Again, this is likely because those shopping for these products want to find a high volume of reviews so they can then narrow down to find content submitted by others like them. And displaying a high volume of content for products in this category pays off. Our analysis found that there’s 179.7% lift in conversion among clothing, shoe, and accessory shoppers exposed to 5,000 or more reviews.

Home improvement, decor, and furniture

Consumers’ homes reflect their unique personalities. And many spend time researching decor, furniture, and other items that’ll work best for their spaces. They depend on reviews to find the right items, and they pay attention to the quantity of reviews. 57% of consumers consider review volume when shopping for products in this category. 

Similar to other categories, a high volume of reviews helps those shopping for home improvement, decor, and furniture to sort, filter, and search to hone in on content that was submitted by those with similar spaces, tastes, and needs. And the sweet spot seems to lie between 501 and 1,000 reviews. Those exposed to between 501 and 1,000 reviews convert at a rate that’s 154.9% higher than those exposed to no reviews. 

Sure, review volume is particularly important for the four categories we explored above. But, it’s important to remember that a good portion of shoppers pay attention to review quantity for many categories, as outlined below.

Importance of Review Volumes by Product Category
For which of the following product CATEGORIES do you consider review volume?
Consumer Electronics and Appliances
80%
Health and Beauty
71%
Clothes, Shoes, and Accessories
63%
Home Improvement, Decor, and Furniture
57%
Pet Products
43%
Toys
41%
Perishable Products/Groceries
37%
Dry Goods/Consumer Packaged Goods
35%
Baby Products
34%

Prioritize collecting a high volume of reviews for the categories for which it matters most. But, the ultimate goal should be to have lots of reviews across all product categories. 

3. When They’re Purchasing Certain Types of Products

The value shoppers place on review recency also varies by product type. And there are two types of products for which volume is especially important.

High price point or luxury products

73% of shoppers say that volume is important when they’re considering an expensive or luxury product. And for good reason! If you’re about to sink a lot of money into a purchase, you probably want to know it’ll be a good fit for your needs. Reading a lot of reviews can boost a shopper’s confidence in their purchase decision.

New arrivals

As we mentioned before, there’s risk involved with purchasing a new product. Reading a lot of reviews can help shoppers overcome that risk. So it’s probably not surprising that 67% of consumers say they consider review volume when purchasing new arrivals. Prior to launching a new product, consider doing a product sampling campaign. That way, when you officially launch the product, there will already be plenty of reviews in place. 

Other product types

Sure, review volume is especially important for high price-point and new products. But as you can see in the chart below, a good portion of shoppers also consider volume for items with a high purchase frequency, items that have been around for a long time, and non-season specific items. So while it certainly makes sense to make it a priority to collect a high volume of reviews for expensive items and new arrivals, the end goal should be to have a lot of reviews across all product types. 

Importance of Review Volume by Product Type
For which of the following product TYPES do you consider review volumes?
High price-point or luxury
73%
New arrivals
67%
Items with a high purchase frequency
47%
Items that have been around for a long time
40%
Non-season specific items (that may have a longer shelf life)
39%

When Review Recency Matters Most

We know shoppers pay particularly close attention to review volume when they’re buying new (to them) products, as well as when they’re shopping for specific categories and types of products. But when does recency matter most?

By and large, recency matters in the same circumstances in which volume matters – but it matters even more. Let’s explore two of those instances. 

1. When They’re Considering a New (to them) Product

Review volume is particularly important when consumers are considering a new (or new to them) product or brand. As it turns out, this is also a circumstance when review recency is especially important. 86% of shoppers say that review recency is more important when considering a product or brand they haven’t purchased before. 

I can’t stress this enough: it is so important to generate a steady volume of fresh reviews – especially if you’re a newer brand or are releasing new products. That way, consumers (especially those who haven’t shopped with you before) can always find lots of fresh content to boost their confidence.

2. When They’re Purchasing Certain Categories of Products

Remember how we said review volume is particularly important when shoppers are purchasing products within certain categories? Namely, consumer electronics and appliances, health and beauty, apparel and shoes, home improvement and decor? 

Well, recency is of the utmost importance for these exact same categories. 

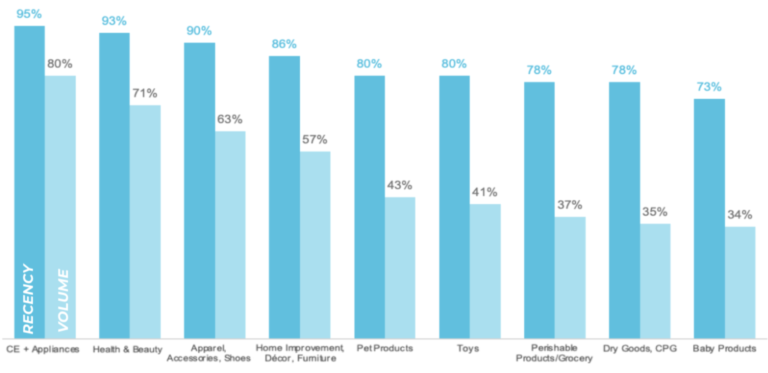
Take a look at the chart below and you’ll see that the categories for which recency matters most are ranked in the exact same order as the categories for which volume matters most. However, you’ll probably also notice that in every category, recency actually matters more than volume. And in some cases, it matters A LOT more. Take, for example, grocery products. While 37% of shoppers say volume matters in this category, over twice that amount – 78% indicate recency is important.

Importance of Recency vs Volume by Category

So while recency is especially important for consumer electronics and appliances, health and beauty, apparel, accessories and shoes, and home improvement decor, and furniture, the reality is, it’s super important across every single category in the list. 

If you sell any of these product types, you’ve got to make it a priority to generate a steady stream of reviews so shoppers can always find recent content. Otherwise, you risk losing them to a brand with fresher content.

It’s Time to Prioritize Review Volume and Recency

Consumers consider many factors when reading reviews. But volume and recency rise to the top. 

Review volume and recency are particularly important in certain circumstances, including when shoppers are considering new (to them) products and purchasing items in certain categories. So be sure to prioritize these types of products.

But make no mistake: review volume and recency are key factors across all product categories. So the end goal should be a high volume of recent reviews across your entire product catalog. The good news is, by generating a steady stream of reviews, you can achieve both your volume and recency goals. By doing so, you’ll better meet shopper expectations – and grow your sales.

Check out our Complete Guide to Ratings and Reviews

for practical tips to collect more and better reviews.

Alyson Fischer

Alyson Fischer is our Product Marketing Manager, obsessed with using data-driven storytelling to deliver a best-in-class customer experience and inspire dynamic engagement across channels. When she’s not agonizing over writing this bio, you can find her exploring Chicago with her furry sidekick or watching a true crime documentary on Netflix.

Power Points

  • 64% of consumers say they’re more likely to buy a product with fewer, more recent reviews than if it has a higher volume of reviews published three or more months ago. This number is even higher – 69% – among Boomers. 

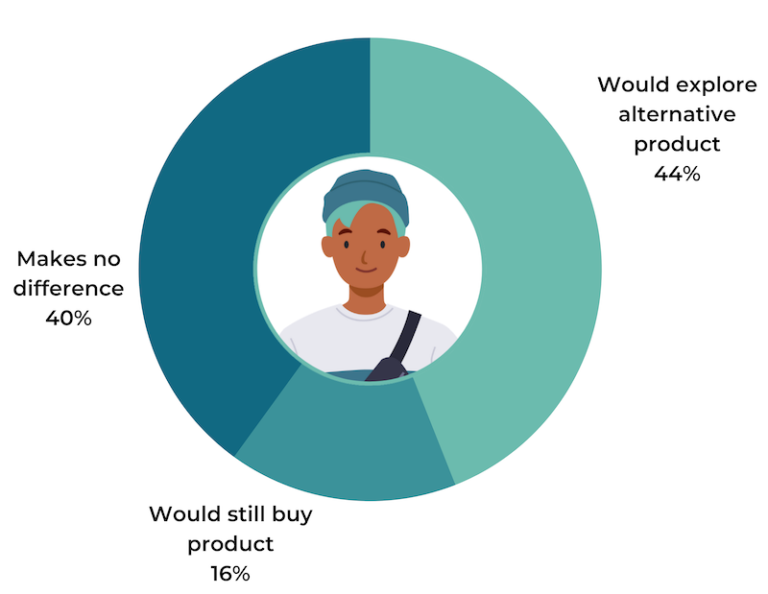
  • Over a third (38%) of consumers will not purchase a product if the only reviews available were published three months or more ago, including nearly half (44%) of Gen Z and 40% of Millennials.

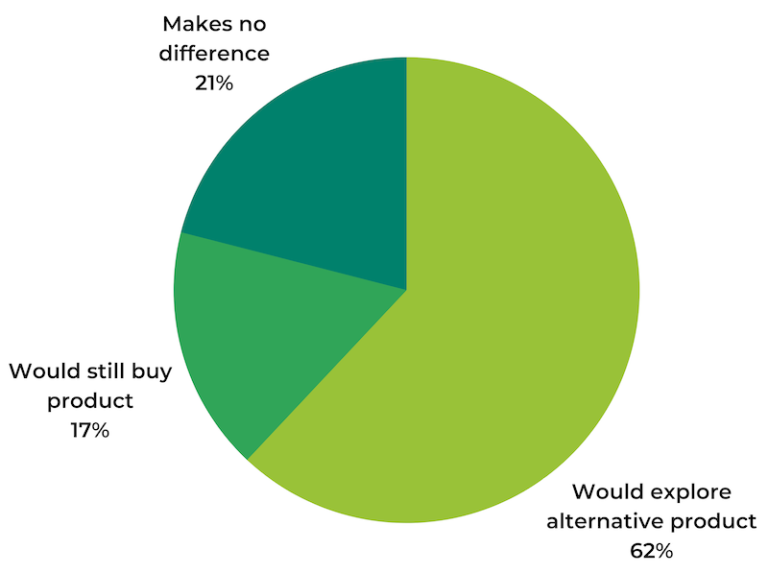
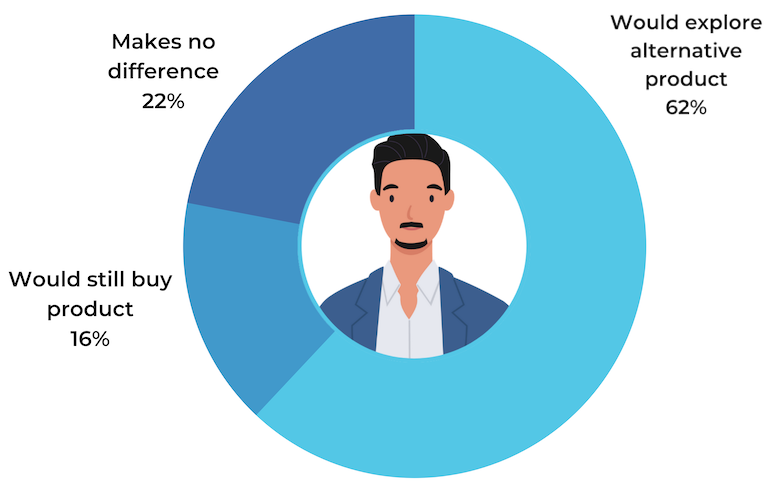
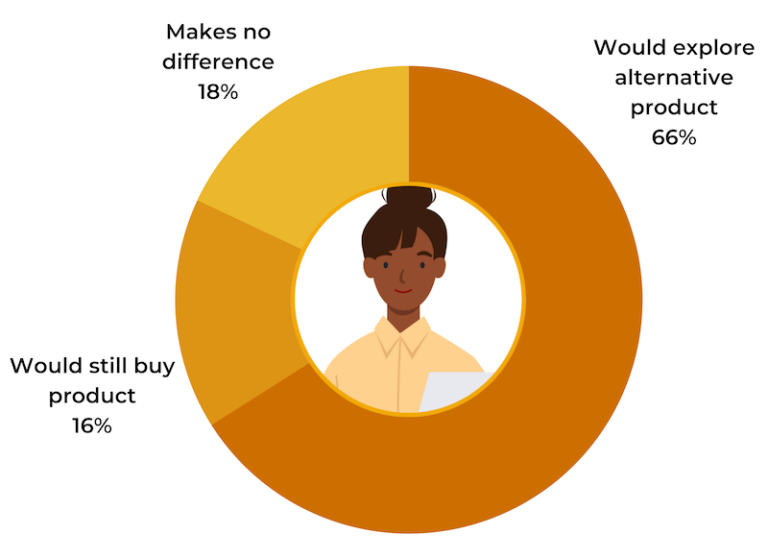
  • 62% of consumers will not purchase a product if the only reviews available were published a year or more ago. This number is even higher – 66% – among Gen Z and Millennials.

97% of consumers consider review recency to be at least somewhat important when considering a purchase, according to our recent survey of more than 9,000 consumers and analysis of activity across 1.5MM+ ecommerce product pages on 1,200+ brand and retailer sites.

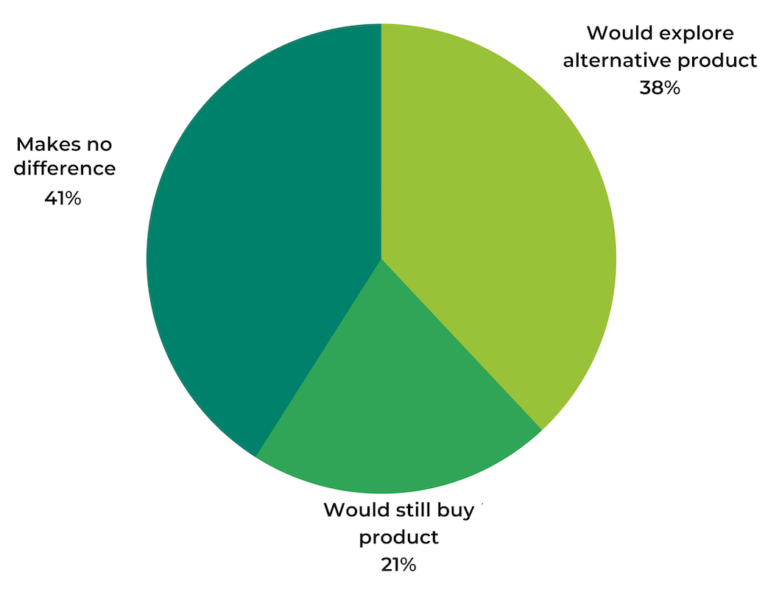
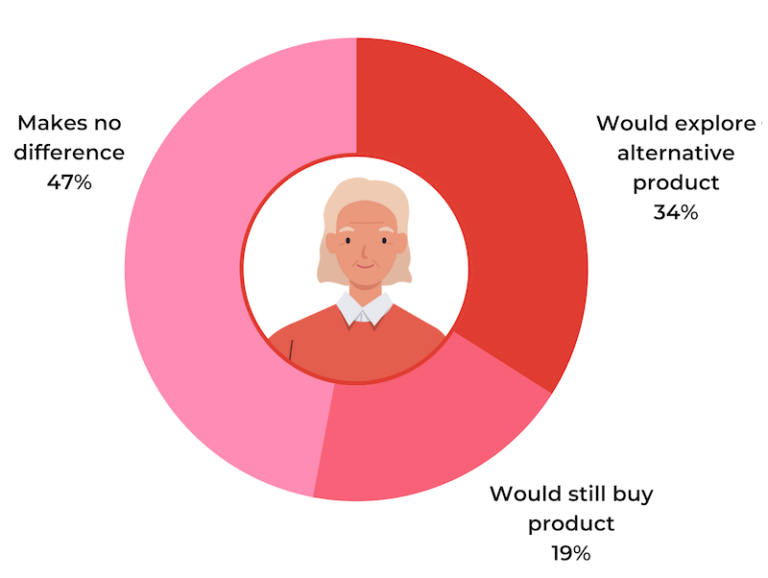
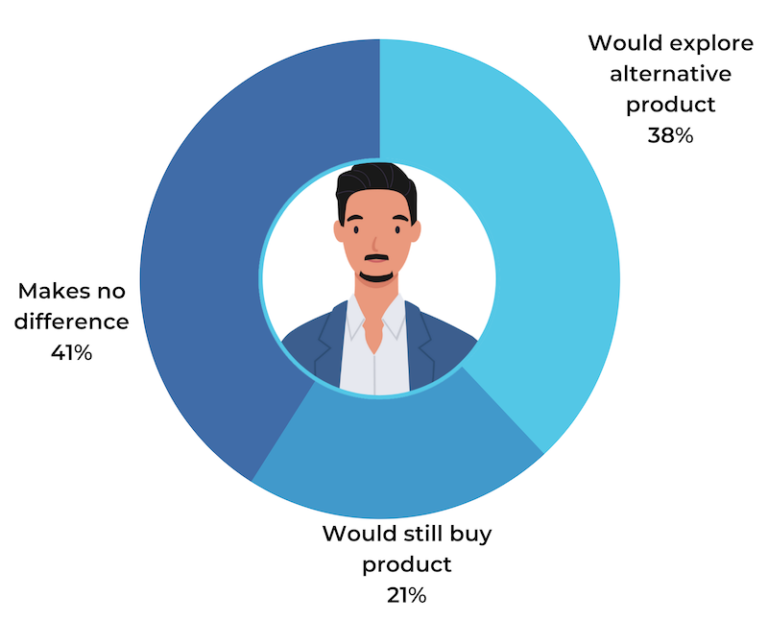
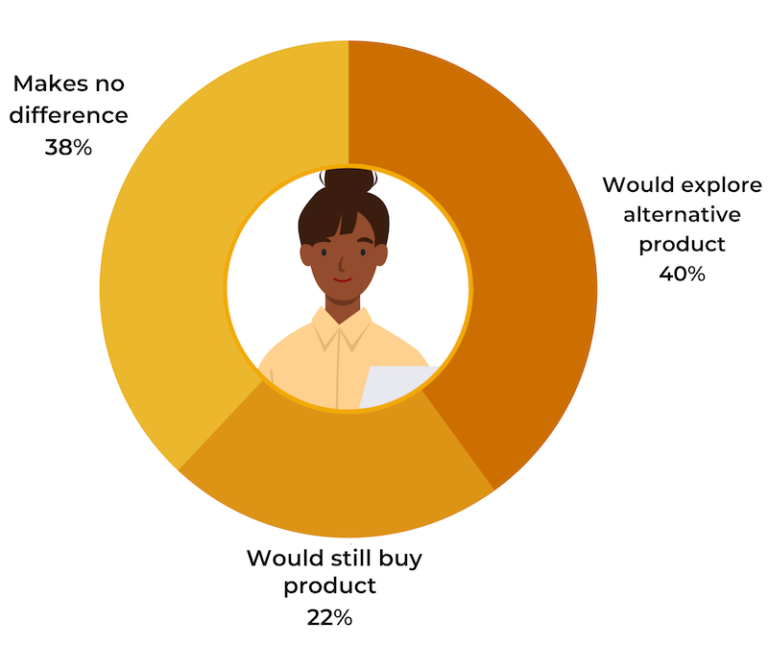
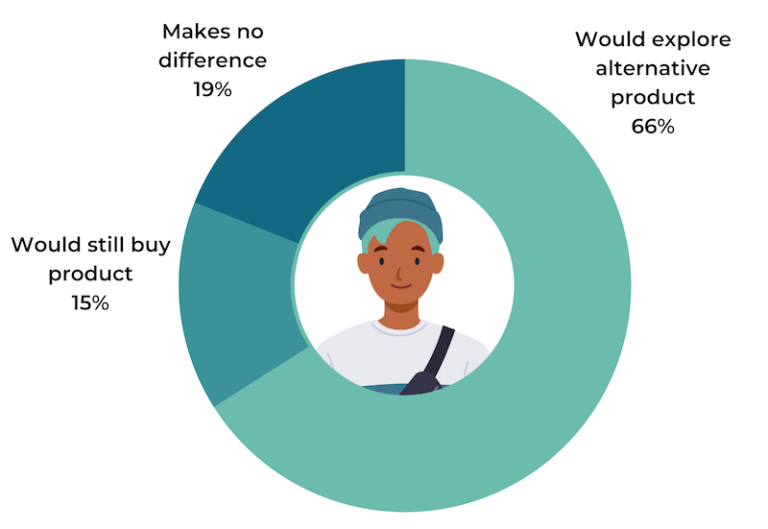
Review recency, or how recently a given review was published, matters a lot to consumers. Across the board, an overwhelming number of consumers told us they expect to see recent reviews for a product — or they’ll seek out an alternative from a competitor. If the only reviews available for a product were published three months ago or more, for example, 38% of consumers will explore a competitive product. If the only reviews are from one year ago, that percentage increases to 62%.

According to our analysis, review recency becomes even more important in certain situations. For example, 86% of shoppers feel that review recency is more important when considering a new product or brand they haven’t purchased before. And consumers value review recency most in categories like Consumer Electronics, Health and Beauty, and Clothes, Shoes, and Accessories.

This got us thinking: does review recency matter more to different subsets of consumers? More specifically, how do different generations value review recency? 

Read on as we share the answers to those questions, and proven best practices for ensuring your consumers find the reviews they’re looking for — no matter their age.

Survey Demographics

Gen Z
(1997-present)
3%
Millennials
(1981-1996)
35%
Gen X
(1965-1980)
51%
Baby Boomers
(1946-1964)
11%

Across Generations, Review Recency Tops Volume

As we mentioned earlier, nearly all (97%) of consumers consider review recency to be at least somewhat important, including 61% who consider it to be very important. While many consumers also value a high quantity of reviews, the majority of consumers told us that when forced to choose between the two, they would choose to see more recent reviews.

In fact, 64% of consumers told us that they would rather buy a product with fewer, but more recent, reviews than one with a higher number of reviews that were all three months or older. Overall, nearly twice as many consumers said that they value review recency over volume. 

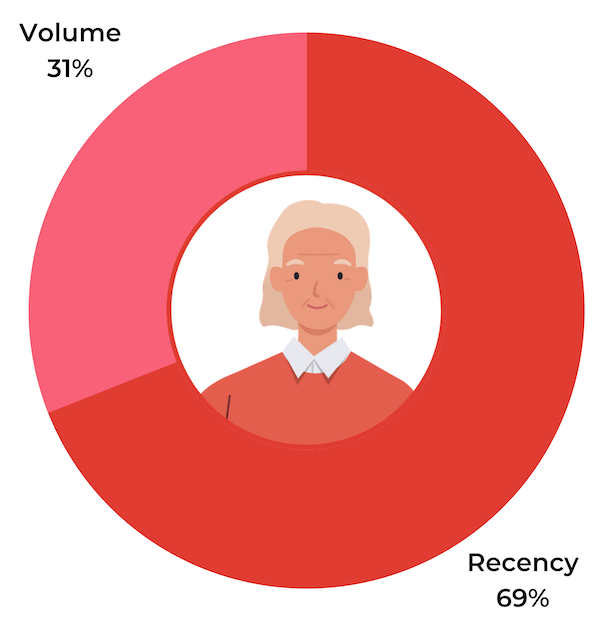
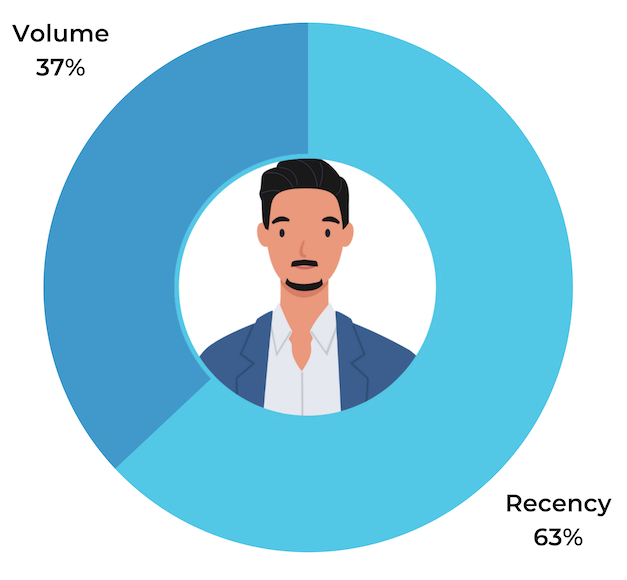
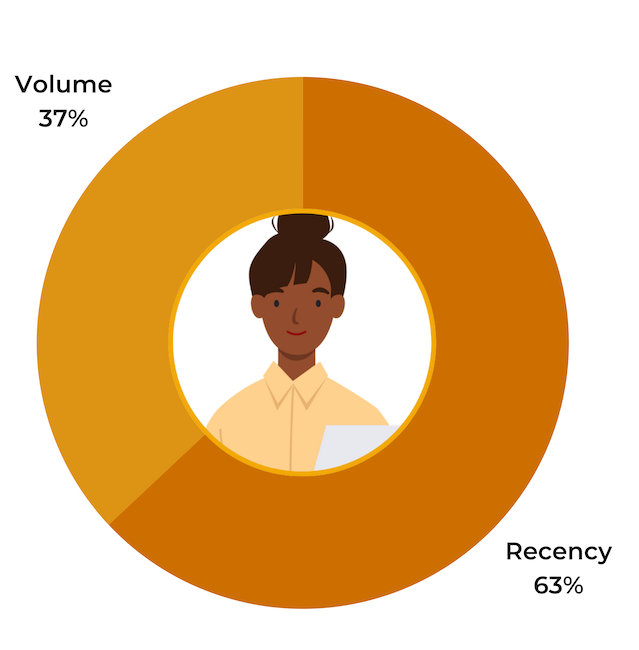
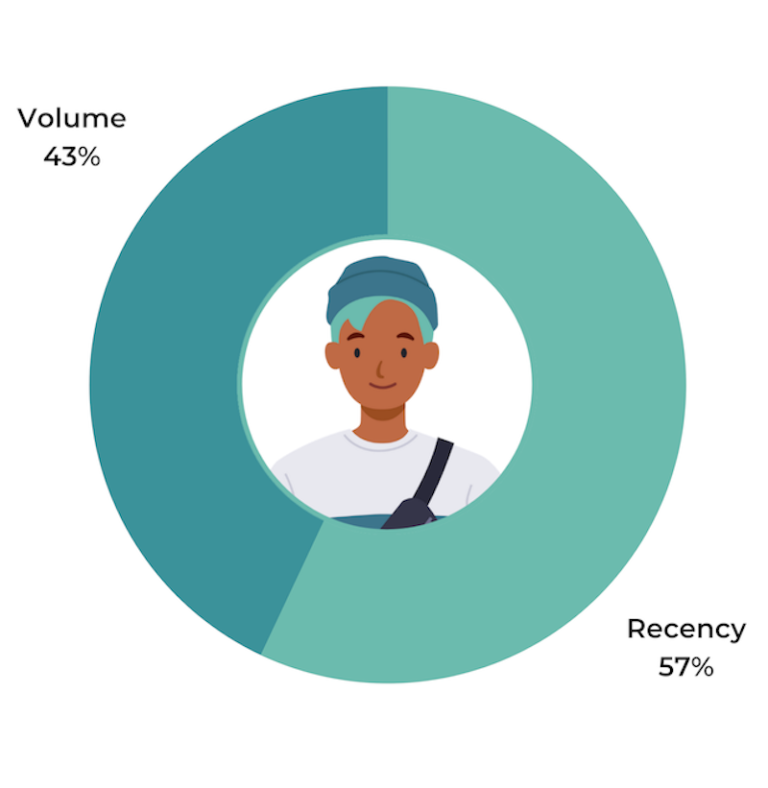
Interestingly, the older the consumer, the more likely they are to value review recency over volume. At 69%, Boomers were the most likely to say that review recency is more important than review volume. At 57%, Gen Zers were 12 percentage points less likely to value review recency over volume. Gen Xers and Millennials landed somewhere in the middle, with 63% valuing review recency over volume.

The Importance of Recency vs Volume
Would you be more likely to buy a product with fewer reviews overall that are all written within the past three months over a product with more reviews but all written longer ago than the past three months?
Overall
Boomers
Gen X
Millennials
Gen Z

Without Recent Reviews, Younger Shoppers Are Likely to Shop Elsewhere

Review recency is so important to shoppers that it influences their purchasing behavior. If shoppers can’t find recent reviews for a product, they are more likely to consider a competitive product that has fresher content. 

We posed a hypothetical to consumers: If all the reviews on a product you are considering were published three months ago or more, how would that affect your purchasing behavior? Overall, roughly four in ten (38%) consumers said it would make them more likely to explore an alternative product. Only 21% said they would still buy the product.

Whether Consumers Consider Alternative Product if all Reviews are 3+ Months Old
If all reviews on a product you are considering buying were published THREE MONTHS AGO OR MORE, would that make you more likely to consider purchasing an alternative product from a competitor that has more recent reviews?
Overall
Boomers
Gen X
Millennials
Gen Z

A lack of recent reviews is most likely to drive comparison shopping among younger consumers. If the product they’re considering buying only has reviews from three months ago or more, nearly half (44%) of Gen Zers would explore an alternative from a competitor. Millennials were close behind, with 40% saying they would consider a competitive product.

Interestingly, despite being the generation most likely to value review recency over volume, Boomers were the least likely to explore an alternative product if the product they were considering only had reviews that were published three months ago or more. Even so, one-third of Boomers said they would consider a competitive product, a not-insignificant percentage. 

Generational Comparison: Most Consumers Would Pass up a Product if All Reviews Were a Year or Older

The older the reviews are, the more likely consumers are to go with a different product instead. When we asked consumers the same question, but increased the age of the reviews from three months to one year, the percentage of shoppers who would consider an alternative product from a competitor increased significantly across generations. 

Whether Consumers Consider Alternative Product if all Reviews are One Year Old+
If all reviews on a product you are considering buying were published ONE YEAR AGO OR MORE, would that make you more likely to consider purchasing an alternative product from a competitor that has more recent reviews?
Overall
Boomers
Gen X
Millennials
Gen Z

If all the reviews for a product were published one year ago or more, 62% of consumers (regardless of age) would explore an alternative product — a 63% increase from the 38% who said the same thing when the reviews were three months old. 

When we break it down by generation, a majority of every age group indicated that they would consider an alternative product, including Boomers. At 66%, Gen Z and Millennials were still the most likely to start comparison shopping if there weren’t any recent reviews for a product they were considering. 

Gen Xers experienced the largest increase in consumers who said they would look into a competitive product. 62% of Gen Xers said they would, a 63% increase from the 38% who said the same when the reviews were three months old. 

How Age of Reviews Affects Purchasing Behavior

When we compare both of these findings side by side, we see a clear relationship between the age of available reviews and a consumer’s likelihood to consider an alternative product from a competitor. The findings are undeniable: the older the available reviews are for a product, the more likely a consumer is to shop elsewhere.

Whether Consumers Consider Alternative Product if All Reviews Are 3+ Months Old vs. 1+ Years Old by Generation
Boomers
3 Months+
34%
1 Year +
52%
Gen X
3 Months+
38%
1 Year +
62%
Millennials
3 Months+
40%
1 Year +
66%
Gen Z
3 Months+
44%
1 Year +
66%

How to Consistently Generate Fresh Review Content: Three Tips for Brands and Retailers

In today’s competitive retail landscape, having recent reviews is no longer optional. It’s essential if brands and retailers want to convert more customers and avoid losing them to a competitor. How recent is recent enough? The vast majority (77%) of consumers expect to find reviews that were published within the last three months, including 44% who want to be able to find reviews written within the past month.

Based on these findings, we share our top three recommendations for brands and retailers below.

1. Know Your Users

Review recency and volume are both generally valued highly by consumers, and they both have a conversion impact. However, some generations care more about one over the other. So, if your brand caters primarily to one generation, make sure your review displays are sharing the information they’re looking for.

For example, if Boomers represent a majority of your customers, you need to prominently display the dates a review was written in a spot that’s easily noticeable alongside each review. You may also want to default your review display to sort by Most Recent, rather than Most Helpful. Here’s an example from Wander Beauty:

This health and beauty brand sorts reviews by recency, and lists the submission date first in the review details.

2. Consistently Drive New Review Content

To ensure shoppers always have recent reviews to read, brands and retailers must make it a priority to consistently generate new review content. There are dozens of ways to collect new reviews, but one of the best ways is to follow up with verified purchasers after they’ve bought something.

Send emails to your customers 7 to 21 days after their purchase and ask them to write a review. Include the products they purchased in the body of the email, and enable review collection from the email itself. Our research has found that nearly 80% of all review content is generated from email requests like these.

Personalize your post-purchase emails with the customer’s name and direct links to review the products they purchased. Make sure you ask for reviews on all products purchased to increase collection volumes.

If you need to augment organic collection methodologies, “Receipt. Review. Collect.” taps into receipt uploads from an army of 12 milllion consumers across multiple retailers and marketplaces (Amazon, Target, Kroger and Albertsons grocery stores and many many more) to generate a regular stream of review content from actual verified buyers.

3. Keep an Eye on Review KPIs

Some products invariably generate fewer reviews than other products. That’s why it’s so important to monitor your review KPIs for all of your products, especially overall review volume and the date of the most recent review. 

When the most recent review for a product passes the threshold of 90 days — or, ideally, 30 days — it’s time to implement a review generation campaign.

Promote review sweepstakes via email campaigns and social media.

While this article is about review recency specifically, make sure you do whatever you can to launch products with new reviews. Obviously, this is a little bit of a chicken and egg scenario so it’s easier said than done. Product sampling is one commonly used solution for this problem.

Don’t forget: When a shopper is exposed to a product page with 1 or more reviews, conversion lifts by 52.2%. Translation: it’s critical to launch new products with reviews.

New Reviews Never Get Old

No matter their age, all consumers prefer recent reviews — and the more recent, the better.  However, there are key generational differences in how consumers value review recency. By understanding these differences, brands and retailers can better serve their customers and win more sales.

Alyson Fischer

Alyson Fischer is our Product Marketing Manager, obsessed with using data-driven storytelling to deliver a best-in-class customer experience and inspire dynamic engagement across channels. When she’s not agonizing over writing this bio, you can find her exploring Chicago with her furry sidekick or watching a true crime documentary on Netflix.

What consumers look for in reviews, how these factors impact purchase behavior, and how they surface the content that meets their needs, according to a survey of more than 11,000 U.S. consumers.

Survey at a Glance:

Beyond the Basics: Key Information Shoppers Look for in Product Reviews is based on a survey of 11,165 consumers across the United States. Here’s a snapshot of our key findings. 

Consumers dive deep into review content.
  • 58% of consumers say a star rating alone isn’t as valuable as a star rating with an accompanying review.

  • 99% of shoppers look beyond basic summary information to read the actual review content at least sometimes; 88% do so regularly or always.

  • 62% of shoppers who spend $2,001+ per month always go beyond basic review information to read the content of reviews, compared to 41% of those who spend $1-$250 per month.

  • Top reasons consumers read raw content of reviews include learning about negative experiences (84%), use cases (78%), and performance claims (73%) and sizing information (70%).
When it comes to reviews, length matters.
  • 97% of shoppers actively seek out longer, more detailed reviews at least sometimes; 68% do so always or regularly. 

  • Categories where review length matters most: consumer electronics and appliances (86%), health and beauty (73%), clothing, shoes and accessories (71%), and home decor and home improvement (67%).
Shoppers value visual content.
  • 94% seek out visual content within reviews at least sometimes; 58% do so always or regularly.

  • User-generated visual content is important across all categories. But it’s especially impactful for clothing, shoes, and accessories (76%), home decor and home improvement (67%), consumer electronics and appliances (64%), and health and beauty (56%).

  • Nearly a quarter (24%) of Gen Z shoppers won’t purchase a product if there is no visual content from people who previously bought it.
Shoppers leverage myriad features to surface the most relevant review content.
  • 77% of shoppers find it useful to be able to filter reviews based on different factors (ie star rating, reviewer demographics, etc.).

  • 61% of consumers actively seek out one-star reviews.

  • Over half (55%) of consumers seek out reviews that have been voted or tagged as “helpful” by other shoppers; 73% of Gen Z shoppers do so. 

  • 72% find a review search feature to be useful.
Chapter 1

Introduction

The Power of Reviews is Clear

By now, one thing is crystal clear: consumers depend on reviews when shopping for just about anything. A whopping 99.9% consult this content when shopping online – and 57% do so when shopping in brick-and-mortar stores.

Not All Reviews are Created Equal

But not all reviews deliver the same amount of value to shoppers. While one review might provide rich, relevant insights that help shoppers make smart purchase decisions, another might leave them with more questions than answers.

What sets some reviews apart from the rest?

Shoppers Look for Multiple Factors When it Comes to Product Reviews

The reality is: consumers look for several factors when it comes to reviews. In our last report, we focused on two of those key factors: recency (in other words, how recently a review was written) and volume (how many reviews are available for a given product).

When it Comes to Reviews, Quality is Key

In this report, we zero in on yet another top factor that matters to shoppers: review content quality. In other words: specifically what type of review content leads shoppers to follow through on purchasing a product.

And as it turns out, there are many elements to consider. 

In this report, we’ll share key findings from our latest survey. We’ll explore:

  • The importance of review quality
  • What shoppers look for in review content
  • How the absence (or presence) of certain elements impacts purchase behavior
  • How shoppers engage with reviews to find the content that fits their needs

Start Collecting and Displaying Better Quality Reviews

Based on our findings, we’ll also share tips for generating higher quality reviews that meet the standards of modern shoppers, as well as best practices for displaying this content in a way that satisfies shoppers – and boosts conversion. 

Chapter 2

Who We Surveyed

This research is based on a survey conducted in February 2022 of 11,165 US consumers. Here’s a closer look at who we surveyed.

Generations

Gen Z
(1997-present)
2%
Millennials
(1981-1996)
30%
Gen X
(1965-1980)
45%
Baby Boomers
(1946-1964)
23%

Household Income

Average Monthly Online Spend

Chapter 3

When it Comes to Reviews, Consumers Go Beyond the Basics

Today, nearly all shoppers turn to reviews when shopping online – and over half (57%) do so when shopping in brick-and-mortar stores. But just how deeply are consumers diving into the content of reviews?

Most Consumers Look Beyond Basic Information

Basic information – such as the number of reviews and average star rating for a given product – is a great starting point for consumers looking for feedback from others like them. But when browsing reviews, nearly all shoppers (99%) look beyond this basic information and read the actual review content at least sometimes. 88% do so regularly or always.

Of note, younger consumers are more likely to indicate they always go deeper. 63% of Gen Z shoppers and 52% of Millennials always read the content of reviews, compared to 45% of Gen X’ers and 39% of Boomers.

The Vast Majority of Consumers Go Beyond the Basics and Read the Actual Review Content
When you read product reviews, how often do you look beyond the basic information (i.e. review volume count, review date and average star rating) to dig deeper and read the actual review content?
Overall
Boomers
Gen X
Millennials
Gen Z

Bigger Spenders Read Review Content in More Detail

Interestingly, the greater the monthly online spend of a shopper, the more likely they are to dive deep into review content. 62% of shoppers who spend $2,001+ per month always go beyond basic review information to read the content of reviews, compared to 41% of those who spend $1-$250 per month. 

The Higher the Monthly Online Spend, the Greater the Percentage of Shoppers Who Always Read Review Content
When you read product reviews, how often do you look beyond the basic information (i.e. review volume count, review date and average star rating) to dig deeper and read the actual review content?
Average monthly spend: $0
Always
24%
Regularly
32%
Sometimes
35%
Never
9%
Average monthly spend: $1-$250
Always
40%
Regularly
44%
Sometimes
15%
Never
1%
Average monthly spend: $251-$500
Always
50%
Regularly
41%
Sometimes
8%
Never
1%
Average monthly spend: $501-$1,000
Always
54%
Regularly
40%
Sometimes
5%
Never
1%
Average monthly spend: $1,001-$2,000
Always
56%
Regularly
37%
Sometimes
6%
Never
1%
Average monthly spend: $2,000+
Always
62%
Regularly
30%
Sometimes
7%
Never
1%

Consumers Search for Wide Range of Information in Review Content

The vast majority of consumers dig deeper than the basics to read the actual content of reviews. But why? 

The top reason is to learn about negative experiences other consumers have had with a given product – so they can determine whether they can live with this “worst case scenario.” 84% of consumers indicate this is a reason they read the content of reviews.

78% of shoppers read reviews to ensure a product has been used in the same way they intend to use it, and 73% consume this content to check that the product performs as claimed by the manufacturing brand. 

Other top reasons for reading reviews are to get sizing information when shopping for clothing and shoes (70%), gauge long-term durability (64%), find photos of the product being used by a real-life shopper (57%), and determine value for money (57%).

Those Who Read Reviews do so to get Feedback on Many Topics
When you read reviews, what specifically are you looking for in the content of the reviews themselves?
To learn about bad experiences reported with the product
84%
That the product has been used in the same way I intend to use it
78%
To check the product performs as claimed by the manufacturing brand
73%
Sizing information (when shopping for clothing and shoes)
70%
Long-term durability
64%
Imagery or photos of the product from a real-life shopper
57%
To assess value for money
57%
That the review comes from someone who has used the product more than once
53%
That the person who writes the review is similar to me
22%

Consumers Value Various Review Details

A given review might include many details, including a title, written commentary, demographic information of the reviewer, and user-submitted visual content – among other things. Which of these details do shoppers value most?

Consumers place the highest value on visual content within reviews; 65% of shoppers indicate this content is useful. 59% of shoppers value longer, more descriptive reviews and 57% appreciate stories that relate to how they plan to use a given product. Here’s the full breakdown:

Consumers Value Many Aspects of Individual Reviews
Which of the following types of detail included within individual reviews do you find useful or would find useful when reading them?
A picture/image of the product from someone who has used it
65%
Longer, more descriptive reviews
59%
Stories and accounts that relate to and are consistent with how you intend to use the product
57%
Aggregated pros and cons pulled from all the reviews submitted
54%
“Most positive review” vs “most negative review” pulled from all reviews submitted
45%
The tag/badge signifying how the reviewer obtained the product
42%
A video of the product from someone who has used it
36%
Demographic profile information
19%
Longer, more descriptive title
17%
Chapter 4

Shoppers Want Ratings AND Reviews

Star ratings are one indicator of quality. But ratings only tell one part of the story. Modern consumers want to understand the “why” behind a specific rating. 

Ratings Alone Aren’t as Valuable as Reviews

Today, some retailers, including Amazon, allow shoppers to submit a star rating for a product – without an accompanying written review. This is a quick process, and there’s no doubt it enables retailers to amass a high volume of ratings quickly. 

Our previous research found that star ratings are one of the top factors consumers consider when reading reviews. But our most recent survey found that on their own, they’re often not enough. 58% of consumers indicate a star rating alone isn’t as valuable as a star rating accompanied by a written review.

Standalone Ratings aren’t as Valuable as Ratings Accompanied by Reviews
Increasingly, retailers like Amazon are enabling consumers to leave star ratings on a product without requiring them to write an accompanying review to go with it. Do you find this content as valuable as ratings accompanied by reviews?
Yes
42%
No
58%

A lack of written reviews to accompany star ratings is especially detrimental when a consumer is considering a new product or brand. Over half (55%) of consumers indicate they’d be less likely to buy a new (or new to them) product or brand if there were star ratings – but no written reviews alongside those ratings. 

This isn’t surprising. Consumers take a risk when purchasing a product or brand they have no experience with. Star ratings can certainly help boost their confidence. However, the real value lies in being able to read about the experiences of other consumers who have purchased and used the product.

Half of Consumers are Less Likely to Purchase a New Product/Brand if There are Only Ratings Available (and no Reviews)
Specifically for a product/brand you have never purchased before, would having only ratings available (as opposed to ratings & accompanying review content) make you LESS or MORE likely to purchase? Assume there are no reviews accompanying these ratings at all.
Overall
Boomers
Gen X
Millennials
Gen Z

Of note, younger consumers are more likely to be deterred by a lack of written reviews to accompany star ratings. 64% of Gen Z shoppers and 59% of Millennials are less likely to buy a new (or new to them) product if there aren’t written reviews to accompany ratings. In comparison, 53% of Gen X consumers and 54% of Boomers say this is the case.

Allowing consumers to submit ratings only can certainly increase your volume quickly – and this undoubtedly has some value. However, you should always aim to also collect written reviews too. Consumers value this content – especially when they’re branching out to new products and brands.

Chapter 5

Review Length is a Key Consideration

It’s easy to assume that longer, more detailed reviews are more helpful than shorter ones. For example, a review that simply reads “great toy!” isn’t as helpful as one that elaborates on the great features of that toy – and why it is (or isn’t) a great fit for a specific type of child. 

But how often do consumers pay attention to review length? And are there certain circumstances when length is especially important? 

Review Length Matters

Nearly all consumers – 97% – actively seek out longer, more detailed reviews; 68% always or regularly do so. 

Review length and detail is especially important for younger shoppers. 81% of Gen Z’ers and 73% of Millennials always or regularly seek out reviews that are longer in length and contain more details. In comparison, 68% of Gen X’ers and 64% of Boomers seek out longer, more detailed reviews.

Consumers Seek Out Long, Detailed Reviews
When you read reviews, how often do you actively seek out reviews that are longer in length and contain more detail?
Overall
Boomers
Gen X
Millennials
Gen Z

In addition, the greater a consumer’s average online monthly spend, the more likely they are to always seek out longer, more detailed reviews. 39% of consumers who spend more than $2,001 online per month always seek out long, detailed reviews, compared to 25% of shoppers who spend $1-$250 online per month. 

Consumers Who Spend More Online are More Likely to Always Seek Out Long, Detailed Reviews
When you read reviews, how often do you actively seek out reviews that are longer in length and contain more detail?
Average monthly spend: $0
Always
24%
Regularly
32%
Sometimes
35%
Never
9%
Average monthly spend: $1-$250
Always
40%
Regularly
44%
Sometimes
15%
Never
1%
Average monthly spend: $251-$500
Always
50%
Regularly
41%
Sometimes
8%
Never
1%
Average monthly spend: $501-$1,000
Always
54%
Regularly
40%
Sometimes
5%
Never
1%
Average monthly spend: $1,001-$2,000
Always
56%
Regularly
37%
Sometimes
6%
Never
1%
Average monthly spend: $2,000+
Always
62%
Regularly
30%
Sometimes
7%
Never
1%

Consumers of all ages and spending levels are actively seeking out longer, more detailed reviews. And the presence of more detailed content helps them make better purchase decisions. Consider including prompts in your write-a-review form that encourage shoppers to include plenty of details in their reviews.

Review Length Matters Across Product Categories

Just about all consumers seek out longer, more detailed reviews. But does longer content matter more for certain product categories?

Length matters across a wide array of categories. However, there are certain categories where lengthy reviews are more commonly sought after.

Consumer electronics and appliances is the category that tops the list; 86% of consumers seek out longer, more detailed review content when purchasing these types of products. This makes perfect sense.

Electronics and appliances are typically higher priced items, and there’s risk involved with purchasing an expensive item. Reading detailed reviews helps those shopping for appliances and electronics understand how a given product has worked for real people. Then, they can better determine if the product is a good fit for them.

Other categories where review length is particularly important include health and beauty (73%), clothing, shoes, and accessories (71%) and home decor/home improvement (67%). It’s not surprising; products in these three categories are highly personal.

Consumers want to ensure a given product has worked well for others like them. For example, a consumer shopping for face cleanser wants to be sure a certain product works well for others with a similar skin type. And a consumer shopping for furniture may seek out detailed reviews for a dresser to ensure others have used it in a similar manner: for a nursery in a small apartment. 

While longer reviews are particularly important for certain product categories, it’s important to note that a significant portion of consumers seek out more detailed review content across all product categories. Be sure your shoppers can find detailed reviews, regardless of product category.

Consumers Who Spend More Online are More Likely to Always Seek Out Long, Detailed Reviews
When you read reviews, how often do you actively seek out reviews that are longer in length and contain more detail?
Consumer electronics/appliances
86%
Health and beauty
73%
Clothing, shoes and accessories
71%
Home decor and home improvement
67%
Pet
42%
Toys
38%
Baby
28%
Perishable products/groceries
27%
Dry goods/CPG (ie snacks, cereal, pantry)
26%
Chapter 6

Poor Grammar Can Impact Trust

We know from previous research that nearly a third (32%) of consumers consider grammar and spelling when reading a review. How does poor grammar impact review quality? 

Poor Grammar Negatively Impacts Trust

Just over half (54%) of consumers say that incorrect grammar, punctuation or spelling causes them to question the validity of a review. Of note, older shoppers are more likely to find poor grammar a cause for concern. 57% of Boomers and 56% of Gen X’ers indicate that incorrect grammar, punctuation or spelling causes them to question the validity of a review, compared to 50% of both Millennials and Gen Z shoppers.

Poor Grammar Can Be a Cause for Concern
Does incorrect grammar, punctuation, or spelling cause you to question the validity of a review?
Overall
54%
Boomers
57%
Gen X
56%
Millennials
50%
Gen Z
50%

It’s important to remember that consumers value reviews because they offer authentic third-party guidance. An isolated spelling error isn’t going to have much of an impact, and in fact can even help promote the concept of authenticity. But too many grammatical issues is likely to have the opposite effect.

Chapter 7

User-Generated Imagery Is Now Essential

Many brands and retailers allow consumers to submit photos or videos as part of a review. And as we mentioned previously, 57% of shoppers specifically seek out visual content submitted by other consumers within individual reviews.

But how often do consumers seek out user-generated visual content in reviews? And how does the presence (or absence) of this content in reviews impact purchase behavior? 

Most Consumers Seek out Visual Content within Reviews

Visual content – including photos and videos – can help consumers understand product features in a way text alone can’t. This is especially true when that visual content was taken by a real customer in real-life situations. User-generated content is authentic in a way brand content is not, and shoppers value it. 

In fact, the majority of consumers – 94% – seek out visual content within reviews at least sometimes. 58% do so always or regularly. 

Of note, younger shoppers are more likely to always seek out visual content in reviews, when compared to older shoppers. Nearly half (48%) of Gen Z’ers always seek out user-generated visual content in reviews and 35% of Millennials do so. In comparison, 20% of Gen X’ers and 12% of Boomers always seek out imagery within review content.

Consumers Frequently Seek Out User-Generated Visual Content in Reviews
How often do you seek out imagery/photos within review content?
Overall
Boomers
Gen X
Millennials
Gen Z

In addition, a higher monthly spend is correlated with an increased frequency of seeking out user-generated visual content. 35% of consumers who spend $2,000+ online each month always seek out visual content within reviews, compared to 20% of those who spend $250 or less monthly.

Consumers Who Spend More Online are More Likely to Always Seek Out Visual Content within Reviews
How often do you seek out imagery/photos within review content?
Average monthly spend: $0
Always
10%
Regularly
25%
Sometimes
44%
Never
21%
Average monthly spend: $1-$250
Always
20%
Regularly
32%
Sometimes
40%
Never
8%
Average monthly spend: $251-$500
Always
27%
Regularly
37%
Sometimes
32%
Never
4%
Average monthly spend: $501-$1,000
Always
26%
Regularly
37%
Sometimes
32%
Never
5%
Average monthly spend: $1,001-$2,000
Always
30%
Regularly
35%
Sometimes
32%
Never
3%
Average monthly spend: $2,000+
Always
35%
Regularly
32%
Sometimes
26%
Never
7%

The presence of authentic, user-generated visual content adds to the quality of a given review, and consumers of all ages and spending levels actively seek it out. Make it easy for your customers to submit photos or videos of your products “in the wild” – right alongside their written reviews. 

User-Generated Visual Content Matters Across Product Categories

Clearly, consumers seek out user-generated visual content within reviews. But are there certain circumstances when this content is particularly important?

As it turns out, consumers find it useful to find “real life” photos and videos across many product categories. However, there are some categories for which this content is particularly important.

Consumers Seek Out User-Generated Imagery for Many Product Types
Which of the following types of products do you seek or have you sought out imagery submitted by people who have bought the product?
Clothing, shoes, accessories
76%
Home decor, home improvement
67%
Consumer electronics and appliances
64%
Health and beauty
56%
Toys
34%
Pet
32%
Baby
26%
Dry goods, CPG
18%
Perishable products, grocery
18%

The Absence of User-Generated Visual Content Can Deter Some Shoppers

We know the majority of shoppers actively seek out user-generated visual content in reviews. What happens when they come up short?

12% of consumers indicate that if they can’t find photos of a product submitted by fellow consumers, they simply won’t buy it. This number is significantly higher – 24% – among Gen Z shoppers. 

Younger Shoppers are More Likely to Steer Clear of Products without User-Generated Content
If there is no imagery/photos from people who previously bought a product when browsing online, would you still buy it?
Overall
88%
Boomers
87%
Gen X
89%
Millennials
86%
Gen Z
76%

Although the absence of user-generated visual content won’t deter the majority of shoppers according to these numbers, its presence is proven to boost conversion. Our analysis of activity on 1.5MM online product pages from more than 1,200 brand and retailer sites found that there’s a 91.4% lift in conversion among site visitors who interact with user-generated photos and videos on a product page.

There’s a 91.4% lift in conversion among site visitors who interact with user generated photos and videos on a product page.

So if you’re not collecting and displaying visual content from your shoppers, you’re leaving money on the table. 

Chapter 8

How Consumers Engage with Reviews to Surface Relevant Content

Most shoppers go beyond the basics and consume the actual content of reviews. And as we’ve explored, they do so to find many different types of information. 

However, consumers don’t read every single review available for a product to find what they need. Instead, they sift through reviews to find the content that’s most relevant to them. 

How do consumers navigate review displays to find what they’re looking for? Let’s explore. 

The Review Snapshot is a Jumping Off Point

Often, product pages on brand and retailer sites feature a display that summarizes all review content available for a given product. At a minimum, such a display typically includes the number of reviews available for a given product – as well as the overall star rating.

Sometimes, however, a display also pulls out specific trends and themes from reviews to give shoppers a snapshot of what they can expect from a given product.

Crocs product pages feature interactive image galleries and searchable reviews, along with specific ratings related to key words

When there are specific trends and themes pulled out of the review content as part of a review snapshot, 98% of consumers read it at least sometimes. 70% do so regularly or always. 

Gen Z shoppers are the group most likely to always interact with review snapshots that pull out common themes from reviews, if such a snapshot is available. 35% of Gen Z’ers always do so, compared to 26% of Millennials, 21% of Gen X’ers, and 20% of Boomers.

Shoppers Interact with Review Snapshots
If there are specific common trends and themes pulled out of the review content as part of the overall review display, how often do you read this for extra/more detailed information (examples may include pros/cons or more info on size or color)?
Overall
Boomers
Gen X
Millennials
Gen Z

If you’re not already, consider enhancing your overall review display to pull out trends from feedback shared in reviews. Consumers across age groups read these snapshots – and their presence can entice shoppers to learn more about a product. 

Most Consumers Filter Review Content

Some brands and retailers provide shoppers with the ability to filter reviews to quickly surface relevant content. For example, a health and beauty brand might allow shoppers to filter reviews by factors like skin type, age, skin tone, and whether the review includes visual content. 

Over three-quarters (77%) of shoppers find filtering options useful when browsing review content. This number is even higher among younger consumers. 86% of Gen Z’ers and 85% of Millennials think review filtering is useful. In comparison, 77% of Gen X’ers and 66% of Boomers find this capability useful.

The Majority of Consumers Value the Ability to Filter Reviews
Do you or would you find a filter option useful when browsing review content (e.g. to filter on a specific star rating etc.)?
Overall
77%
Boomers
66%
Gen X
77%
Millennials
85%
Gen Z
86%

Consumers Seek Out Negative Review Content

As we mentioned earlier, a top reason consumers read the content of reviews is to learn about negative experiences fellow consumers have had with a product – and then determine whether they can live with those “worst case scenarios.” 

How do they uncover these worst case scenarios? By reading negative reviews. In fact, 61% of consumers actively seek out one star reviews when consuming review content. 

Finding one-star reviews is especially important for younger consumers. 73% of Gen Z shoppers and 68% of Millennials seek out one-star reviews, compared to 59% of Gen X’ers and 53% of Boomers.

Consumers Across Generations Seek Out One-Star Reviews
Do you explicitly seek out 1-star reviews when searching review content?
Overall
61%
Boomers
53%
Gen X
59%
Millennials
68%
Gen Z
73%

In addition, those who spend more online are more likely to seek out one-star reviews. 71% of shoppers who spend $2,001 or more each month explicitly seek out one-star reviews, compared to 57% of those who spend between $1 and $250 monthly. 

Consumers Who Spend More Online are More Likely to Seek Out One-Star Reviews
Do you explicitly seek out 1-star reviews when searching review content?
Average monthly spend: $0
42%
Average monthly spend: $1-$250
57%
Average monthly spend: $251-$500
65%
Average monthly spend: $501-$1,000
65%
Average monthly spend: $1,000-$2,000
71%
Average monthly spend: $2,001+
71%

Consumers value negative reviews. If they’re not able to find any, it can raise their suspicions. In fact, 42% indicate they’re suspicious when a product has an average rating of five out of five. This number is even higher – 48% – among Gen Z consumers.

A Perfect Average Star Rating Raises Red Flags for Some Shoppers
Are you suspicious when you see a product has an average rating of 5 out of 5?
Overall
42%
Boomers
40%
Gen X
41%
Millennials
43%
Gen Z
48%

When it comes to reviews: if it looks too good to be true, it probably is too good to be true. Even the very best products can’t satisfy the needs of every single shopper, and consumers know it. Failing to display negative reviews for a product can make shoppers suspicious that you have something to hide. Again, authenticity is key.

Resist the temptation to delete negative reviews. This content helps shoppers make informed purchase decisions – and it shows them you’re a brand they can trust.

Helpful Votes are Valuable to Shoppers

Many brands and retailers give shoppers the ability to indicate when a review is helpful to them. For example, our friends at Ulta allow visitors to click a thumbs up icon to indicate a review was helpful in their purchase journey.

These same brands and retailers often let shoppers sort review content by helpfulness, which displays the content with the most helpful tags or votes at the top. 

Allowing shoppers to easily find reviews that their peers found helpful is a good move on the part of businesses. After all, 55% of consumers actively seek out reviews that have been voted or tagged as “helpful” by other shoppers. This number is significantly higher – 73% – among Gen Z shoppers. 

Shoppers Seek Out Reviews Voted as Helpful by Their Peers
Do you actively seek out reviews that have been voted or tagged as “helpful” by other shoppers?
Overall
55%
Boomers
55%
Gen X
52%
Millennials
59%
Gen Z
73%

Consider giving your site visitors the opportunity to indicate when a review was particularly helpful to them. This information will help future shoppers find the content they’re looking for – and make better purchase decisions. 

Search Features Enable Shoppers to Quickly Surface Relevant Review Content

Many customer-centric brands include a search feature on their review displays that allows shoppers to find reviews that speak to the things that matter most to them in their product search. For example, a consumer with sensitive skin may be considering a moisturizer. She wants to find out how the product has worked for others with a similar skin type. So she searches for “sensitive” and finds reviews written by others with sensitive skin. 
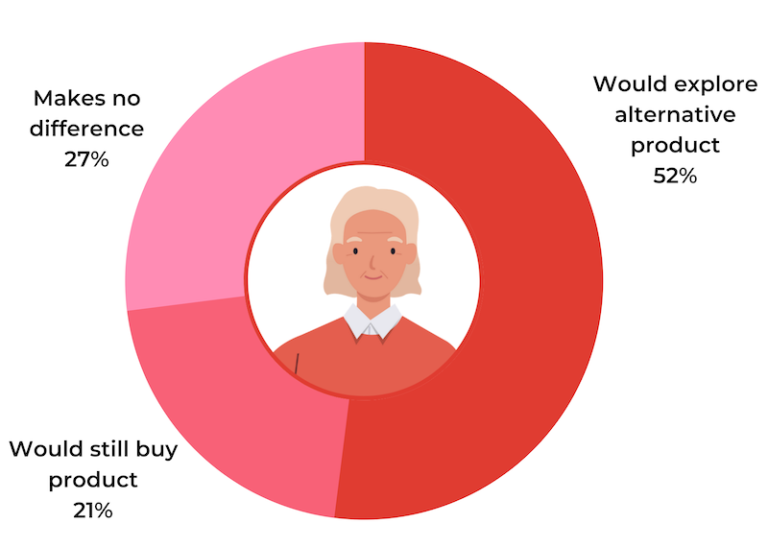
As it turns out, consumers appreciate the ability to easily search reviews for specific words or phrases. Nearly three-quarters (72%) find a search option useful when browsing review content. This number is especially high – 79% – among Gen Z and Millennial shoppers. 

Consumers Find a Review Search Option to be Useful
Do you find a search option useful when browsing review content (i.e. to enable you to search review content for a specific word or phrase)?
Overall
72%
Boomers
63%
Gen X
72%
Millennials
79%
Gen Z
79%

In addition, consumers who spend more online each month are more likely to value a review search option than those with lower monthly spending. 83% of those spending $2,001+ each month find a search feature useful, compared to 68% of consumers who spend $1-$250 monthly. 

Higher Spending Consumers are More Likely to Find a Review Search Option Useful
Do you find a search option useful when browsing review content (i.e. to enable you to search review content for a specific word or phrase)?
Average monthly spend: $0
49%
Average monthly spend: $1-$250
68%
Average monthly spend: $251-$500
76%
Average monthly spend: $501-$1,000
77%
Average monthly spend: $1,000-$2,000
81%
Average monthly spend: $2,001+
83%

A large portion of consumers find a review search feature useful. But how often do they actually use it, when it’s available? 

Nine in ten shoppers indicate they use a search option to search review content at least sometimes. And over half (56%) do so regularly or always. 

Interestingly, younger shoppers are more likely to always leverage the review search feature, when it’s available. 29% of Gen Z’ers and 20% of Millennials always use the search option to find more detailed information when reading reviews, compared to 16% of Gen X’ers and 13% of Boomers.

Shoppers Frequently Leverage the Review Search Feature, When it’s Available
If there’s a search option available to search review content, how often do you use it for extra/more detailed information (examples may include specific use cases or more info on size or color)?
Overall
Boomers
Gen X
Millennials
Gen Z

Clearly, shoppers are fans of the search feature of review displays. But what are some of the topics they’re searching for?

Product sizing and quality are two of the most common types of queries.

Shoppers Use Review Search to Surface Information on Many Topics
If there is a search option available, which of the following are examples of things you have, or would, search?
Size/dimensions of a product (i.e. for furniture, clothing, etc.)
74%
Quality
74%
Fit (clothing only)
70%
Specific feature or characteristic
67%
Color
34%

Consumers have grown accustomed to turning to Google to search for anything to quickly get relevant results. They want to be able to do the same thing with reviews.

If you’re not already, consider adding a search feature to your review display. It’ll make it easy for your shoppers to find the content more relevant to their needs – and it’ll boost conversion. Our recent analysis found that there’s a 202.9% conversion lift when visitors use the search feature in a review display!

The Source of a Review Impacts a Shoppers’ Perception of the Content

Product reviews come as a result of a handful of different interactions. For example, some purchase the product themselves while others may receive a product for free as part of a product sampling campaign. In order to maintain transparency and preserve trust, brands and retailers often add badges or tags to indicate who wrote a given review.

For example, it’s clear this review was written by someone who is verified as having purchased the product.

While the consumer who submitted this review is a verified buyer – and received an entry into a sweepstakes in exchange for their review.

87% of shoppers take note of these badges. And certain tags positively impact how shoppers perceive a given review.

Verified Buyer and Reviewer Badges Positively Impact Perception
Which of the following tags, if any, on review content POSITIVELY impact how you perceive that review content?
Verified buyer
63%
Verified reviewer
48%
Review submitted as part of a sampling campaign
29%
Review submitted as part of a sweepstakes campaign
12%
Staff reviewer
11%

For the sake of transparency, be sure to appropriately badge reviews. Doing so is an important way to preserve trust – and it can actually boost shoppers’ confidence in your review content.

Chapter 9

Five Key Takeaways

Consumers read the content and details of reviews. And they look for many things when they do. It’s essential to make it as easy as possible for your shoppers to find what they’re looking for. If you don’t, they’re likely to pass up your brand for one that better meets their needs and expectations. 

Here are our top five takeaways from our latest survey.

One
Consumers Dive Deep into Review Content

Star ratings are a great starting point. But for most shoppers, they’re simply not enough. 
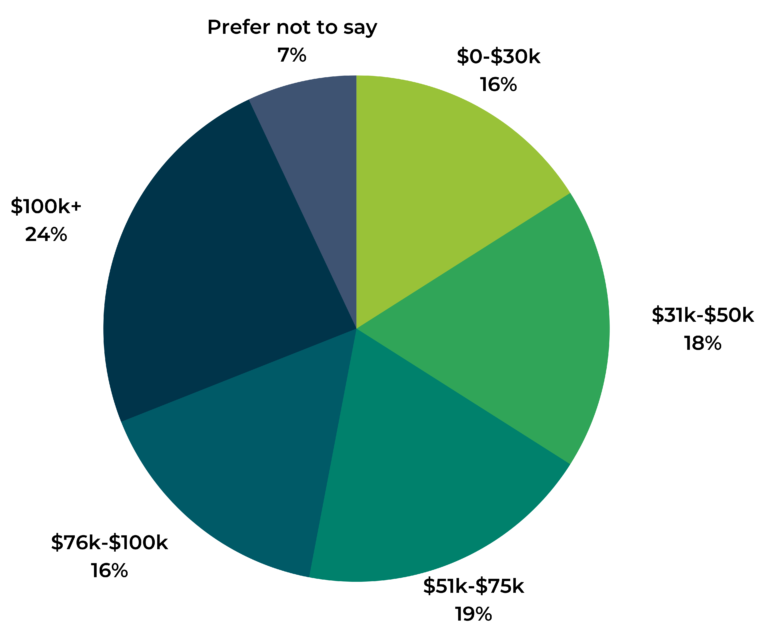
In fact, the vast majority of consumers – 99% – go beyond the basics and read the content of reviews. And 97% explicitly seek out longer, more detailed reviews. 
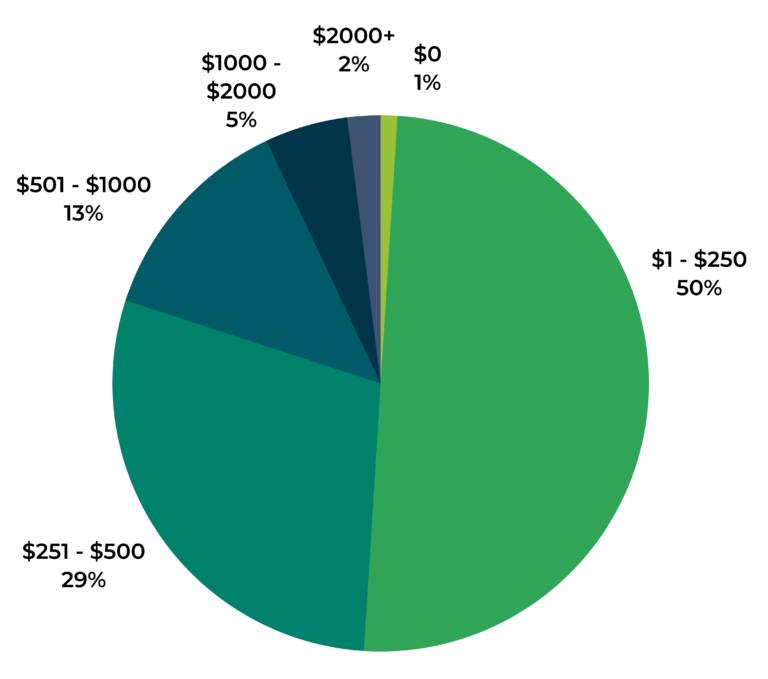
Of course, generating reviews is important. But make sure you’re getting plenty of detailed reviews. One way to do this is to add a review meter to your write-a-review form, which is essentially a green bar that grows as the consumer types. Some brands also include text letting shoppers know the length of the most helpful reviews.

In addition, consider including prompts in your write-a-review form that can help shoppers go beyond the basics – and get their creative juices flowing. For example, this form encourages review writers to include commentary about how they use the product, what they love about it, and what isn’t so great.

When asking for reviews post purchase, be sure to time the ask appropriately. You need to strike the balance between allowing shoppers the time to use the product sufficiently while being close enough to the purchase for it to be fresh in their mind. Here are some tips.

Two
User-Generated Visual Content is Incredibly Valuable to Shoppers

A top reason shoppers seek out reviews is to find photos from others like them, using the product in real life. What’s more, 94% seek out visual content within reviews at least sometimes. 

Be sure shoppers can find ample user-generated visual content. If you’re not already, start collecting photos and videos as part of your review generation processes. Shoppers should be able to submit imagery directly from their desktop, mobile device, or social media accounts. 

In addition, experiment to see if asking for photos and videos before or after a written review generates the best results. And, if visual content is a top priority, consider allowing shoppers to submit this content without an accompanying review.

Three
The Review Snapshot is the Launching Point for Many Shoppers

The review overview – or snapshot – is a shopper’s first exposure to review content on a product page. Some snapshots are basic, including simply an overall star rating and review content. However, others are more detailed, pulling out specific trends and themes from the review content itself.

When there’s a more detailed snapshot, 98% read it at least sometimes. And a detailed snapshot can entice shoppers to dig more into the content of reviews.

Consider enhancing your review snapshot to pull out trends from feedback shared in reviews, specific to your product category. This information can help shoppers determine if they should dig further – or take their search in a different direction.

For example, if you’re a clothing brand, you can pull in themes about size and fit.

And regardless of product type, you can pull in pros and cons, aggregated from reviews. 

Four
Consumers Sift Through Content to Find What’s Most Relevant to Them

Shoppers read the content of reviews to find feedback on many topics, including negative experiences, use cases, and quality – among others. But they’re not reading every single review that’s available. Instead, they use a variety of features and capabilities (when they’re available) to surface the content that’s most relevant to them.

Make it as easy as possible for shoppers to find what they’re looking for in reviews. For starters, allow them to filter content based on star rating; 61% of shoppers actively seek out one-star reviews. In addition, enable shoppers to filter content based on other factors that make sense for your brand. For example, this coffee brand allows site visitors to filter reviews based on whether the consumer who wrote the review typically drinks hot or iced coffee. 

In addition, add a search feature to your review display, allowing shoppers to easily uncover reviews that address the words and phrases they search for. Nearly three-quarters (72%) of shoppers (and 79% of Millennials and Gen Z’ers) find a search option to be useful when browsing reviews. 

Five
Ongoing Measurement and Optimization is Essential

Best practices are a great place to start when you’re looking to accelerate your review collection and create compelling UGC displays (here are some aggregated examples). However, each business is different. And there’s no one-size-fits-all strategy that works for all brands and retailers.

It’s essential to regularly measure the performance of your UGC program – both from a collection and display perceptive. With regular measurement, you can uncover opportunities to optimize your program – and yield even better results. 

Let’s just cut to the chase: reviews are important.

But how important? 

Super important. Our recent survey of more than 6,500 online shoppers found that 99.9% read reviews at least sometimes; 57% do so when shopping in brick-and-mortar stores.

How Often Online Shoppers Read Reviews

In fact, reviews have grown to be the most important factor impacting purchase decisions, surpassing other important factors including price and free shipping. 

How many reviews is enough?

The power of reviews (see what we just did there?) is abundantly clear. By now, the majority of brands and retailers recognize the value of this content – and have started to collect and display reviews. Those that do are rewarded with more traffic, more conversion and sales, and a load of insights to improve products and customer experiences. 

But one of the most common questions we get is, “How many reviews do I need?”

The easy answer is, as many as possible. Think of reviews like cookies or cat videos. You can never have too many!

(above) Me searching for highly-rated cat videos.

But let’s be real: a vague answer like “as many as possible” isn’t exactly helpful when you’re determining your review generation goals. Sure, one is better than none. But what number will ensure you achieve maximum ROI from your efforts? 

Spoiler alert: there’s no one “magic” number of reviews to shoot for. That’s because the ideal number of reviews depends on a variety of factors, including product category and type, among others. 

Read on as we take a deep dive into how many reviews you need – as well as some tips for generating more of this conversion-boosting content. 

No Reviews = No Good

Let’s start by considering the worst case scenario. A shopper is considering a product, and it has no (zero, zilch, zip) reviews. What happens next? 

The answer here is obvious: the shopper is less likely to buy it. And our most recent research backs this claim. A staggering 80% of consumers indicate they’re less likely to buy a given product if it has no reviews. This number is even higher among Millennial and Gen Z shoppers.

Impact of No Reviews on Purchase Likelihood
If there are no ratings and reviews for a product, would you be less likely to buy it?
Overall
80%
Boomers
70%
Gen X
78%
Millennials
86%
Gen Z
90%

In case you need further proof that a lack of reviews deters shoppers (and sinks conversion rates), a previous survey found that 44% flat out won’t buy a product without reviews. Again, this number is even higher among younger shoppers. 49% of Gen Z’ers and 48% of Millennials will abandon a purchase if there are no reviews. 

If you’re not generating any reviews, you’re most assuredly losing prospective customers – and leaving a ton of money on the table. So what are you waiting for?

Having Some Reviews is Better Than Having None at All

Consumers depend on reviews, and a lack of them can hurt conversion rates. But if you’re just getting started with reviews, it can seem overwhelming to generate a high volume across your entire catalog.

Well, take comfort in the fact that generating even a few reviews is going to have a positive impact on conversion. Recently, we analyzed activity across 1.5MM+ ecommerce product pages on 1,200 brand and retailer sites and found there’s a 76.7% lift in conversion when visitors are exposed to at least one review, compared to those exposed to none.

Conversion Lift Relative to Number of Reviews Displayed
If there are no ratings and reviews for a product, would you be less likely to buy it?
0 Reviews
0%
1-100 Reviews
76.7%

Why the conversion lift? Because reading even a single review helps boost shopper confidence. And confident shoppers are more likely to convert. 

Consider a consumer shopping online for a new sofa. They don’t have the luxury of trying out their options prior to making a purchase. Of course, they read product descriptions and check out brand-supplied imagery to narrow down their options.

But the purpose of this content is to portray the product in the best light, and the consumer is concerned the product won’t live up to the hype. So they’re hesitant to buy it. As a next step, they seek out feedback from others like them by reading reviews.

Once they read reviews, they’re able to determine that other consumers find this option to be good quality and comfortable. So they confidently make the purchase.

Conversion rates increase when shoppers are exposed to even a single review. So does this mean you can generate just one review for each of your product catalogs and then call it a day? Not quite – if you want to see the largest ROI. 

More Reviews = More Impact on Conversion

OK, so we know consumers actively seek out reviews – and that even a single review can boost conversion.

But do shoppers care about the number of reviews available for a given product? And does quantity have an impact on conversion?

Consumers Pay Attention to Review Quantity

First things first: review quantity does indeed matter to shoppers. Our research found that 99% of consumers pay attention to the number of reviews available for a product, at least to some extent. 

So, how many reviews do shoppers want? In an ideal world, 43% indicate a given product should have more than 100 reviews.

Consumers Review Volume Expectations
What is the IDEAL number of reviews a product should have in your opinion?

However, consumers tell us that an especially high volume of reviews can have a big (and positive) impact on their likelihood of making a purchase. 64% of those we surveyed said they’re more likely to buy a product if it has 1,000+ reviews than if it has 100. And 54% are more likely to buy a product if it has 10,000+ reviews than if it has 1,000. 

A High Volume of Reviews Means Higher Conversion

Sure, shoppers say quantity matters. But does the volume of reviews actually impact the metric that matters most: conversion? In other words, is it worth the effort to continue to collect reviews, even after you’ve generated a decent amount across your catalog? 

Absolutely! Our analysis found that the more reviews a shopper is exposed to, the greater the impact on conversion. And the greatest impact is seen when the shopper is exposed to 5,000 or more reviews. 

Take a look at the chart below and you’ll see there’s a nearly 3X conversion lift when shoppers are exposed to 5,000+ reviews, compared to those exposed to none.

Conversion Lift Relative to Number of Reviews Displayed
0 Reviews Displayed
0%
1-100 Reviews Displayed
76.7%
101-250 Reviews Displayed
143.2%
251-500 Reviews Displayed
166.4%
501-1000 Reviews Displayed
172.1%
1001-5000 Reviews Displayed
224.7%
5000+ Reviews Displayed
292.6%

But how does the conversion rate of those exposed to 5,000+ reviews compare to those exposed to a much smaller volume (1-100) of reviews?

Again, this is a case of the more reviews, the merrier. There’s a 122.1% conversion lift among shoppers exposed to 5,000 or more reviews, compared to those exposed to between one and 100 reviews.

Conversion Lift Relative to Number of Reviews Displayed
1-100 Reviews Displayed
0%
101-250 Reviews Displayed
37.6%
251-500 Reviews Displayed
50.7%
501-1000 Reviews Displayed
54%
1001-5000 Reviews Displayed
83.7%
5000+ Reviews Displayed
122.1%

While More is More, But There’s No One-Size-Fits All “Ideal” Number of Reviews

When it comes to reviews, the general rule is “more is more.” You are not going to maximize potential sales without a healthy review presence.

However, it’s important to remember that the right number of reviews for achieving maximum ROI depends on a variety of factors.

These factors include product category (think toys vs apparel), product type (think new vs. older product), and sales channel – among many others.

For example, a shopper will likely pay more attention to review volume when purchasing a new (or new to them) product than they will when they buy a habitual product.

The resources you have at your disposal will also obviously have an impact. The more resources you have (be this budget, people or whatever), the more you’ll be able to focus on collecting reviews in higher volumes, quicker.

What’s important is that you make review collection a priority and then set realistic goals for you – whatever these may look like.

Perhaps you might want to analyze the review presence of your competitors, or maybe you want to take a look at norms on your main retail or marketplace sites. What would showing up where it’d be most impactful for you actually take?

Once you’ve figured out realistic but challenging targets, you’ll want to tap into some common tactics for achieving them…

6 Practical Pointers for Generating a High Volume of Reviews

When it comes to reviews, quantity matters – a lot. Consumers pay attention to the number of reviews available for a product, and a high volume is proven to have a large, positive impact on conversion. 

Of course, there’s no magic “one size fits all” recommendation of how many reviews you should have for your products. But one thing is clear: more is more. 

How can you generate a high volume of reviews that satisfies shoppers – and helps you achieve the biggest lift in conversion? Here are 6 tips.

1. Send Post Purchase Emails

A lot of shoppers are happy to write reviews – but they need to be asked to do so. The most effective way to do that is to send a post purchase email, asking them to review their recent purchases. In fact, research tells us that up to 90% of reviews are the result of a post purchase email.

Use a compelling subject line to entice shoppers to open the email. And be sure the email is easy to read from any device – with a clear call to action.

In addition, don’t give up if your first attempt doesn’t result in a review. Nearly a third of consumers (32%) say they need to be asked at least twice before they’ll contribute a review; be sure to send at least two post purchase emails.

Number of times consumers need to be asked for a rating/review

2. Employ a User-Friendly Write a Review Form

If a shopper runs into any trouble when submitting a review, they’re likely to abandon the process altogether. 

Simple and intuitive is the name of the game here. Make sure the entire process for writing a review is easy to complete from any device. And make it easy for shoppers to write reviews for multiple products from a single page, rather than navigating to a different page for each review. 

Crocs allows reviewers to click existing options for pros/cons, demographic information, and size/fit, or even add their own in order to generate detailed reviews with minimal effort.

3. Collect Reviews from Online and In-Store Shoppers Across Channels

Collecting reviews from your own direct-to-consumer channel is important. But your products are likely being purchased via retailers and marketplaces, too. So make sure you’re collecting reviews from online and in-store shoppers, regardless of where they buy your products.

One powerful way to do that is to leverage purchase history data from retailers and marketplaces that sell your products. By doing so, you can generate more verified reviews from real customers. 

For example, “Receipt. Review. Collect.” allows brands to tap into receipt uploads from 12 million consumers across multiple retailers and marketplaces to generate a steady stream of reviews from verified buyers. Tom’s of Maine, a personal care brand, was able to grow their review volume by 18,600% in just 21 days as a result of “Receipt. Review. Collect” program. Learn more about how it works.

4. Offer an Incentive

For some shoppers, a great experience is enough of a motivator to write a review. But sweetening the deal with the right incentive can increase the volume of reviews you collect. After all, a recent survey found that nearly three-quarters (73%) of consumers indicate they’d be motivated to write a review if they were offered an incentive in return.

There are a number of different incentives that can help boost the volume of reviews you collect – including loyalty points and entry into a sweepstakes. But one stands above the others: free samples. 

91% of consumers say they’d be motivated to write a review if they received a product free of charge. What’s more, we’ve found that brands and retailers that partner with PowerReviews experience an average response rate of 86%. In other words, 86% of those who receive a free sample go on to write a review. Clearly, product sampling can be a great way to generate a high volume of reviews – quickly. 

Incentives Leading to Review Submission
If there are no ratings and reviews for a product, would you be less likely to buy it?
Loyalty points with store or brand
59%
Discounts with store or brand
67%
Receiving a product before it's publicly available
85%
Receiving a product free of charge
91%

5. Syndicate Content Across Channels

It’s important to generate a high volume of reviews to boost conversion on your own dot com. But if you’re a brand, you probably also sell your products through other channels – such as retail partners and Amazon. It’s critical that shoppers can find plenty of review content for your products, wherever they shop for them.

Your ratings and reviews partner should make it easy for you to share – or syndicate – your review content to your key retail partners and Amazon. So be sure to ask them about it. 

6. Measure and Optimize to Boost Conversion

It’s important to continuously measure the success of your review collection efforts. Otherwise, it’s impossible to see what’s working well – and what’s not. You can then use these insights to improve your collection efforts. 

For example, if your collection rate isn’t as high as you’d hoped, you can make data-based optimizations to your write-a-review form – and then measure to see how (or whether) this impacts your collection rates.

It’s Time to Prioritize Review Volume

Review volume matters to consumers. And a high volume of reviews is proven to positively impact conversion rates – a lot. 

Make it a priority to collect a high volume of reviews across your product catalog. Schedule a demo with PowerReviews to see firsthand how we can help.

Alyson Fischer

Alyson Fischer is our Product Marketing Manager, obsessed with using data-driven storytelling to deliver a best-in-class customer experience and inspire dynamic engagement across channels. When she’s not agonizing over writing this bio, you can find her exploring Chicago with her furry sidekick or watching a true crime documentary on Netflix.