Are Your PDPs Built for Conversion?

According to Digital Commerce 360, more than 20% of consumer spending in the first quarter of 2022 occurred online. Even in-store shoppers are doing plenty of online research before making a purchase decision.

At the same time, brands and retailers face steep competition – regardless of category. Brands and retailers must work hard (and smart) to attract and convert shoppers who have more choices than ever before.

If you’re like most brands and retailers, you likely invest plenty in SEO and digital initiatives to drive more traffic to your dot com. But what happens when someone clicks through and lands on one of your product pages? 

While click-through is an important metric, conversion is the ultimate goal. Brands and retailers, therefore, need to ensure their product details pages provide all of the information shoppers need to make confident purchase decisions – regardless of the device they’re using to shop. 

In this guide, we’ll discuss why it’s critical to continuously optimize product details pages – as well as the 10 key ingredients of PDPs that convert (with real-life examples of these ingredients in action).

PDPs: The Starring Character in the Conversion Story

Typically, a consumer doesn’t start the purchase journey on a PDP. Instead, they might start their search on Google, see a digital ad while scrolling through their favorite website or social media channel or do a search on a brand or retailer’s website.

Once the consumer clicks through, it’s the PDP that makes or breaks the sale.

Great Product Pages Increase Conversion

One of the downsides of online shopping is that consumers can’t see and touch a product prior to purchase. Instead, they depend on the PDP to get an accurate picture of what to expect from a product. Great PDPs give shoppers all the information they need. This increases their confidence – and their likelihood of making a purchase. 

Great Product Pages Decrease Returns

Returns are a thorn in the side of all brands and retailers. However, returns are especially common when merchandise is purchased online. In fact, CNBC reports that the average return rate for online purchases is nearly 21%.

A great product page sets realistic expectations. That way, there are no surprises when the item arrives in the mail. And that means customers are less likely to make returns. 

Great PDPs are Table Stakes – But Many Businesses are Falling Short

The best PDPs equip shoppers with the information they need to make confident purchase decisions. But the harsh reality is, many PDPs are falling short. According to Baymard research, a mere 18% of the 141 top-grossing US and European ecommerce sites have what they deem to be “good” or “acceptable” product page UX performance.

The Ideal PDP

PDP optimization must be a top priority for any brand or retailer that sells online. But what exactly does an “ideal” PDP look like?

The short answer is, there is no single PDP formula that’ll work for every brand and retailer. Instead, it depends on a lot of factors including the product type and industry, among others. 

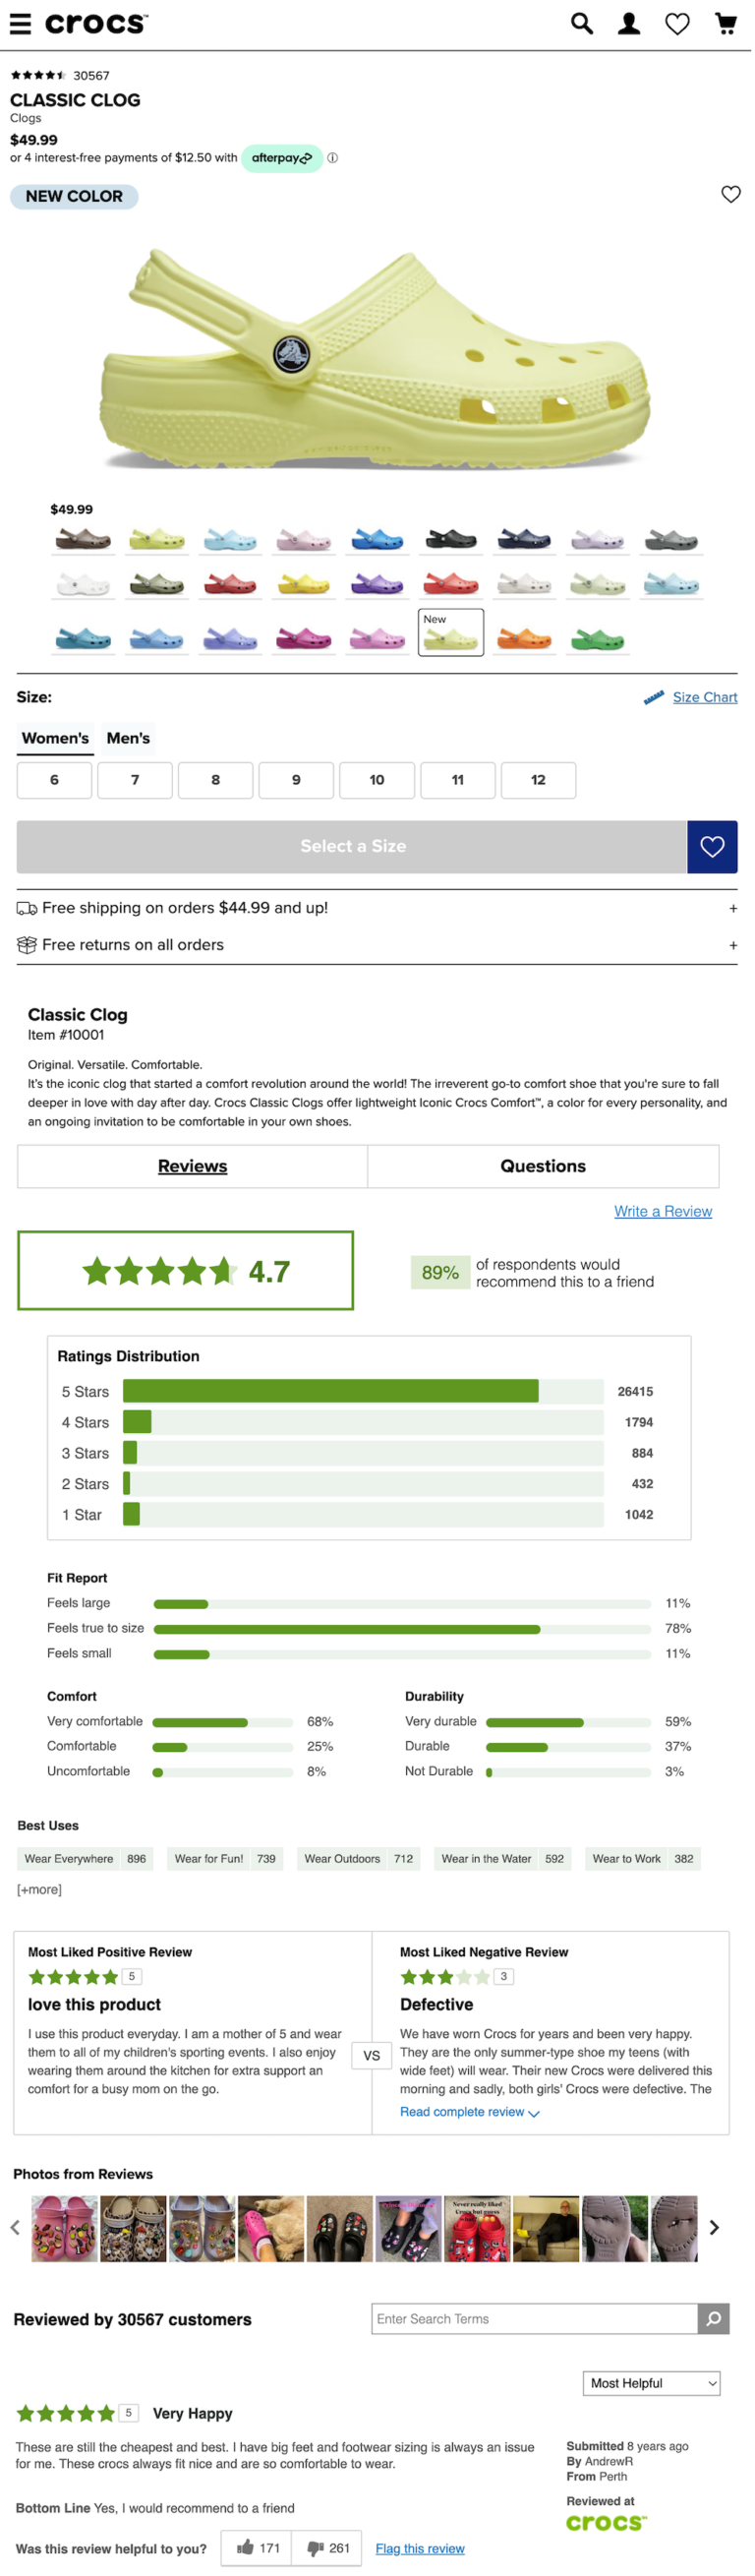
That said, there are certain commonalities across all of the best product details pages. Here’s a bird’s eye view of what “good” looks like.

In the following sections, we’ll dig deeper into each of these 10 key ingredients. 
Mobile friendly
Descriptive Title
Detailed written description
Size and sizing information
Cost
Shipping and Returns Information
Visual content
UGC preview
Ratings and reviews
Questions and answers (Q&A)

1. Mobile Friendly

According to Insider Intelligence, retail mobile commerce reached $359.32 billion in 2021, a 15.2% year-over-year increase. By 2025, retail m-commerce is expected to reach $728.28 billion and account for just over 44% of total retail commerce sales in the U.S.
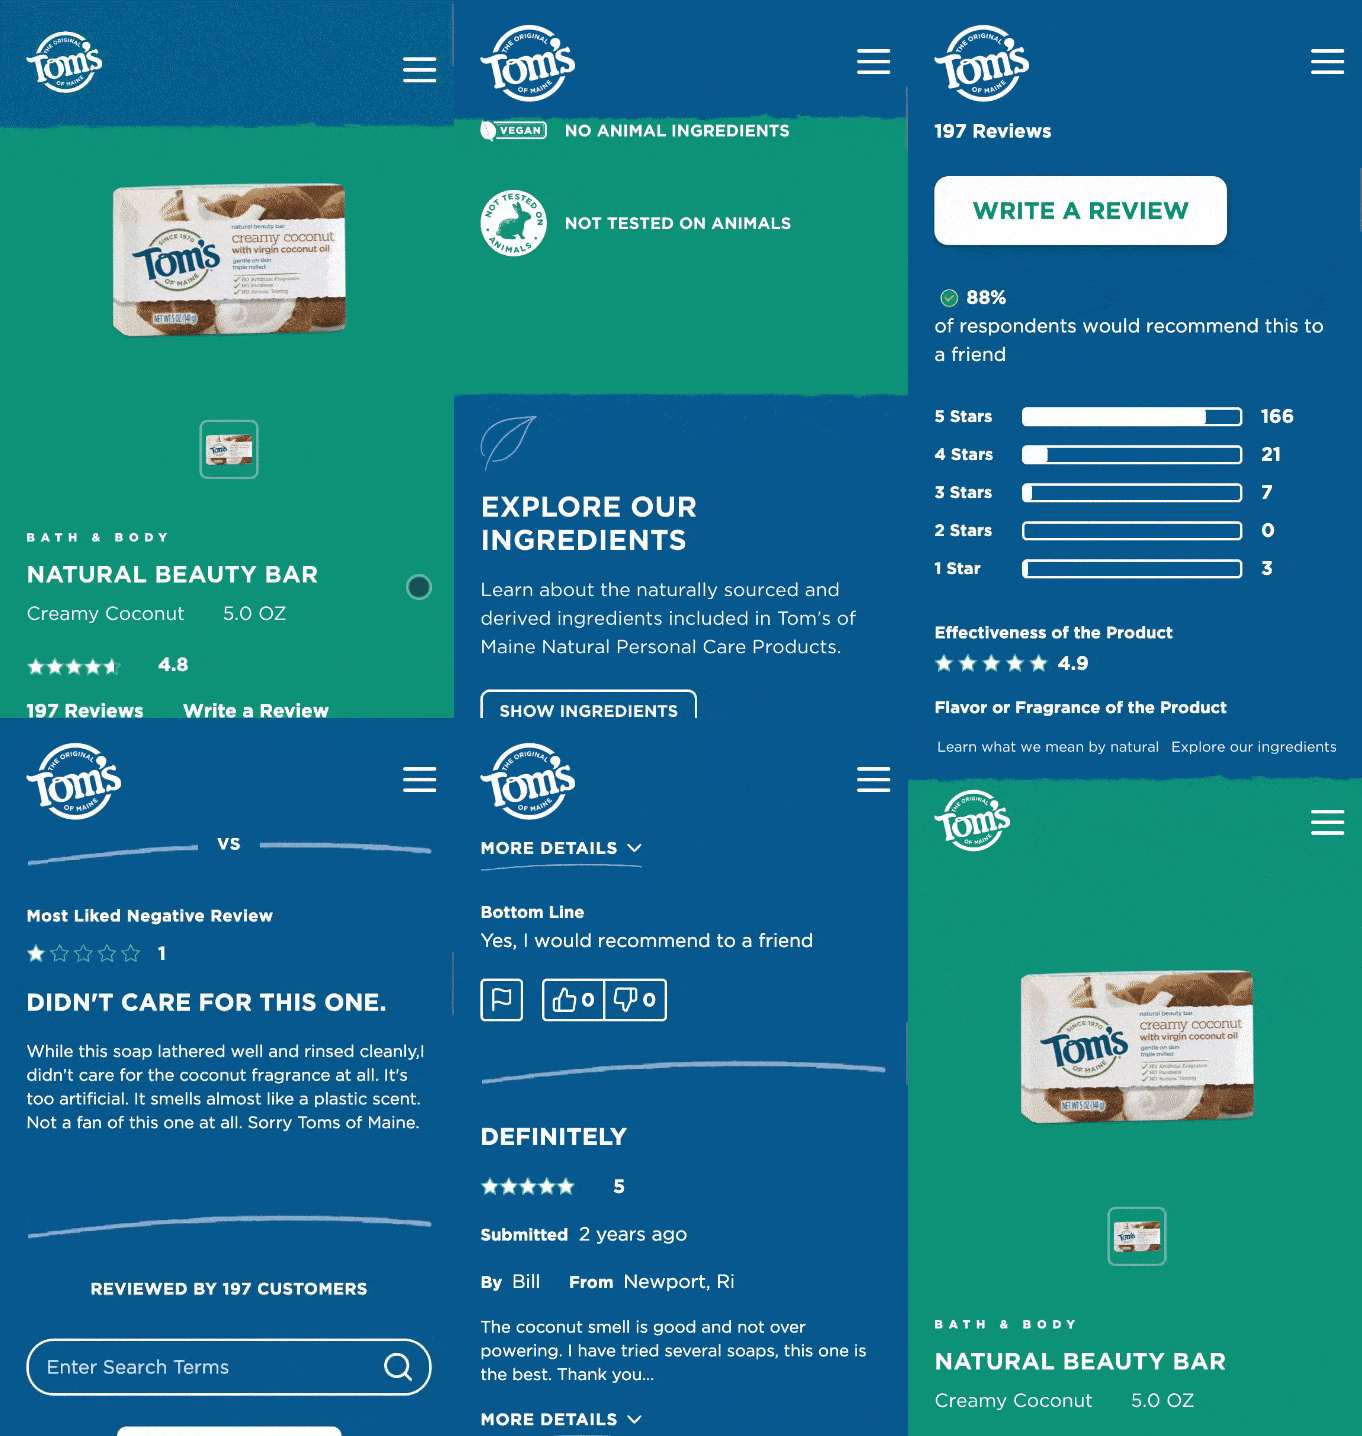
It’s critical to ensure your product pages are easy to view and navigate, regardless of the device a shopper is using.

In fact, ALL components of the product page – including imagery and user-generated content (more on that later on) should be mobile-friendly. 

The bottom line is that shoppers must be able to easily find and consume the same product information on a mobile device as they can while browsing on a computer. Brands and retailers that fail to optimize for mobile are certain to lose the growing number of shoppers who browse and buy directly from a mobile device.

2. A Descriptive Title

A descriptive title is the foundation of a great PDP. A great title impacts where (or if) your product page appears in search – which is where many shoppers start the purchase journey. Plus, a well-written title can provide a lot of upfront information to shoppers. This helps them determine whether the product fits at least their initial search criteria. If a product does fit that initial criteria, an informative (yet concise) title) can entice more shoppers to scroll to learn more. 

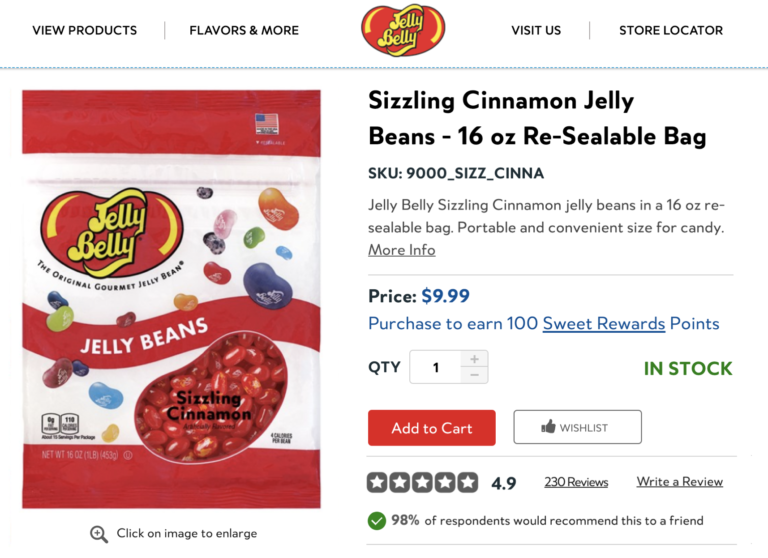
This PDP features a descriptive title that lets shoppers know the flavor, size and quantity of the product. It’s easy for them to see exactly what they’ll get – even without reading the full description. 
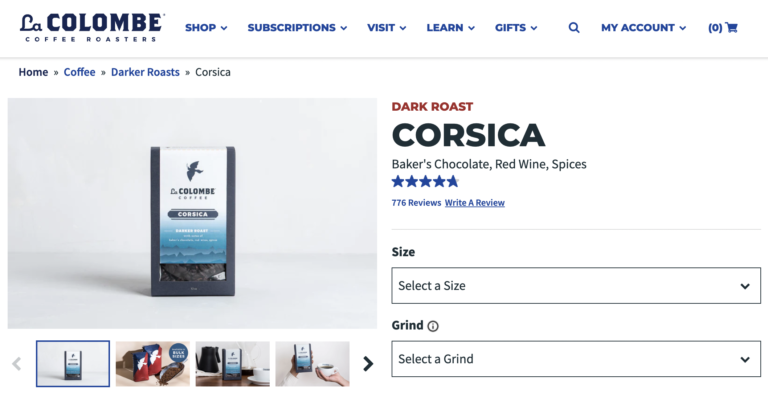
The title on this product page for coffee lets the shopper know the type of roast – as well as the flavors it has. If the shopper is a fan of baker’s chocolate, red wine, and spices, they’ll scroll on to learn more. Otherwise, they’ll take their search in a different direction.
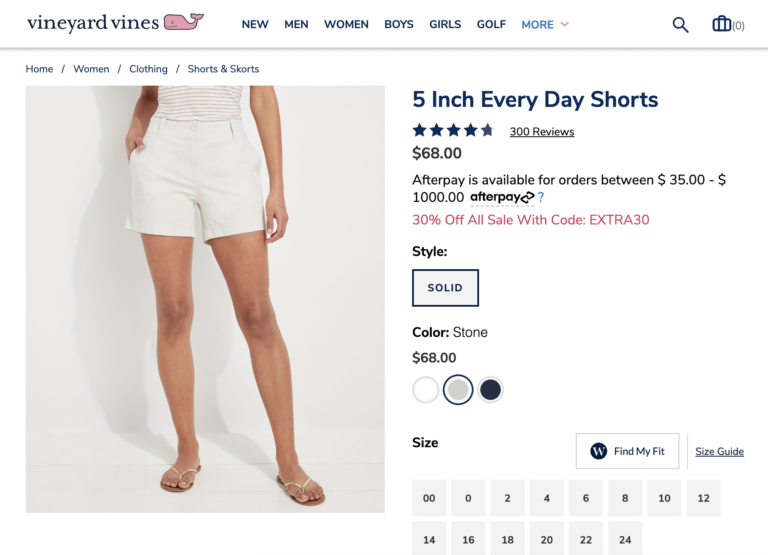
Shoppers get a lot of information from the title on this PDP for shorts, too. They can see that the shorts are five inches in length (an important search criteria for many shorts shoppers) – and they’re good for everyday wear.
3. Detailed Written Description

The product description tells the story of your product, highlighting the important features – and how they benefit customers. The best written descriptions give shoppers all the information they need to make smart, confident purchase decisions. Research from Salsify found that 87% of shoppers place a high value on product descriptions as a key factor for making purchase decisions. 

As an added bonus, clear, detailed, well-written product descriptions can positively impact how high your product pages show up in search results. That means more shoppers will land on your PDPs when starting the purchase journey on Google or another search engine. 

There’s no set formula of what should (or shouldn’t) be included in a written product description, as it varies from brand to brand and even product to product. However, there are a few best practices that apply across all product categories. For starters, use a conversational writing style that’s easy for shoppers to read.

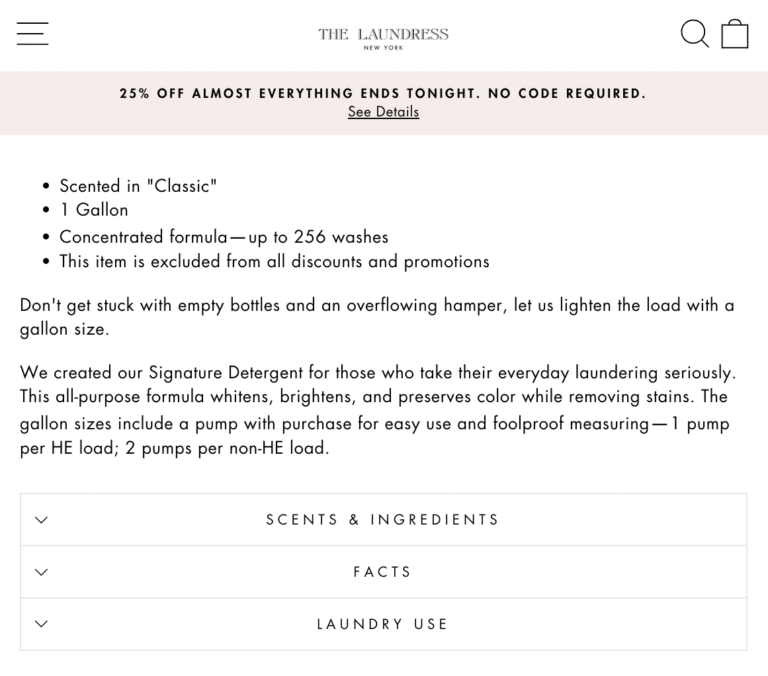
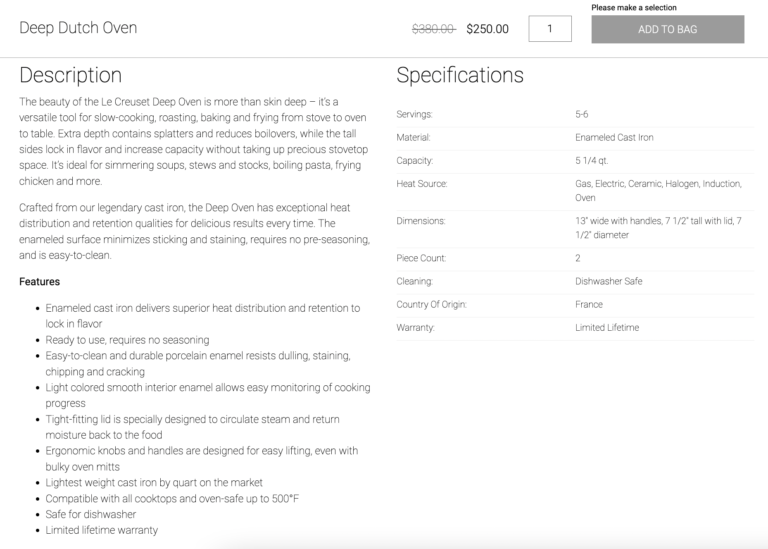
In addition, remember that large blocks of text are challenging to read – especially for the growing number of consumers who are browsing and buying on a mobile device. As such, consider using lists, bullet points, visual icons, and other techniques to break up text and make it easier to read. For example, both of these PDPs use bullet points to list out the main features of products.
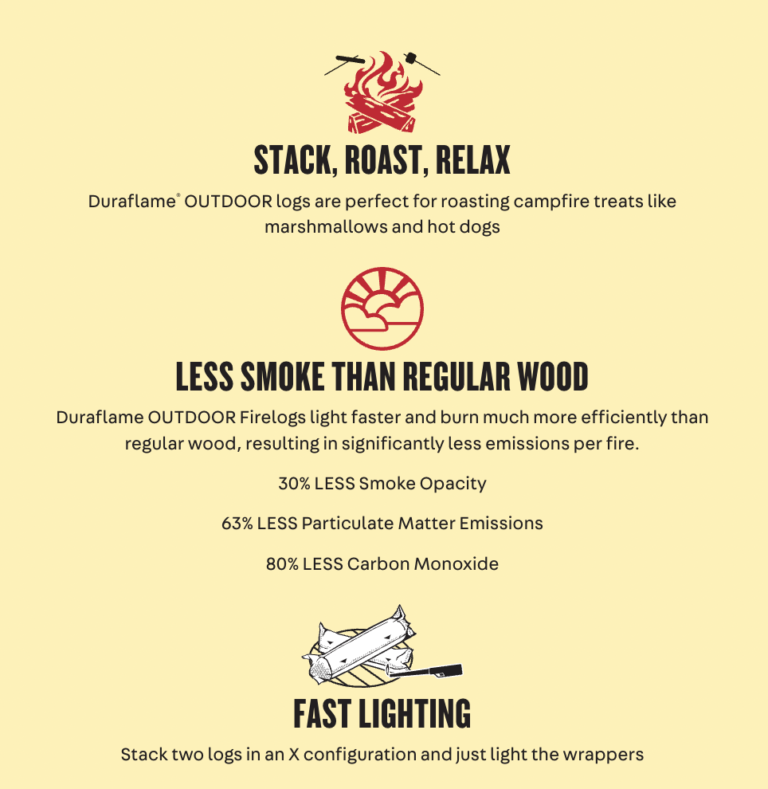
This is another home and garden PDP that also uses bullet points to convey the key features of the product. The brand also uses graphic icons to chunk the text into easier-to-read sections. 
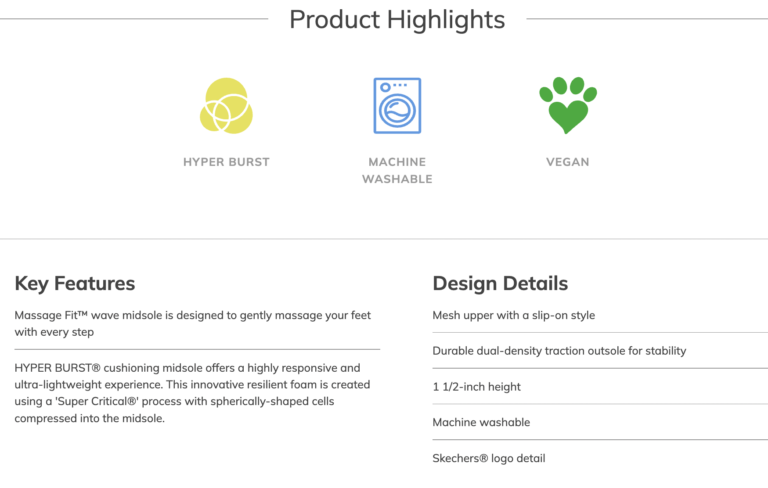
This shoe brand also does a great job conveying a lot of information – but doing so in a way that’s easy to scan and not visually overwhelming. There’s a short introductory paragraph at the top, followed by product highlights, key features, and design details that are easy to scan. 
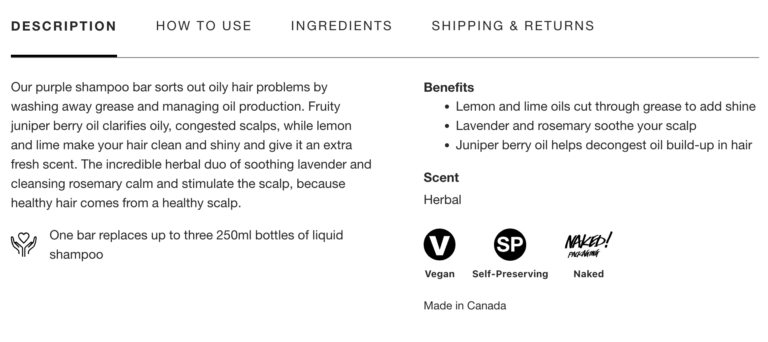
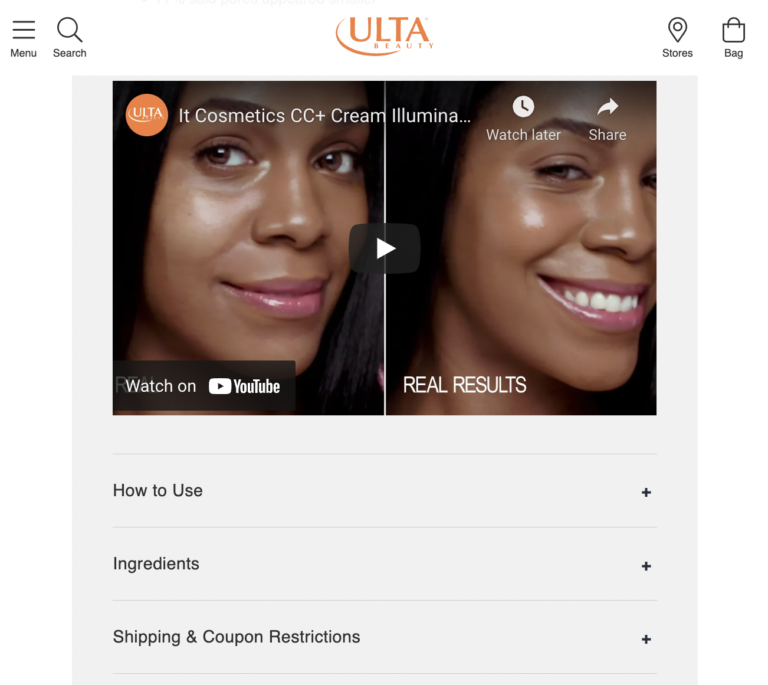
Some brands and retailers break up the product description into multiple sections so shoppers can hone in on the details that matter most to them. For example, this brand has multiple tabs on its PDPs, including a description, information about use, and ingredients.
These two PDPs take a similar approach, with expandable sections for things like usage instructions and product ingredients. 
4. Size & Sizing Information

Online shoppers return merchandise for many reasons. But size or sizing concerns rise to the top. According to Narvar, 42% of consumers made their last return because of size and fit issues. 

Size is important across many product categories – but perhaps the most obvious is clothing and shoes. If a product doesn’t fit correctly, a shopper is likely to return it. What’s more, many shoppers engage in bracketing, which is the practice of buying multiple versions of an item (in this case, multiple sizes), trying them at home, and returning what doesn’t work. This, of course, causes headaches (and unnecessary costs) for brands and retailers.

Size matters for other categories, too. For example, a consumer needs to be sure a coffee table will fit well in her small living area. Or, a consumer may be disappointed (and make a return) when a bottle of face cream ends up being smaller than expected.

When shopping online, it can be difficult for shoppers to assess size and sizing. But the right tools on the product page can ensure the shopper chooses items that fit their size or sizing criteria, which increases customer satisfaction (and decreases returns and negative reviews).

Size Charts and Dimensions

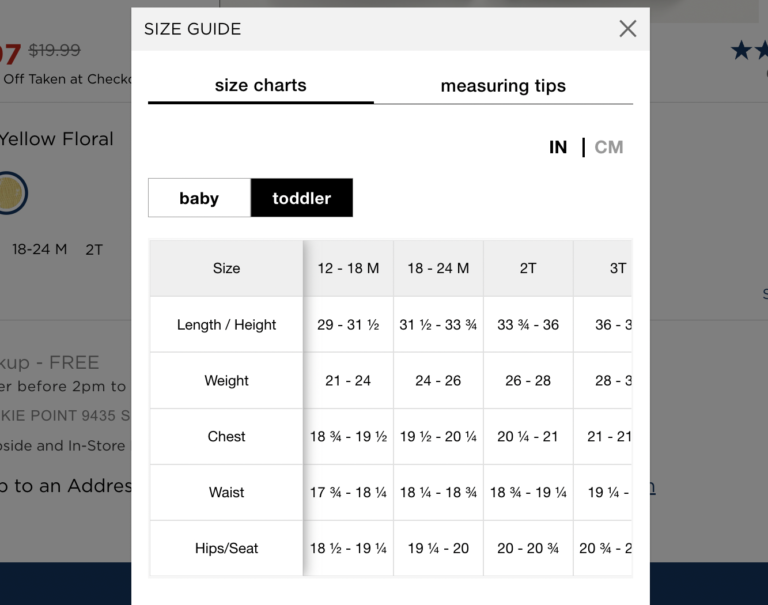
At a bare minimum, brands and retailers must include product measurements and size charts on their product pages.

For example, this apparel page includes a “fit & sizing” section to provide details about how the item is intended to fit. 

They also provide a sizing chart on each product page. Finally, they provide tips for measuring to determine the appropriate size.
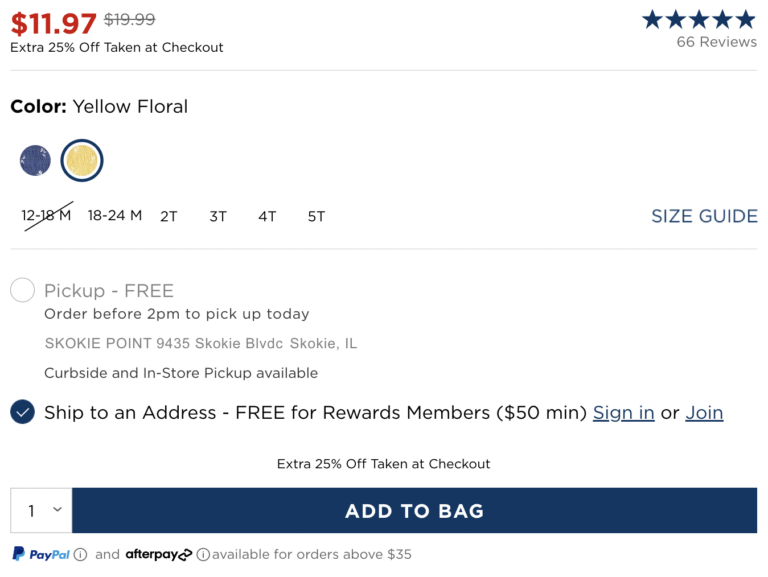
This home and garden retailer, on the other hand, includes comprehensive product measurements so shoppers can ensure the product fits in their space.

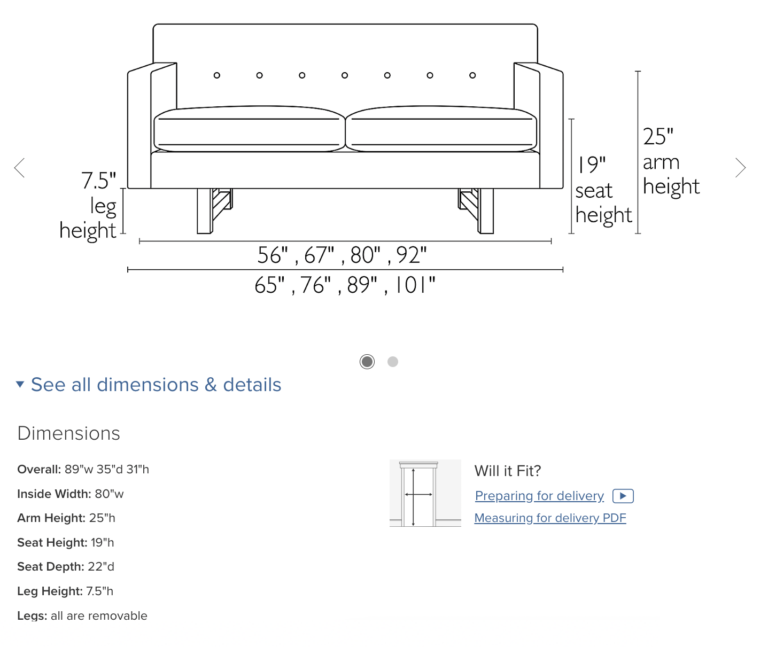
Room & Board is another example of a home retailer that makes it easy for shoppers to visualize the size of an item.
Interactive Size and Sizing Tools

Many customer-centric brands and retailers also include innovative, interactive tools on their product pages to help ensure shoppers find the products that are the best size and fit.

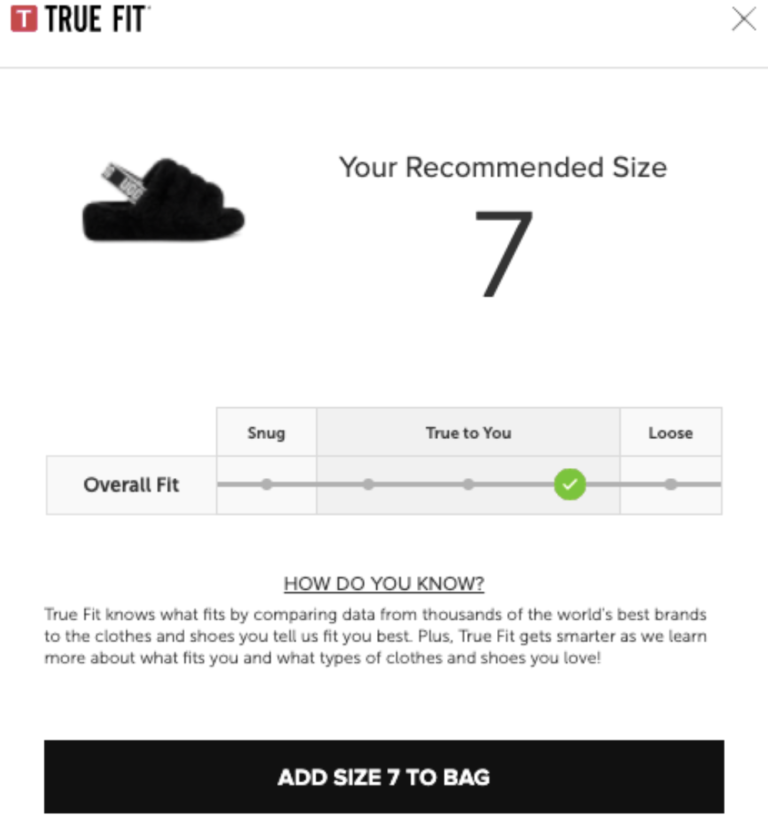
For example, this shoe brand leverages a tool that collects information from the shopper – including the size they wear in other brands. Based on this information, the tool recommends a size for the shopper to purchase.
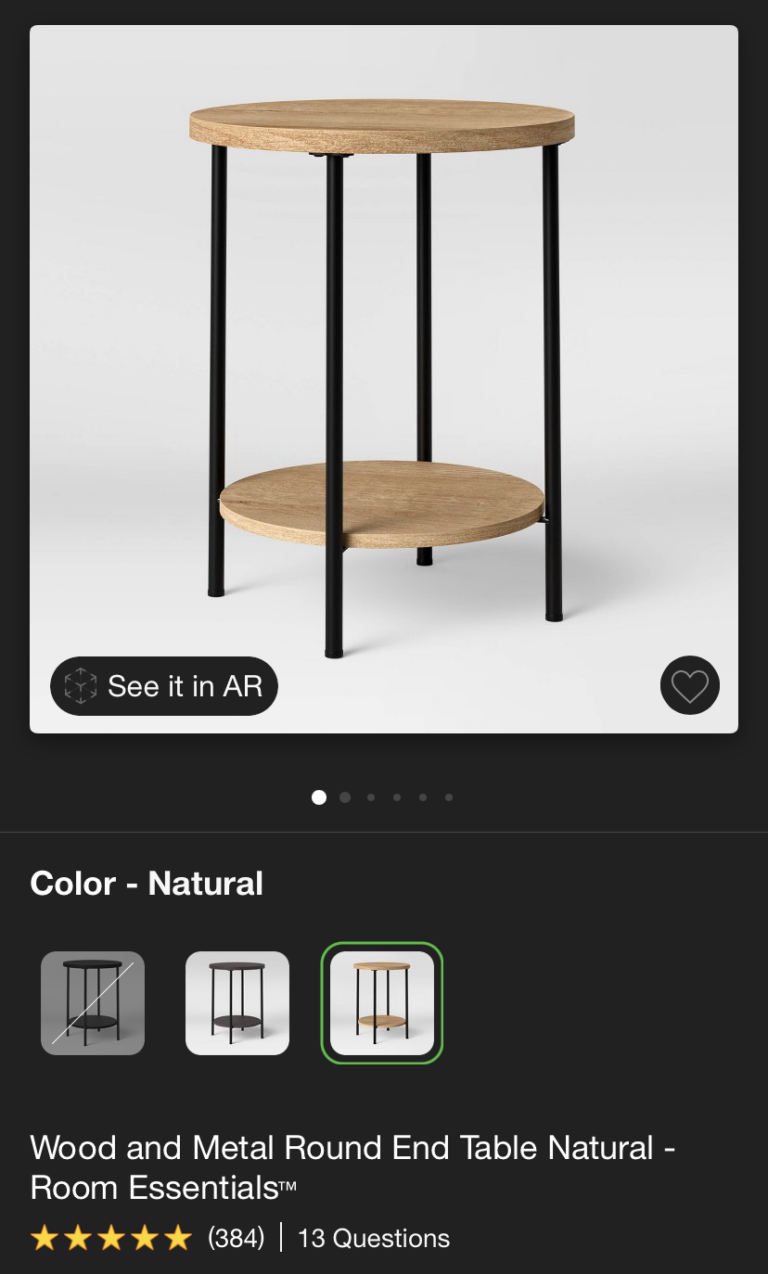
This retailer, on the other hand, leverages AI to allow shoppers to snap a photo of their space – and see how the item will look in it. 
User-Generated Content

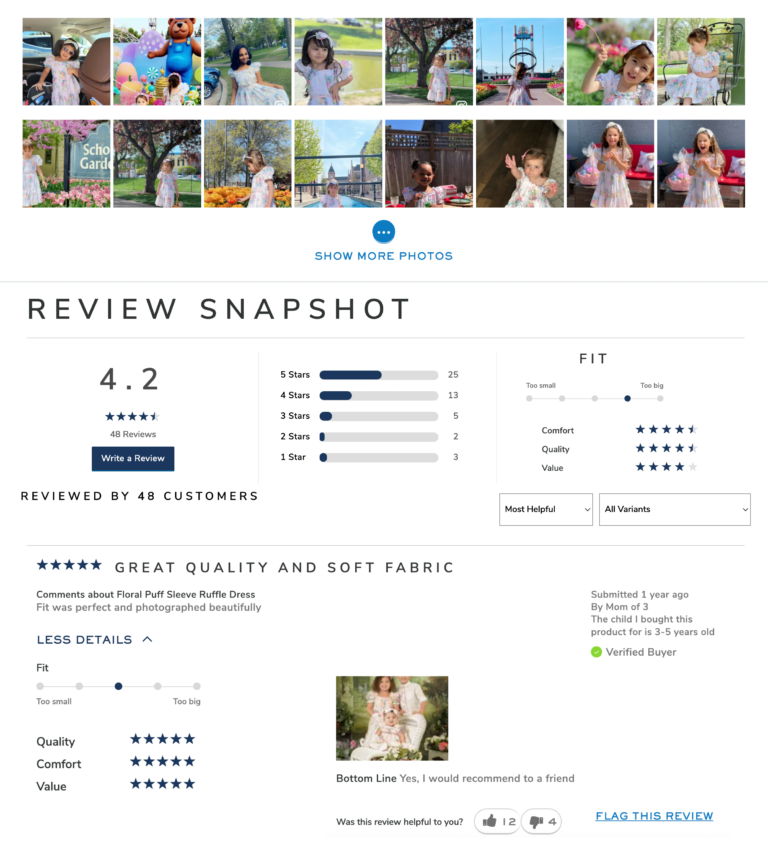
User-generated content including reviews and imagery (both of which we’ll explore in more detail later on) can help shoppers understand size and sizing sight unseen – and choose the products that are the best size and fit. 

Some brands – including children’s clothing brand Janie and Jack – ask reviewers to include information in their review about how the product fits upon arrival. Then, the brand aggregates this data and includes a size and fit summary in the review display. Based on the reviews for this product, we can see that this item typically is found to be slightly large.
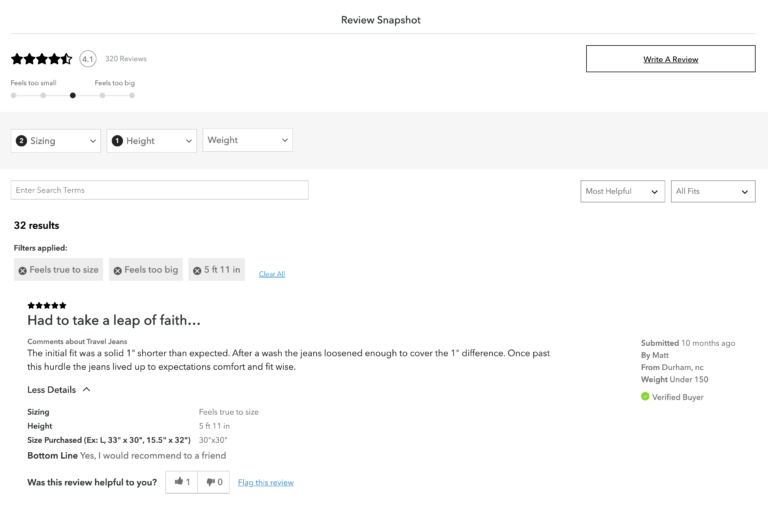
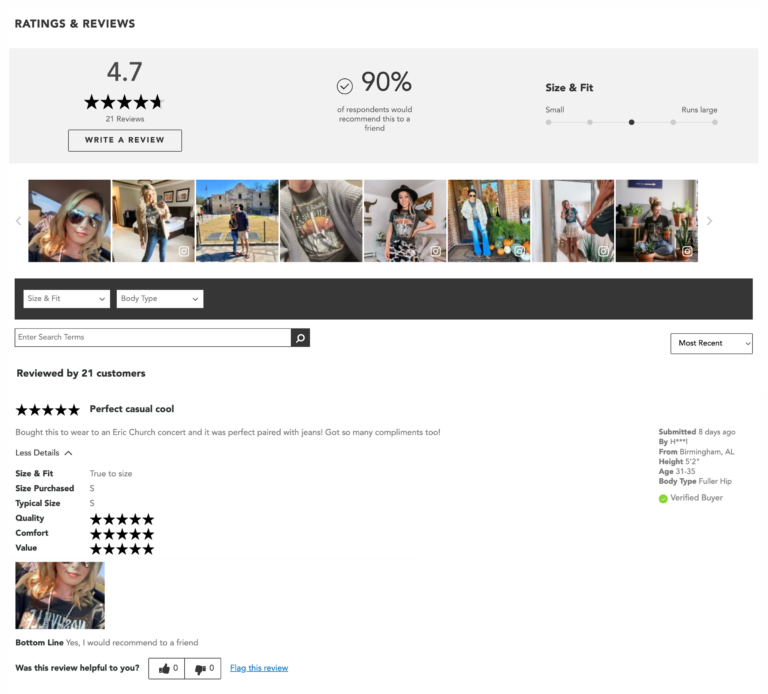
Some brands and retailers also ask reviewers to include details such as height and body type. Shoppers can then filter reviews to find feedback written by those with similar characteristics to them. For example, on this brand’s site, visitors can filter to see reviews written by those of specific heights and weights. 
The right photos and videos (both brand supplied and consumer generated) can also help shoppers understand the size or sizing of a product. For example, some apparel brands and retailers include photos featuring models of different shapes and sizes to help shoppers beter gauge how an item looks on someone with a similar body type.
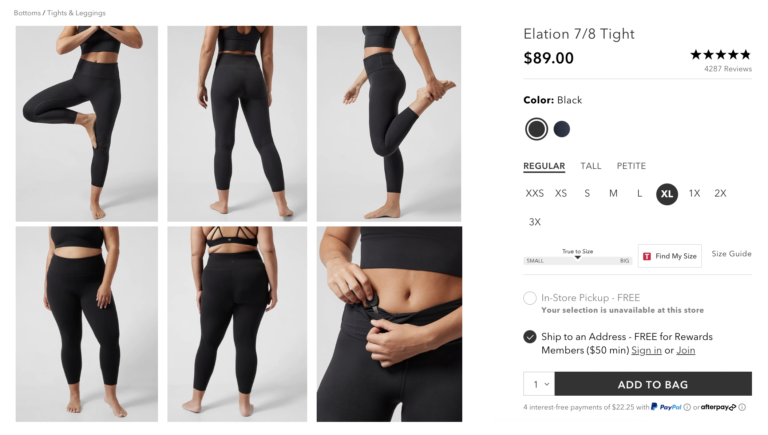
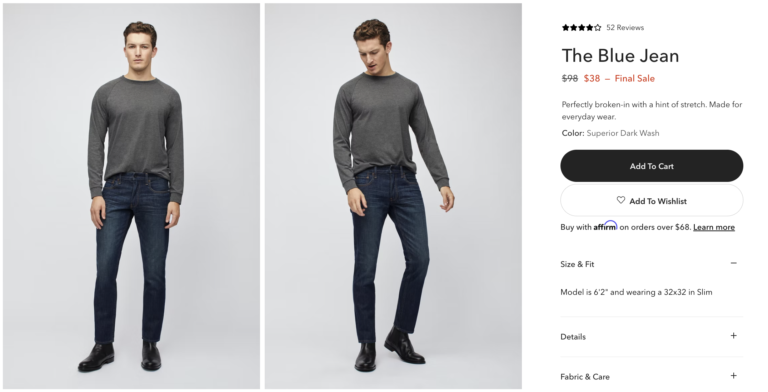
Some brands and retailers list a height and weight for the models – as well as the size item they’re wearing.
If the brand or retailer showcases user-submitted photos, shoppers can also browse this content to find content from those with similar body types. 
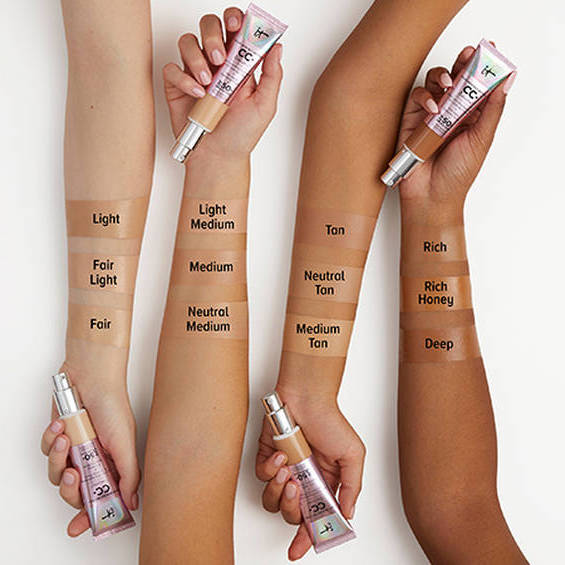
Imagery can also help shoppers understand the scale of a non-clothing product. For example, this cosmetics brand includes a photo of peoples’ hands holding bottles of the skincare product. This can be a more effective way than dimensions alone for consumers to visualize scale. 
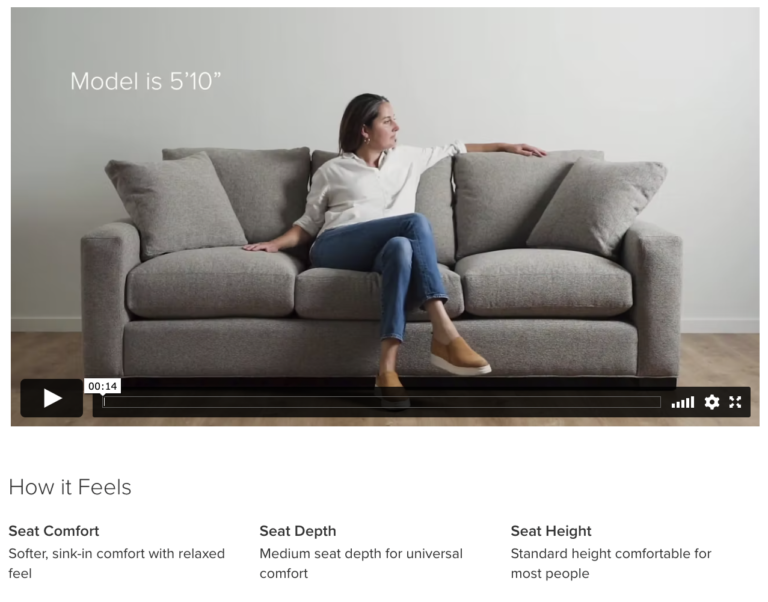
As another example, this home brand includes a video of a couch with a person (along with their height measurements) on it to help shoppers understand scale. 
We’ll explore the importance of featuring photos and videos on your product pages in more depth later on in this guide.

5. Cost

Consumers consider many factors when weighing a purchase decision. It probably comes as no surprise that price is one of the top ones. Our research found that 91% of consumers consider the price of an item when deciding whether or not to buy it. 

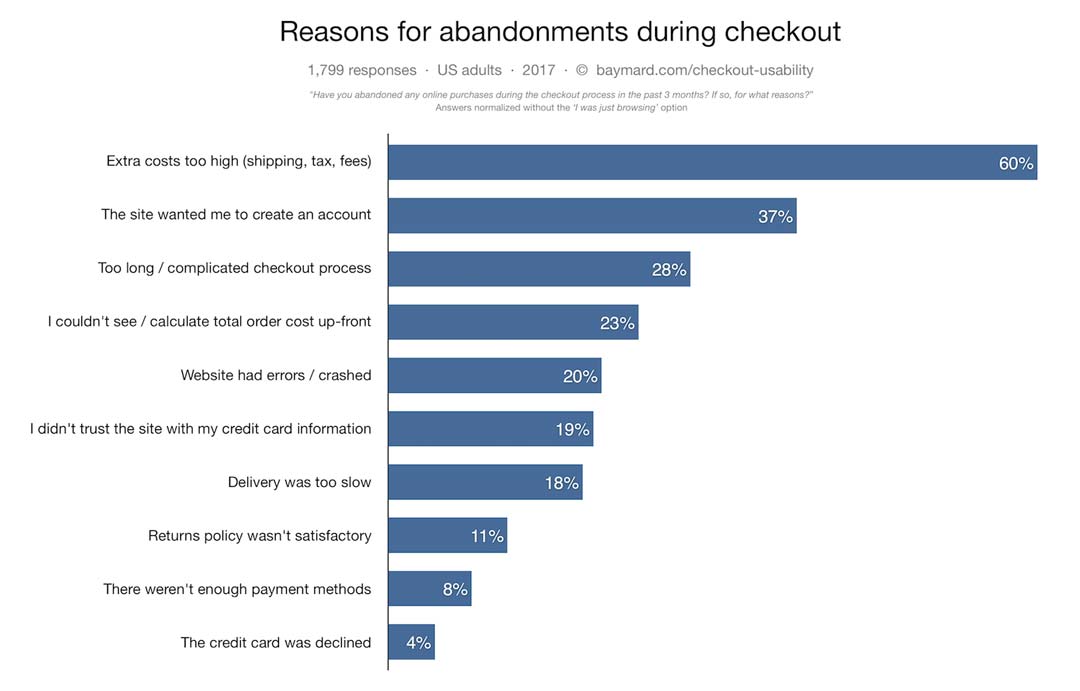
Yet, according to Baymard, 60% of consumers say they’ve abandoned an online purchase during the checkout process because the extra costs were too high.

Be sure to make pricing information prominent on your product pages. And be transparent about any extra costs, including shipping or other fees.

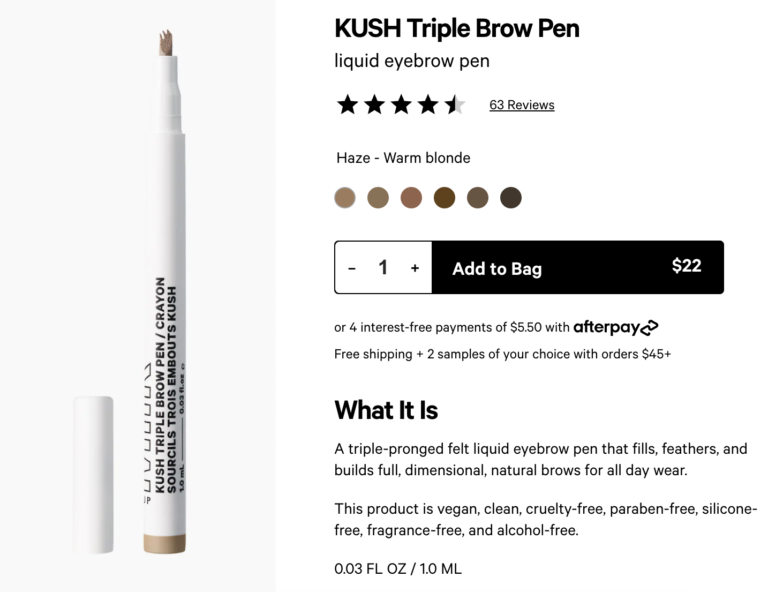
For example, shoppers considering this brow pen can easily see that the item is $22 – and that unless they spend over $45, they’ll have to pay for shipping too. Shoppers can also see that it’s an option to pay for this product in installments. 
This electronics brand is also very transparent about pricing. Shoppers can clearly see that the item is $999.99, includes free shipping, and can be paid for in $91 monthly installments. 
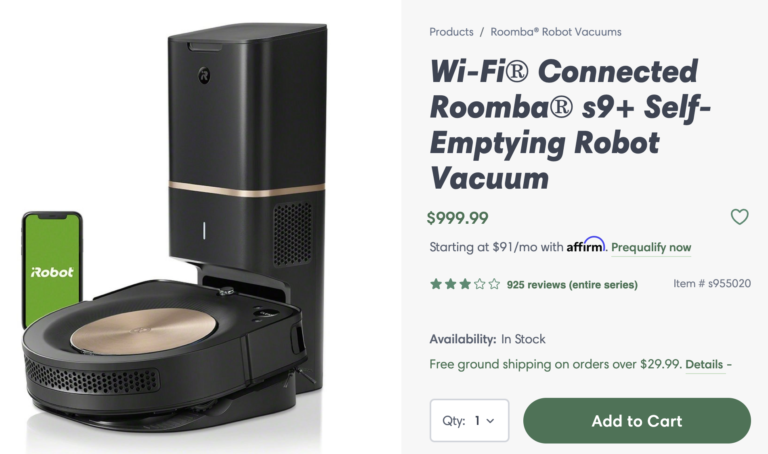
When costs are clearly featured on the product page, there are fewer surprises at checkout. And that means fewer abandoned carts. 

6. Shipping and Returns Information

According to research from Navar, 35% of consumers won’t make a purchase if they’re not sure when the item will arrive. And 39% won’t buy if they can’t easily find the return policy.

In order to increase conversion, brands and retailers must make shipping and returns information prominent on product pages. 

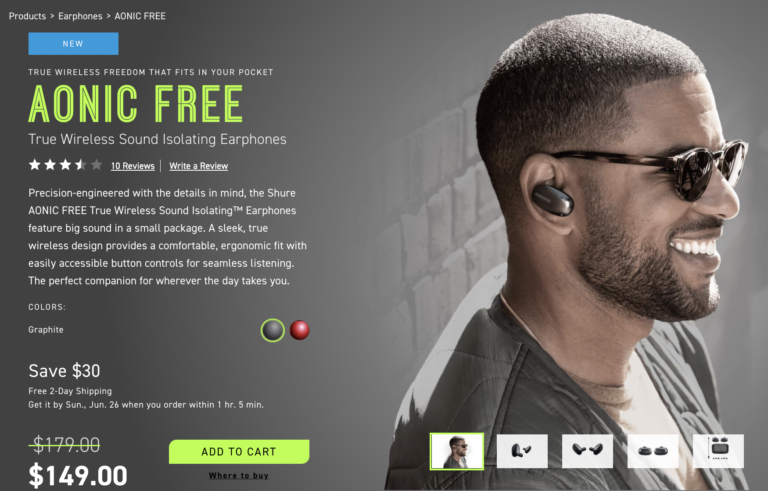
This electronics brand makes it clear that buyers will get free two-day shipping. They even go so far as to display the exact date the item will arrive.
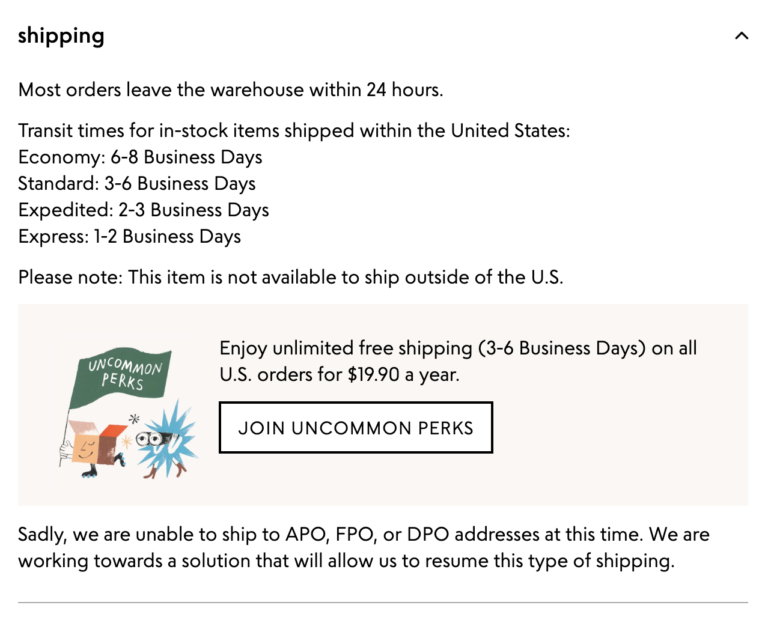
This specialty retailer includes an entire section on product pages devoted to shipping information. This section lets shoppers know how quickly items leave the warehouse and how long transit time is, based on the selected shipping method. They also include a list of addresses they’re not able to ship to, which can eliminate frustration during the checkout process. 
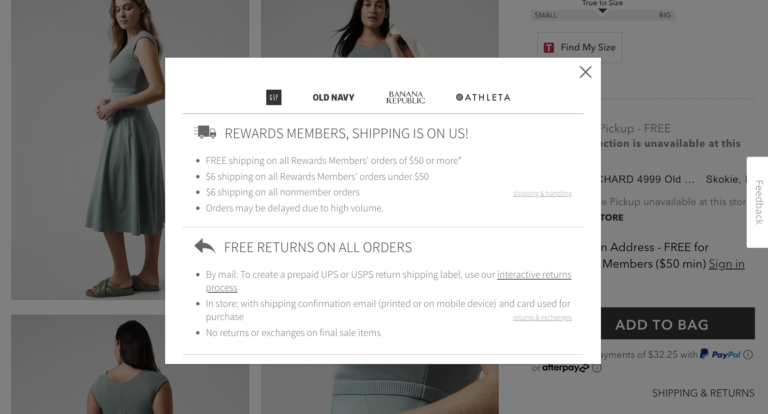
This apparel brand displays the text “shipping and returns” on their product pages. If a visitor clicks through, a pop up appears with detailed information about shipping costs and procedures for returns. 
This product page on a beauty brand’s website is another great example of clear shipping and returns information. Visitors can input their zip code and get an exact date of when they can expect the product to arrive.

If the visitor scrolls down further, they can find an entire tab dedicated to shipping and returns information.
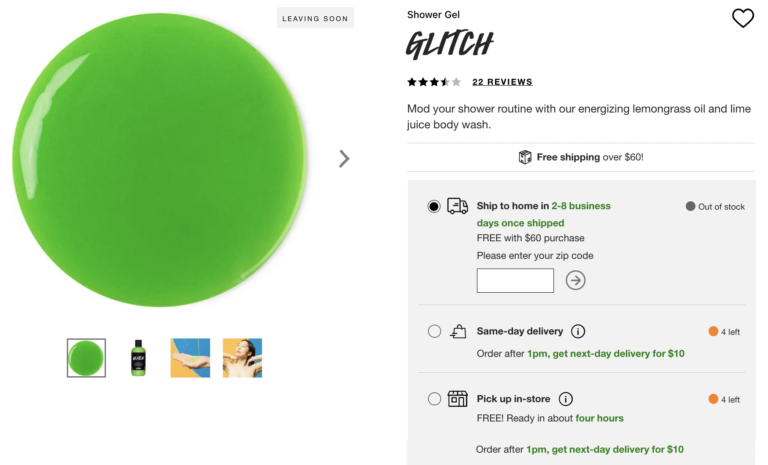
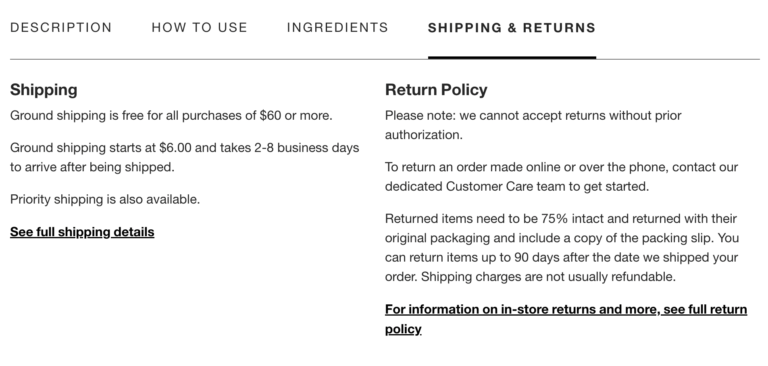
Clear, accurate shipping and returns information gives shoppers confidence that they’ll receive their product in time – and that if it doesn’t work out, they can return it. It’s essential to include this information on your product pages so shoppers can easily find it. 

7. Visual Content

When consumers are shopping online, they don’t have the opportunity to see a product in person prior to purchase. As such, most depend on visual content to understand what a product looks like – and whether it’ll suit their needs and preferences. Our research found that 86% of shoppers always or regularly seek out photos and videos prior to making a purchase.

Professional Photos and Videos

Prominently showcasing professional photos and videos on your product pages is a great start. Be sure your imagery clearly showcases various details of your products. 

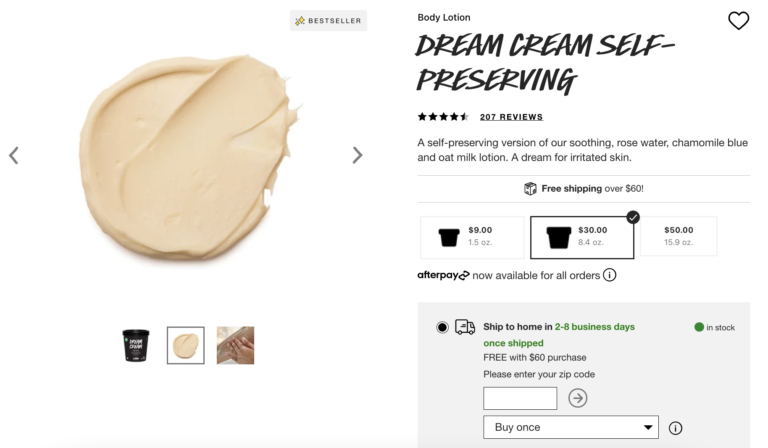
This product page for a beauty product is a great example. The brand-provided imagery includes not only a photo of the lotion in its packaging, but also a couple images of the product itself to help shoppers understand consistency. 
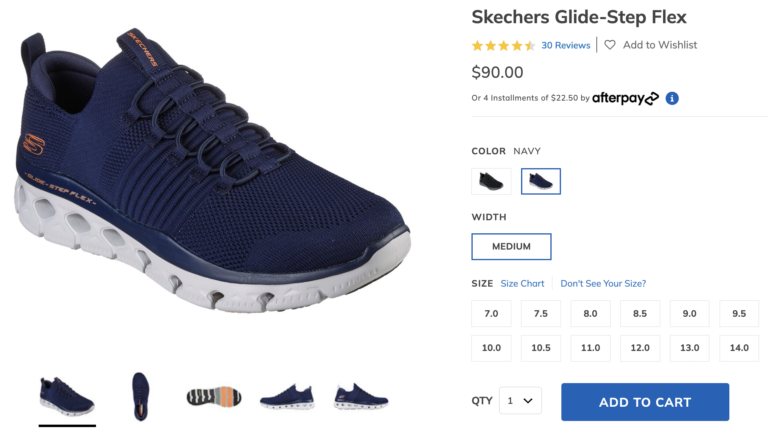
Great professional photography can help online shoppers understand what a pair of shoes looks like from a variety of different angles. 
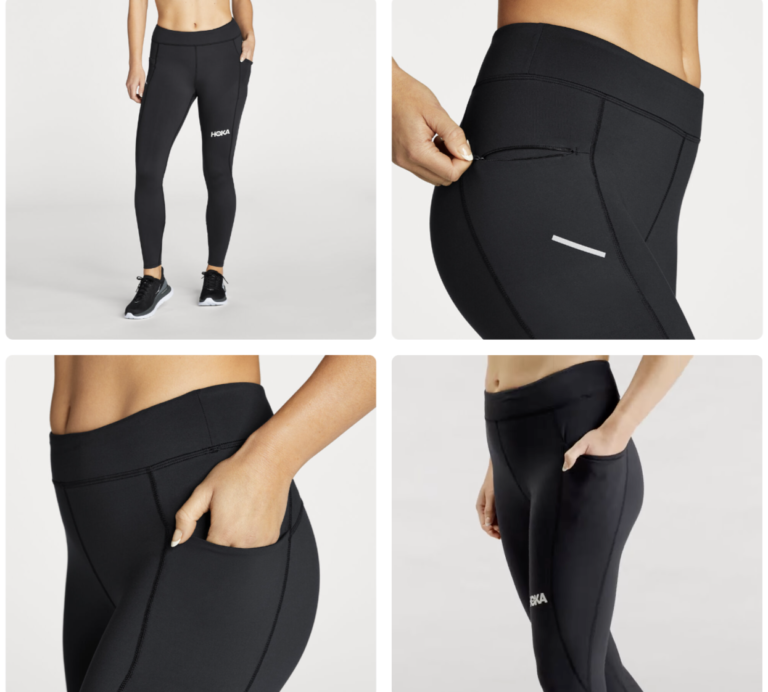
Imagery on apparel PDPs can help shoppers get a better idea of the details of the product – for example, pockets and seams. And, as we covered earlier, if a brand or retailer showcases multiple models on their apparel PDPs, it allows shoppers to get a better idea of what an item of clothing looks like on different body types. 
User-Generated Visual Content

Professional photography is important. But for many shoppers, it’s no longer enough. 

Research tells us that 77% of consumers always or regularly seek out visual content from others who have already purchased a product. What’s more, 80% of consumers indicate that photos from other consumers are more valuable than those from brands or retailers.

Consumers are smart. They know that professional photos and videos are taken to show a product in the very best light. User-generated content, on the other hand, is more authentic. It allows shoppers to get a better idea of what a product looks like when it’s being used by a real person “in real life.” This content can boost confidence – and conversion. A recent analysis found that there’s a 106.3% lift in conversion among visitors who engage with user-generated visual content, when compared to those who don’t. 

As such, the best brands make it a priority to collect photos and videos from their customers – both alongside reviews and from social media. And, they prominently showcase this content on their product pages. A best practice is to display user-generated visual content in an imagery carousel. Doing so is an important way to meet shoppers’ expectations – and drive sales. After all, our recent analysis found that there’s a 106.3% lift in conversion among visitors who interact with user-generated imagery on a product page. 

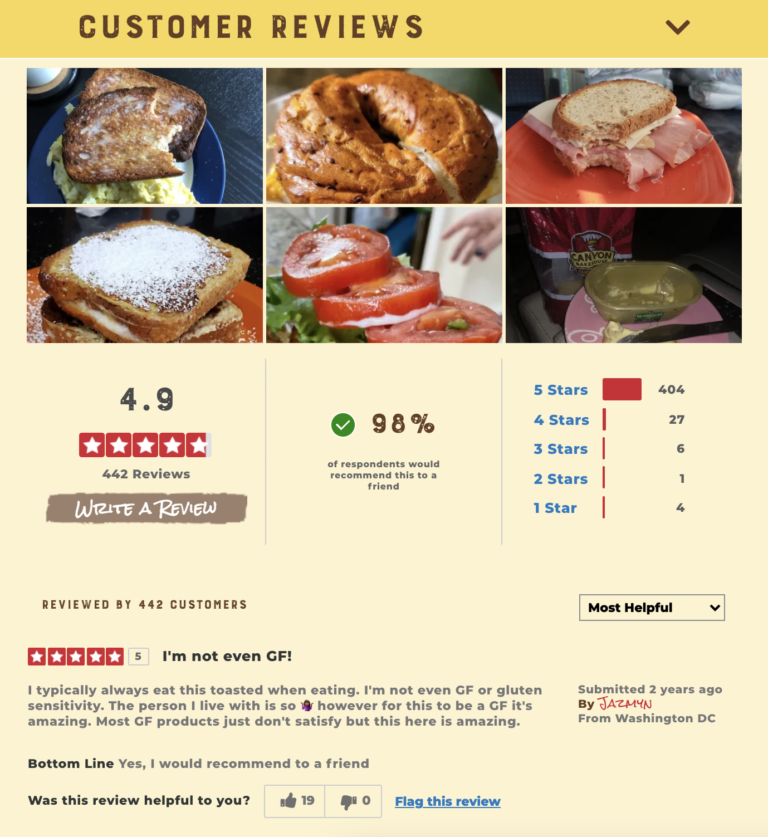
User-generated visual content can help shoppers imagine the possibilities of an otherwise mundane product. As an example, check out this product page for bagels. The brand showcases a photo of the bagels in their packaging, which certainly lets shoppers know what the product looks like. However, the photos and videos submitted by other shoppers let site visitors see all the unique and delicious creations that can be made with the product.
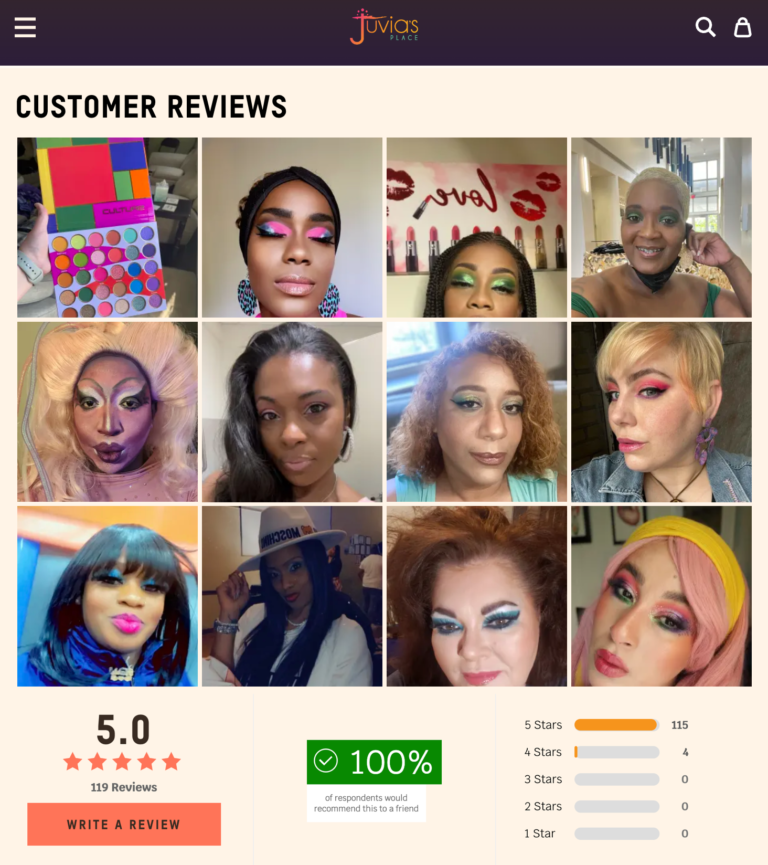
User-generated imagery can also help shoppers understand how an item that looks different on different people (think clothing or makeup) will look on someone similar to them.

For example, a shopper seeking out makeup can browse the imagery on this product page to find consumers with similar skin tones and types. 
User-generated imagery can also inspire shoppers. And this inspiration can lead to cross-sales. 

For example, someone considering this cardigan might check out the photos from previous customers and see one styled with a particular shirt. So, they add both items to their cart.
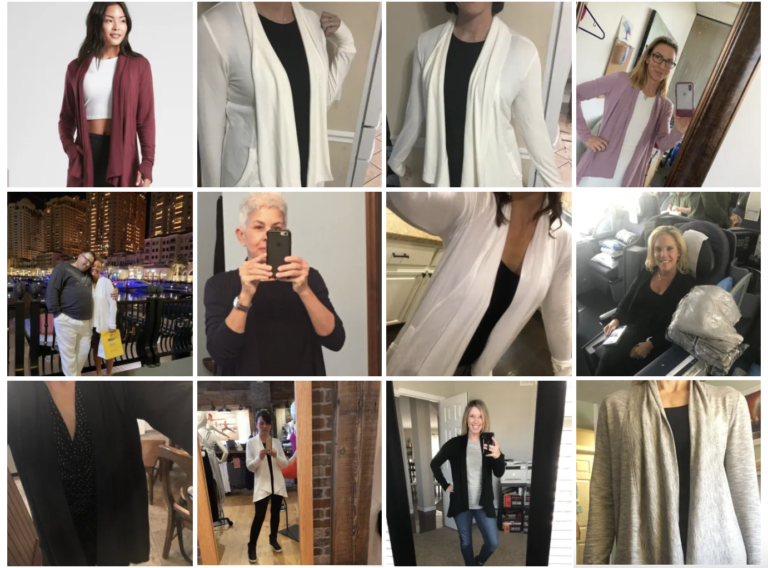
Showcasing both professional and user-generated imagery allows your customers to more easily identify the products that best fit their needs. This leads to greater satisfaction, more positive reviews, and fewer returns.

8. UGC Preview

Increasingly, consumers seek out user-generated content. The onus is on brands and retailers to make it as easy as possible for their visitors to find.

It’s best practice to include a UGC preview (also referred to as a snippet) at the top of product pages. Typically, such a preview includes a summary of the UGC available for the product. This entices shoppers to dig deeper to learn more – and eventually convert. Our analysis found that there’s a 164.3% conversion lift among consumers who click through the snippet.

Typically, the UGC preview includes information like the average star rating and review count. Let’s take a look at some examples of ideal UGC previews.

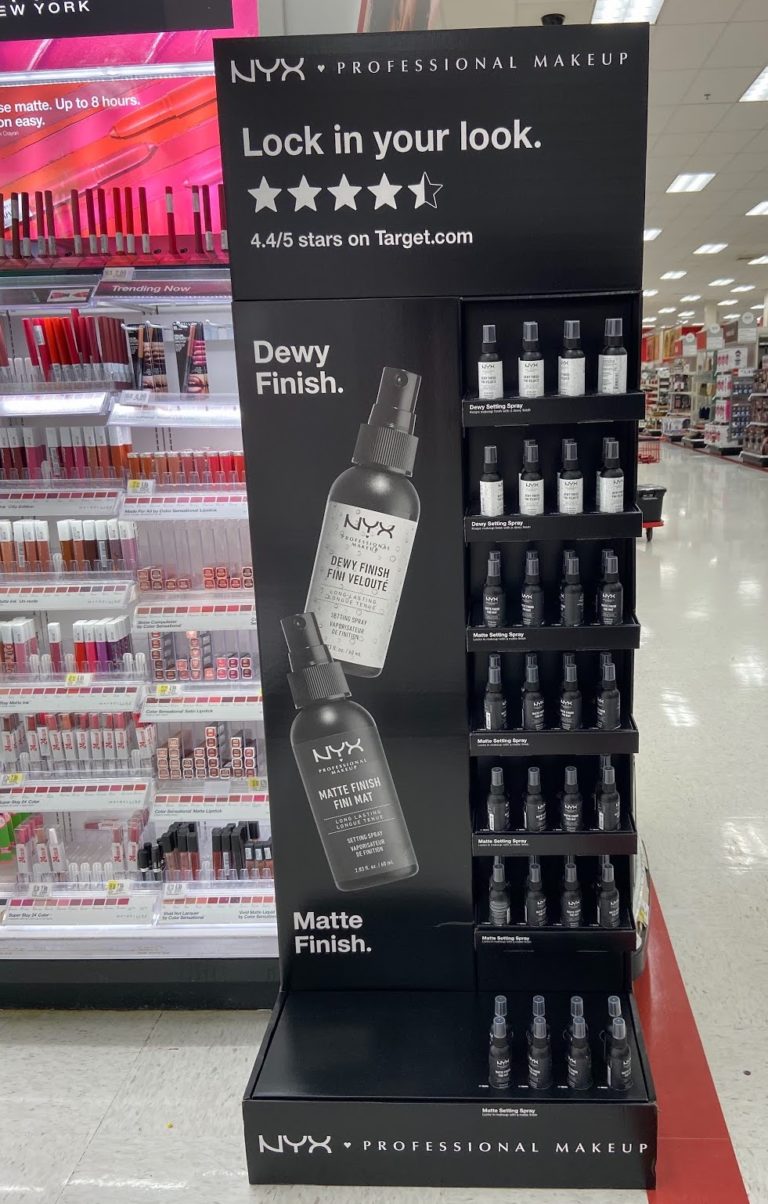
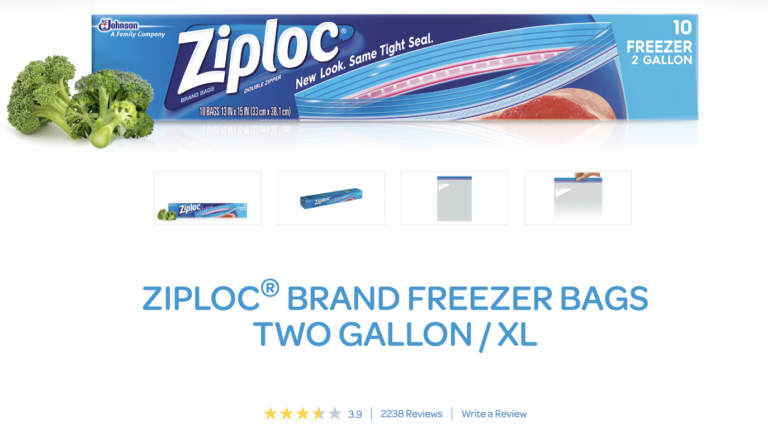
This CPG brand displays the average star rating and review count right at the top of each product page, enticing shoppers to click through to the entire review display.
The pet food PDP also has a UGC snippet – right at the top of the product page.
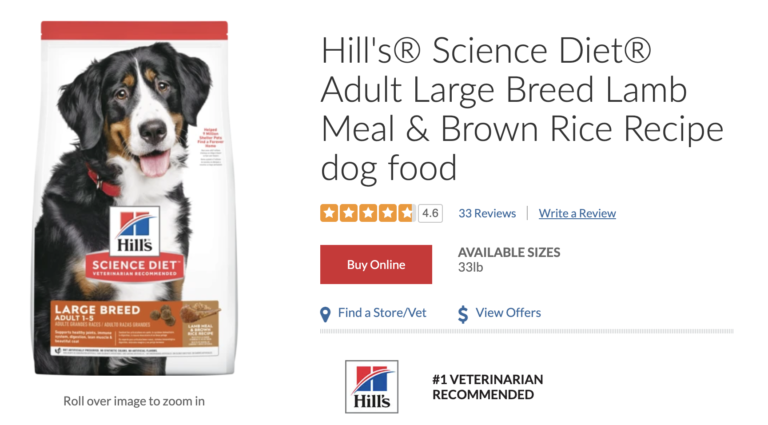
By featuring a UGC snippet at the top of each page, you’re making it as easy as possible for shoppers to find this content. Then, they can dive deeper into the review display – and gain the confidence they need to make a purchase. 

9. Review Display

Today, nearly all consumers seek out reviews at least sometimes. And, 86% don’t purchase products online without reading reviews.

What’s more, a recent analysis found that visitors who interact with ratings and reviews convert at a rate that’s 108.3% higher than average. Certain features of review displays can boost conversion even more.

The review snippet we explored in the previous section is a great starting point. But, it’s not enough. That’s because our research found that nearly all shoppers (99% to be exact) look beyond this basic information and read the actual review content at least sometimes.

It’s important to develop a review display that makes it easy for shoppers to surface that content that’s most relevant to them.

Review Snapshot

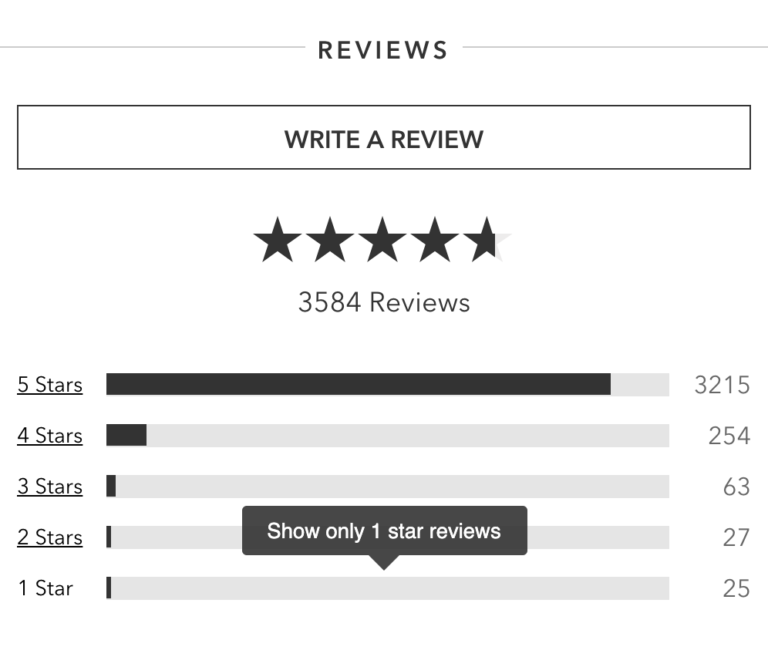
Research from Baymard tells us that users rely more on the ratings distribution summary than the individual reviews. But nearly half of ecommerce sites don’t have such a summary. And of those that do include a distribution summary, 39% aren’t clickable. 

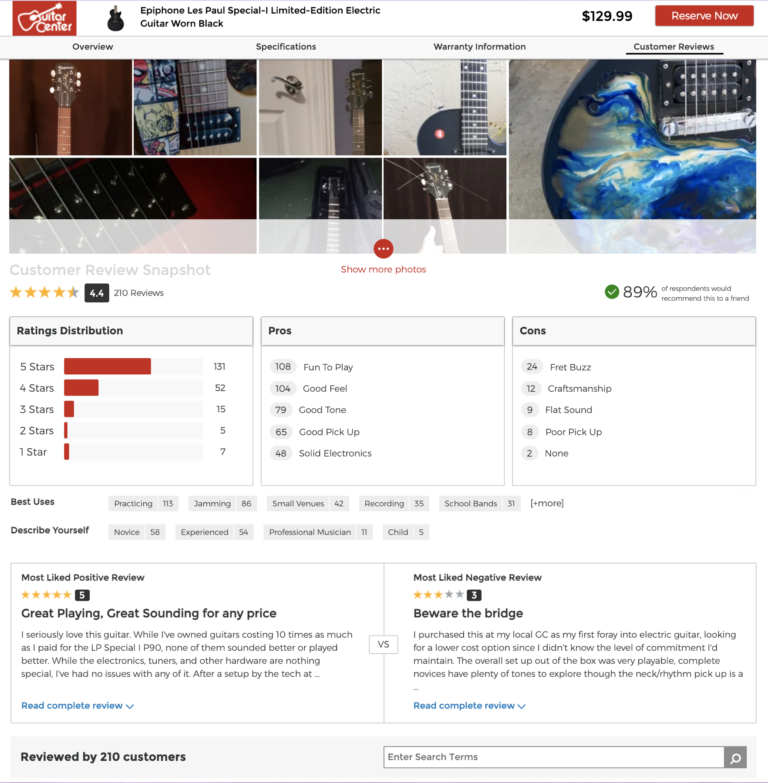
A good review snapshot gives shoppers a high level overview of the reviews available for a given product. And, it can serve as a launching point for the shopper to find reviews that speak to their needs and use cases. 

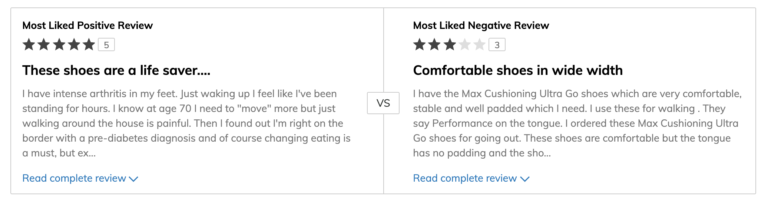
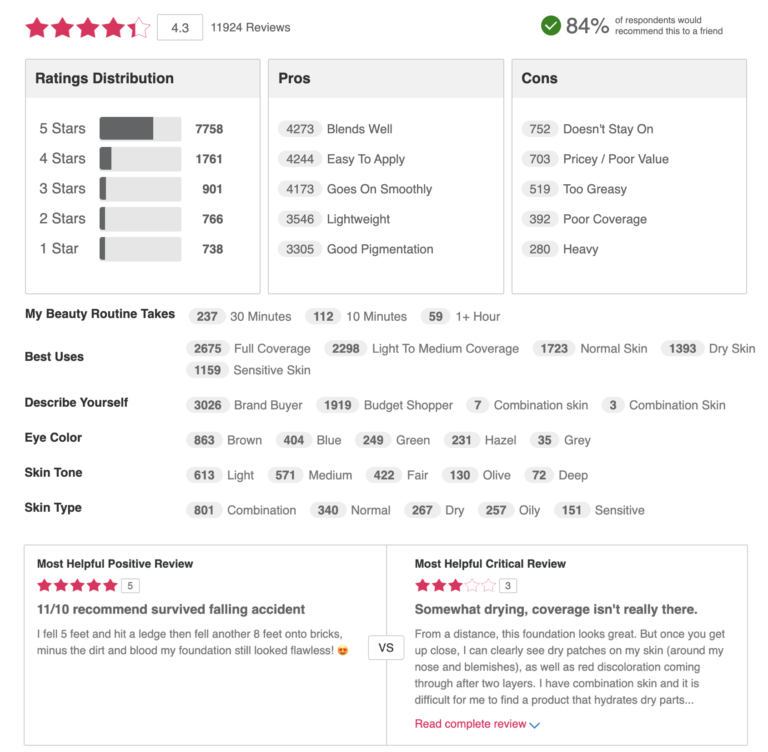
In this example, the shopper can see the average star rating, the number of reviews, the percentage of customers who would recommend the product, and how the reviews are distributed among the different star ratings. Visitors can click on each star rating to see only the reviews with that particular star rating. This particular snapshot also lets shoppers see the most liked positive review alongside the most liked negative review, which is a great way for visitors to quickly understand the upsides and downsides of this product. They can also quickly see the pros, cons, and best uses and click on any of those categories to see the reviews that speak to these features.
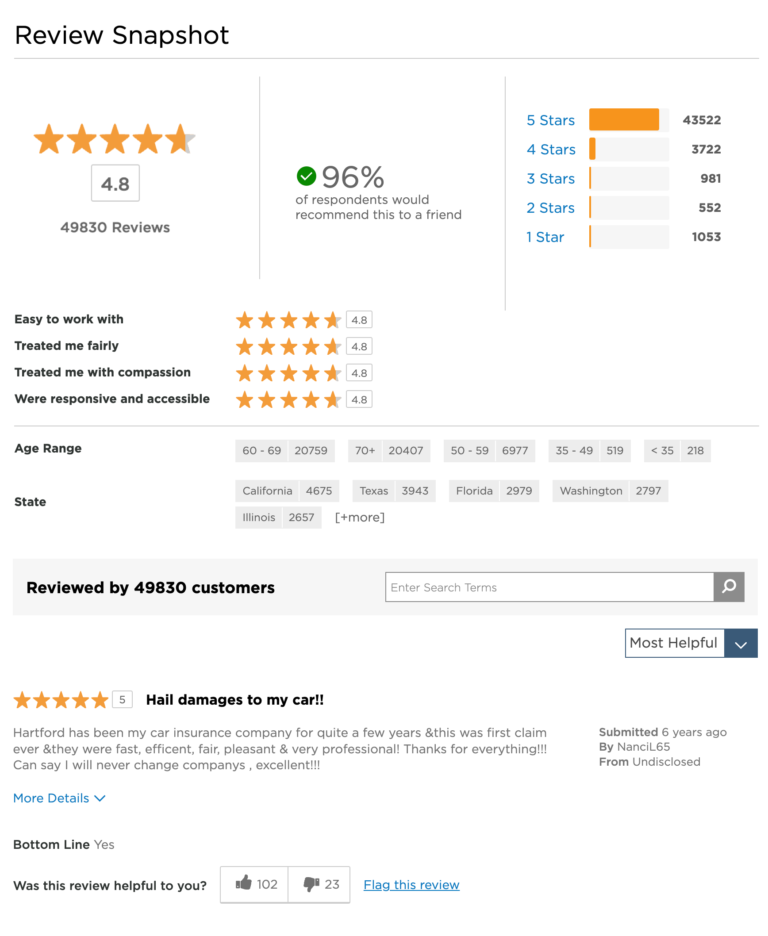
This review snapshot for a financial services brand includes many of the features of the other examples we shared. One unique thing about this display is that the brand asks reviewers to include their age range and state. Then, in the snapshot, they indicate the number of reviews available for each age range and state option. Shoppers can click on a specific state or age range to see content that matches these criteria.
Sort, Filter and Search Capabilities

Typically, a shopper won’t read every single review available for a given product. Instead, they want to quickly find the content that’s most relevant to them.

The best review displays include features that allow visitors to sort, filter and search to find relevant content.

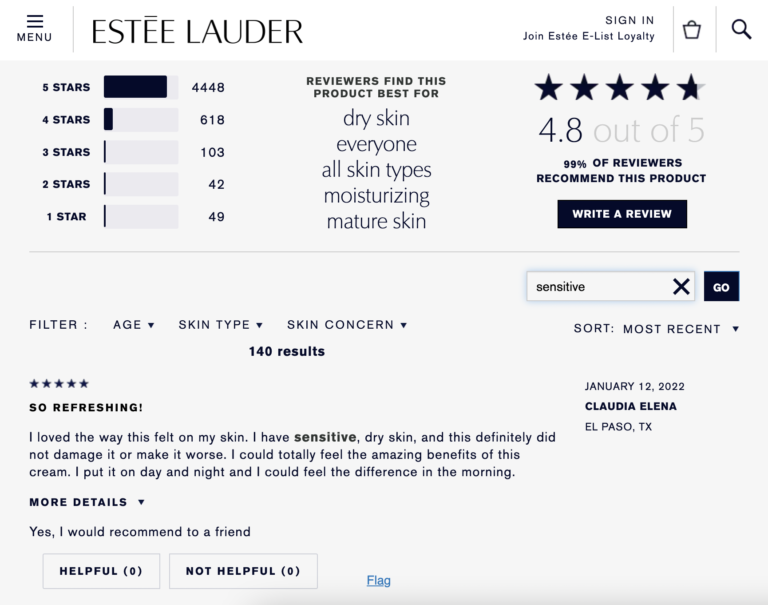
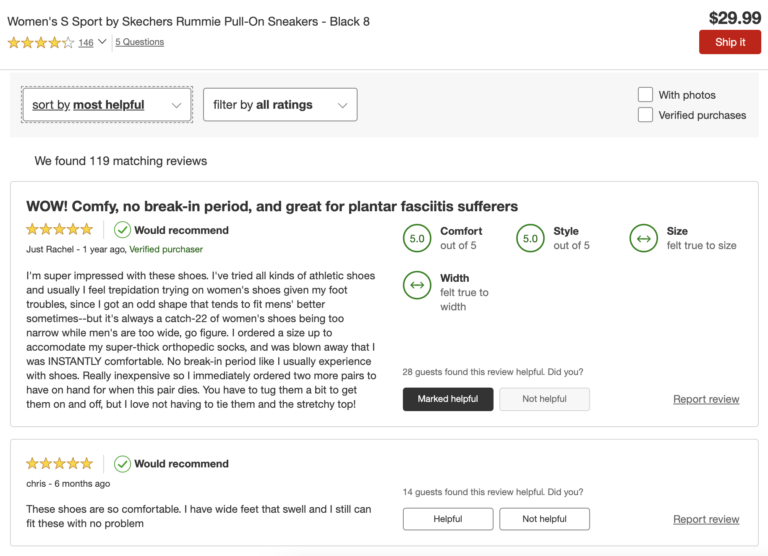
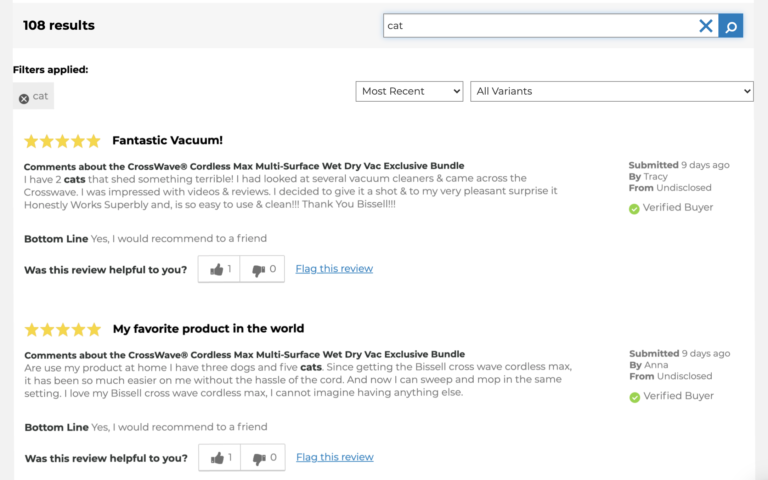
On this review display, the shopper can sort reviews by a number of different factors, including star rating, recency and the availability of imagery. They can also do a search for content that includes a specific word or phrase.
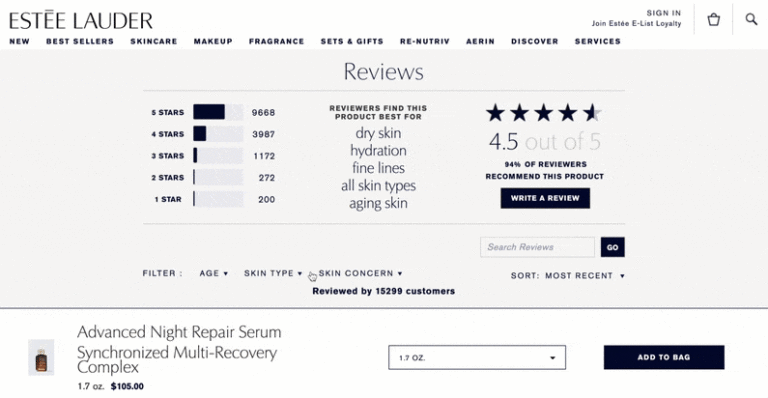
This beauty brand’s PDPs also feature robust sorting and filtering features. In addition to being able to filter by star rating, visitors can also filter by best use – as well as the age range and skin tones of the reviewers. 
Reviewer Details

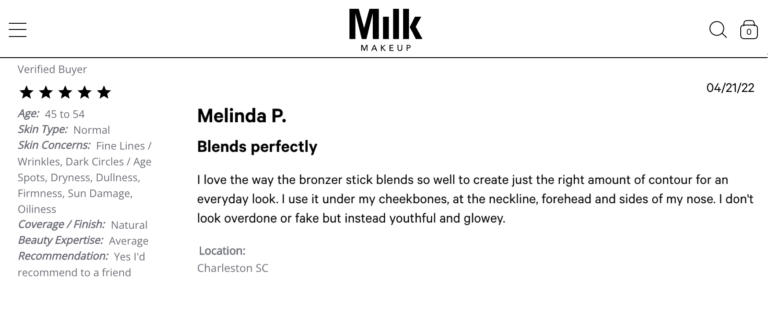
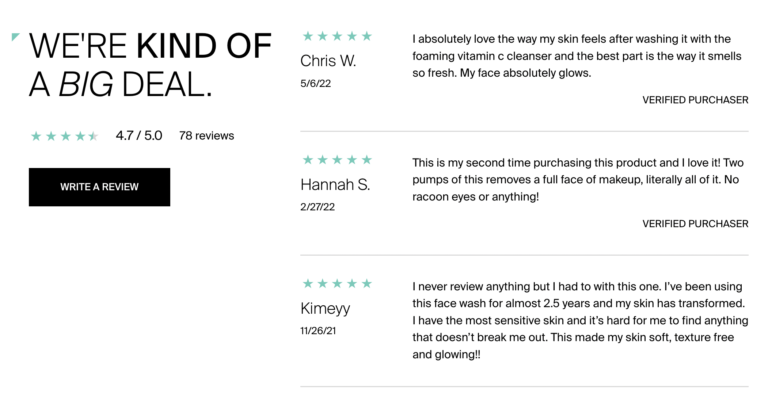
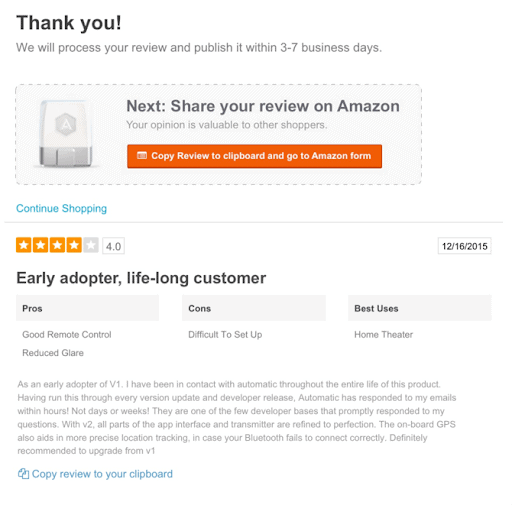
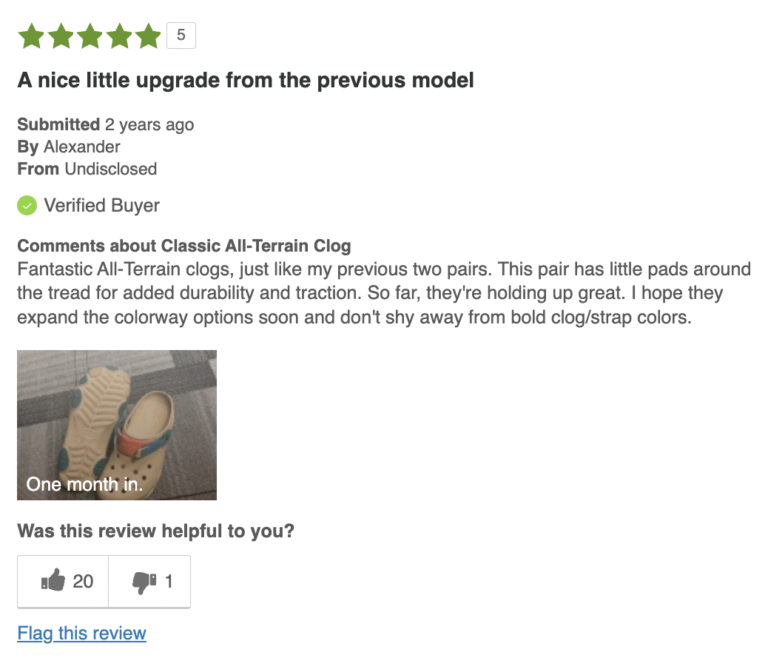
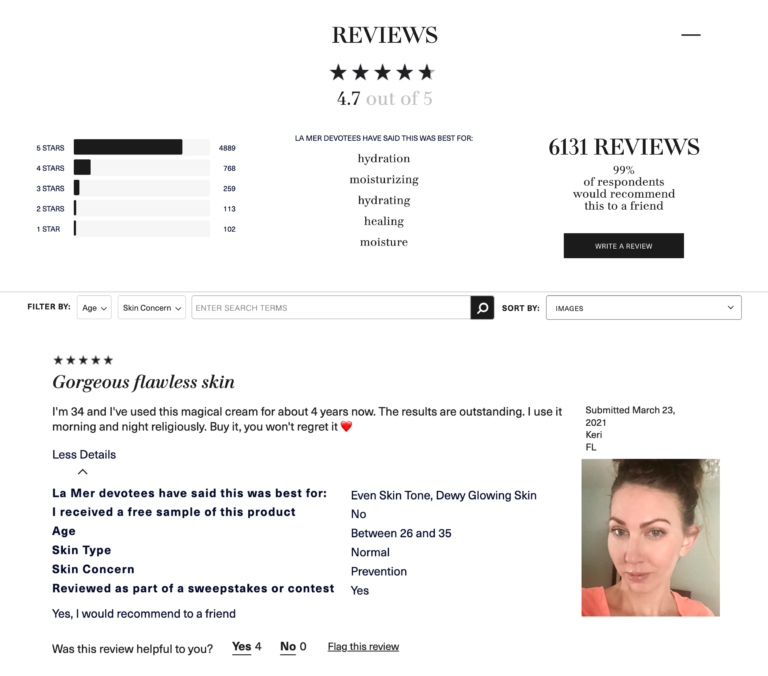
Consumers trust reviews because they’re written by others like them. In order to preserve authenticity and trust, it’s a best practice to include details about who wrote reviews. This might include badges indicating if a shopper is verified buyer or verified reviewer – or if they received a free sample. It might also include demographic details (including age and location) and personal preferences (such as style or flavor preferences) of the shopper.

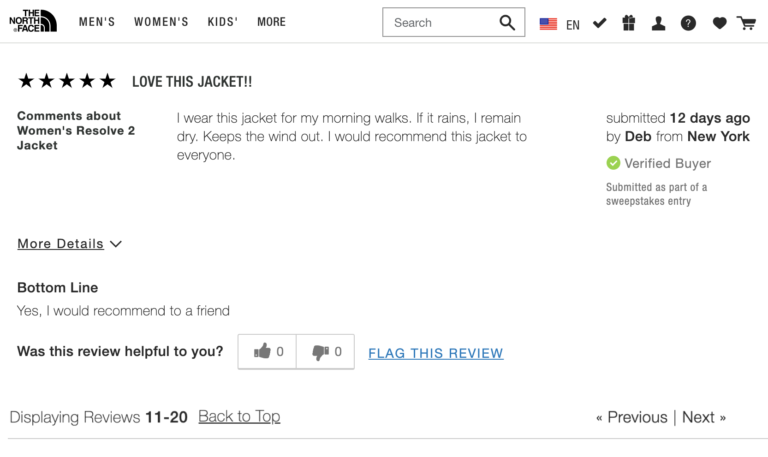
For example, it’s clear this review was written by a consumer in Florida who is between the ages of 26-35 and received a sweepstakes entry in exchange for writing a review.
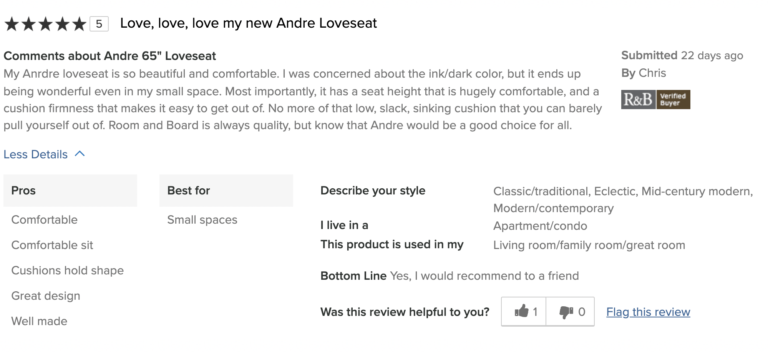
This review, on the other hand, was written by a customer who describes their style as modern – and is a verified buyer. We know for certain she purchased the product in question. 
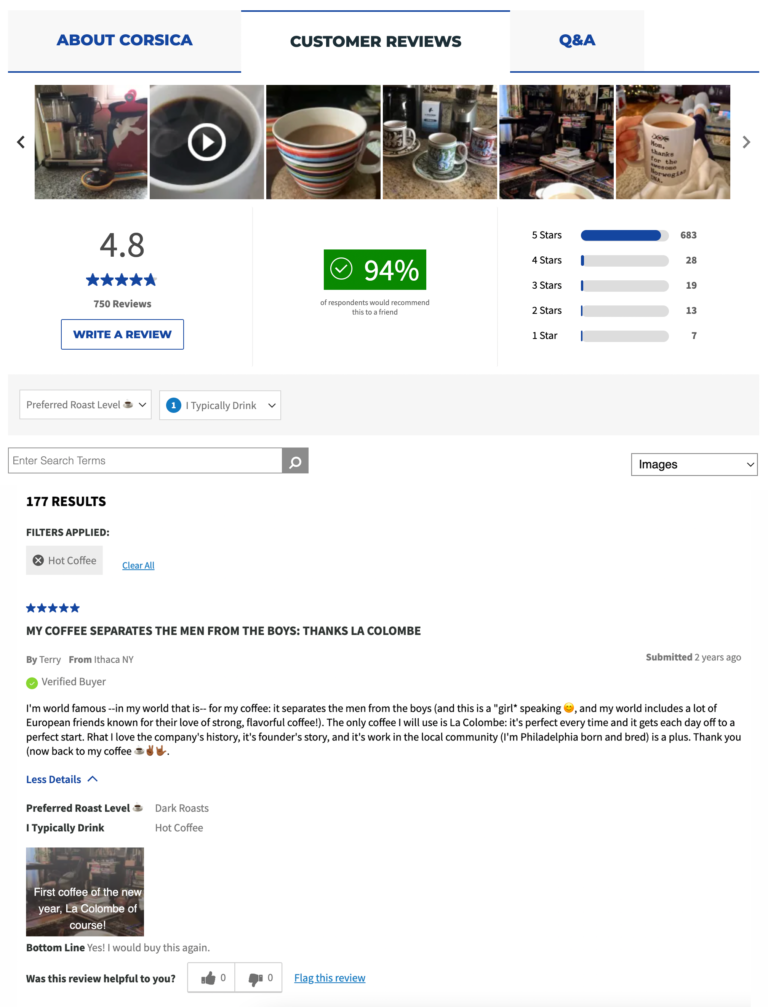
This review for a coffee product was written by a verified buyer from New York who prefers dark roasts and drinks hot coffee. 
10. Q&A

In-store shoppers can seek out a sales associate if they have questions. Obviously, online shoppers can’t. It’s essential for brands and retailers to provide a means for online shoppers to get their questions answered, as 55% of shoppers will abandon an online purchase if they can’t get a quick answer to a question. 

The best brands and retailers feature a questions and answers (Q&A) section on their product pages, which allows visitors to browse questions that have already been asked – and submit their own. It’s an important tool that helps online shoppers gain confidence – and it increases their likelihood of making a purchase…a lot. Research tells us that nearly all (99%) of consumers read Q&A at least occasionally, when it’s available. What’s more, there’s a 194.2% lift in conversion among visitors who interact with Q&A on a product page – making it the most impactful form of UGC on conversion. 

As an added bonus, the presence of Q&A is proven to increase traffic to product pages.

Q&A Display

Before submitting a question, many consumers browse through existing questions to see if someone has already asked something similar. It’s important to build a Q&A display that makes it easy for visitors to sift through existing questions. 

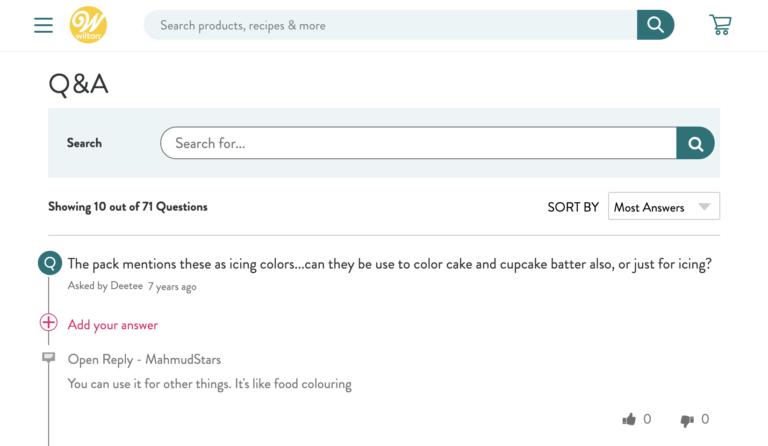
In this Q&A display, visitors can sort existing questions by factors including recency and number of answers. Shoppers can also easily search for questions that include certain keywords or phrases. 
Information about the Responder

Some brands and retailers answer all Q&A internally. Others allow answers from multiple sources, including product experts and consumers who already own the product in question.

For the sake of transparency, it’s important to indicate who it was that provided each answer. Previous research tells us 82% of shoppers pay attention to the small print detailing who provided a Q&A response. 

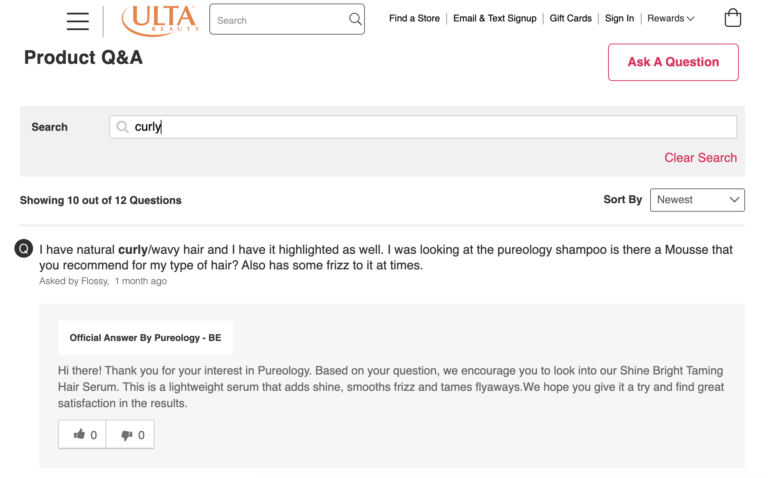
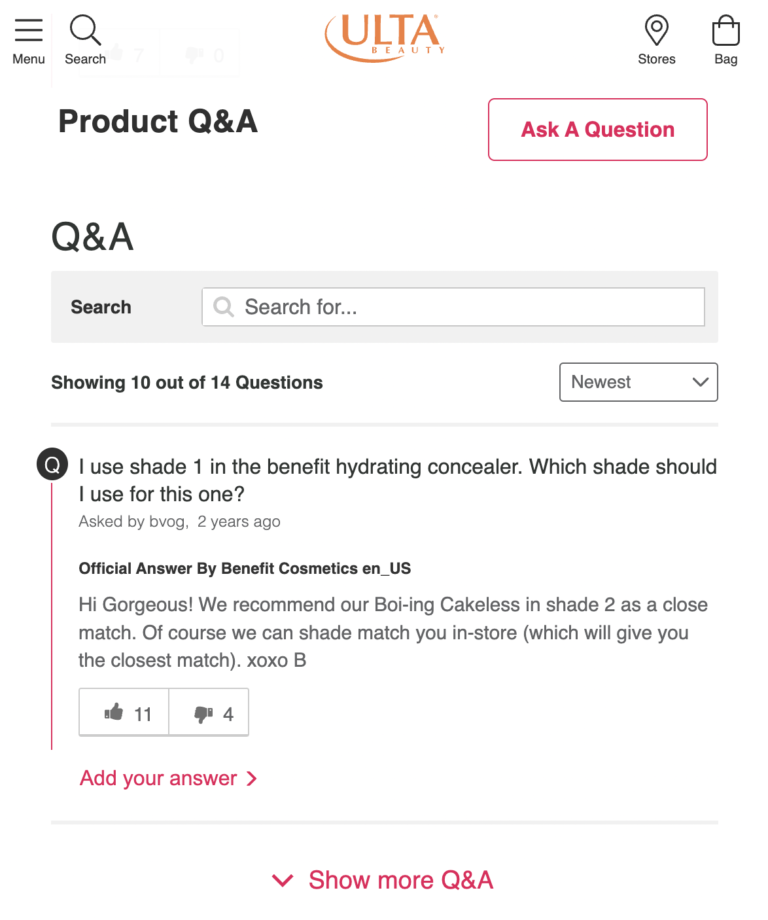
For example, this question submitted on a beauty retailer’s website was answered by the brand that makes the product.
Question Submission

If a visitor can’t find a similar question to theirs, they may submit their own. Our research found that 68% of shoppers have left a question in the Q&A section of a PDP. 

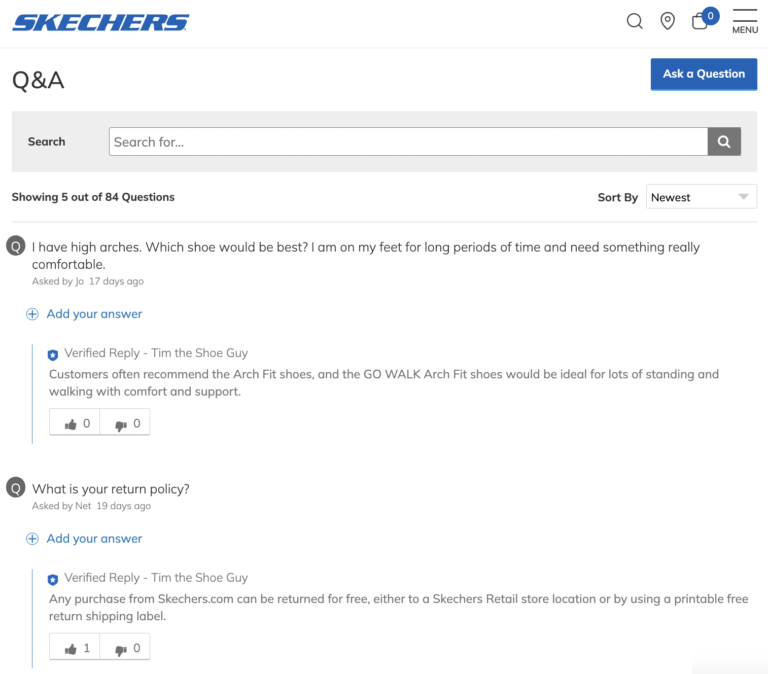
It’s key to make it easy for shoppers to submit their own questions. Our friends at Skechers find that the typical conversion rate among those who ask a question and receive an answer via Q&A is 80%! As such, they include a button to submit a question right at the top of the Q&A display.
Optimize Your PDPs

Landing on a product details page is the pivotal moment of truth. It’s on these pages that shoppers determine whether they’ll purchase a given product – or keep looking.

It’s key to ensure your PDPs are buld to convert. Of course, there’s no set PDP formula that guarantees increased conversion for all brands and retailers. Rather, it varies by brand and category, among other factors. 

However, the key ingredients we explored in this guide are a great starting point. 

It’s imperative to measure PDP performance on a regular basis. Then, use these insights to drive continuous optimization that drives even conversion. 

How COVID continues to impact how and where consumers shop for beauty products, according to research from 11,000+ shoppers.

Survey at a Glance:

The PowerReviews Meeting Beauty Shopper Digital Expectations in a Post-Pandemic World study is based on survey responses from 11,115 beauty shoppers across the United States (and is an update of our 2021 study, The Changing Face of the Beauty Shopper). Here’s a look at our key findings.

As We Return to “Normal,” Beauty Shoppers Continue to Embrace Buying Online
  • This year, nearly half (49%) of consumers say they buy more beauty products online now than they did prior to COVID, down just slightly from 53% in 2021.

  • The most popular place for online shoppers to begin the search for beauty products is a beauty retailer’s website (such as Ulta.com or Sephora.com); 58% say it’s their preference. Amazon is a distant second, with 19% of shoppers indicating it’s where they typically begin shopping for beauty products online.

  • Brick-and-mortar continues to thrive, with 97% of shoppers purchasing at least some beauty products each month in-store.
Consumers are Open to Trying New Beauty Products
  • When purchasing a habitual product, 96% of consumers are at least somewhat likely to also purchase a new-to-them product.
    Over half of consumers (52%) are more likely to try a new beauty product now than pre-COVID, up from 40% in 2021.

  • The most popular destination for purchasing unknown beauty products is a specialty retailer’s website; 36% say it’s where they typically go to buy new-to-them products.

  • 92% of consumers say that reviews are a factor they consider when accessing a new beauty product they’ve never purchased before. This is up significantly from 74% just a year ago.
Beauty Shoppers Rely on User-Generated Content
  • Nearly all shoppers (99%) read reviews at least sometimes when shopping online for beauty products. This is the case for 85% of consumers shopping in-store for beauty products.

  • 96% of consumers look for photos and videos from other consumers when shopping for beauty items online; 33% always do so.

  • 98% of those shopping for beauty products online read Q&A at least sometimes; 70% do so regularly or always.
Increasingly, Shoppers Seek Out Brands and Products That Align With Their Values
  • 34% of shoppers say it’s at least somewhat important to them that a beauty brand is Black-owned. And 46% plan to specifically purchase products in the future that are made by Black-owned beauty brands.

  • 85% of consumers indicate it’s at least somewhat important to them that a beauty product is made sustainable with natural ingredients (aka “clean”). 71% have plans to seek out and purchase more of these products in the future.

  • The fact that a beauty product is vegan is at least somewhat important to 51% of shoppers. 42% plan to purchase more vegan beauty products in the future.
Chapter 1

Introduction

COVID’s Impact on Beauty Shopping Habits is Lasting

Not long ago, the vast majority of beauty purchases were made in brick-and-mortar stores. There, shoppers had the opportunity to get recommendations from sales associates – and try out products prior to purchase. 

Then, consumers started getting comfortable purchasing beauty items online, leading to steady growth of beauty ecommerce. When the pandemic hit, that growth went into overdrive.

What do consumers’ beauty shopping habits look like now that we’re over two years into the pandemic? Recently, we surveyed more than 11,000 consumers in the U.S. to find out.

Chapter 2

Who We Surveyed

This report is based on a survey completed by 11,115 US consumers during April 2022. Here’s a closer look at who we surveyed.

Generations

Gen Z
(1997-present)
2%
Millennials
(1981-1996)
58%
Gen X
(1965-1980)
32%
Baby Boomers
(1946-1964)
8%

Type of Beauty Shopper

Beauty Novice
Just getting into the beauty space and curious what’s out there.
11%
Brand Loyalist
Mostly sticks to the products and brands that are tried and true.
14%
Beauty Enthusiast
Always searching for the next best beauty products and brands.
75%

Household Income

$0-$25,000
11%
$26,000-$50,000
20%
$51,000-$75,000
20%
$76,00-$100,000
16%
$100,000+
27%
Prefer not to say
6%

Total (Online and In-Store) Monthly Beauty Spend

$0
1%
$1-$50
27%
$51-$100
33%
$101-$200
24%
$201-$500
12%
$500+
3%
Chapter 3

The Lasting Impact of COVID on Beauty Habits

Last year, over half of consumers (54%) indicated they wore less makeup than they did prior to the pandemic. This year, just over a third (38%) say this is the case. This makes sense, as consumers are venturing out more than they did a year ago – and are more likely to use makeup when going out than when staying home. 

Interestingly, the percentage of consumers who focus more on skincare has grown. This year, 63% say they focus more on skincare than they did pre-COVID, compared to 56% who said this was the case a year ago. 

COVID Continues to Impact Beauty Habits
Do you wear less makeup now than pre-COVID?
2021
54%
2022
38%
Do you focus more on skincare now than pre-COVID?
2021
56%
2022
63%

COVID Impact on Beauty Spending Decreasing

This year, 27% of consumers say they spend less on beauty products now than they did pre-COVID – down significantly from 41% in 2021. Similarly, 25% say they spend more on beauty products, up from 21% who said this was the case in 2021. 

How COVID Impacts Beauty Spending: 2021 vs 2022
How has COVID impacted your overall beauty spending habits?
2021
I spend more on beauty products now compared to pre-COVID
21%
I spend less on beauty products now compared to pre-COVID
41%
The amount I spend on beauty products hasn’t changed
38%
2022
I spend more on beauty products now compared to pre-COVID
25%
I spend less on beauty products now compared to pre-COVID
27%
The amount I spend on beauty products hasn’t changed
49%

Interestingly, beauty brand loyalists are most likely to have decreased their spending on beauty products post-COVID. Beauty enthusiasts are the group most likely to have ramped up their beauty spending post-COVID.

The Impact of COVID on Beauty Shopping by Shopper Type
How has COVID impacted your overall beauty spending habits?
Beauty Brand Loyalist
I spend more on beauty products now compared to pre-COVID
11%
I spend less on beauty products now compared to pre-COVID
40%
The amount I spend on beauty products hasn’t changed
49%
Beauty Enthusiast
I spend more on beauty products now compared to pre-COVID
28%
I spend less on beauty products now compared to pre-COVID
23%
The amount I spend on beauty products hasn’t changed
49%
Beauty Novice
I spend more on beauty products now compared to pre-COVID
18%
I spend less on beauty products now compared to pre-COVID
35%
The amount I spend on beauty products hasn’t changed
47%
Chapter 4

Beauty Spending Across Channels

At the start of the pandemic, many shoppers started spending more money online – and less in-store. This was the case across many categories, including beauty.

More than two years later, where are shoppers spending their beauty budgets? 

COVID-Influenced Online Beauty Spending Habits are Holding

This year, 49% of consumers say they buy more beauty products online now than they did prior to COVID, despite widely available vaccines and a general desire to return to “normal life.” This is down just slightly from last year. 

It seems that online beauty shopping habits established at the start of the pandemic are here to stay.

COVID is Still Influencing Online Shopping Habits
How has COVID impacted your ONLINE beauty purchasing habits?
2021
I buy less beauty products online now compared to before COVID
13%
I buy more beauty products online now compared to before COVID
53%
My beauty purchasing habits have not changed
34%
2022
I buy less beauty products online now compared to before COVID
12%
I buy more beauty products online now compared to before COVID
49%
My beauty purchasing habits have not changed
39%

As was the case last year, consumers with higher incomes are more likely to indicate they spend more money online on beauty products now than they did prior to the pandemic.

Higher Income Consumers are More Likely to Have Ramped Up Their Online Beauty Spending Post-Pandemic
How has COVID impacted your ONLINE beauty purchasing habits?
$0 - $25,000
I buy less beauty products online now
22%
I buy more beauty products online now
35%
My beauty purchasing has not changed
43%
$26,000 - $50,000
I buy less beauty products online now
13%
I buy more beauty products online now
46%
My beauty purchasing has not changed
41%
$51,000 - $75,000
I buy less beauty products online now
12%
I buy more beauty products online now
49%
My beauty purchasing has not changed
39%
$76,000 - $100,000
I buy less beauty products online now
8%
I buy more beauty products online now
52%
My beauty purchasing has not changed
40%
$100,000+
I buy less beauty products online now
8%
I buy more beauty products online now
57%
My beauty purchasing has not changed
35%
Prefer not to say
I buy less beauty products online now
15%
I buy more beauty products online now
39%
My beauty purchasing has not changed
46%

Many consumers have ramped up their online beauty spending. But what does this translate to in terms of actual dollars spent? 

In line with last year, the largest portion of shoppers (42%) spend between $1 and $50 online each month on beauty products. However, a significant portion spend between $51 and $100 (28%) and over $101 (24%). 

Monthly Online Beauty Spending
Roughly how much money do you spend on ONLINE beauty purchases per month?
2019
$0
23%
$1-$50
61%
$51-$100
14%
$101+
2%
2021
$0
7%
$1-$50
44%
$51-$100
26%
$101+
23%
2022
$0
6%
$1-$50
42%
$51-$100
28%
$101+
24%

A Growing Portion of Online Shoppers Start Shopping on a Beauty Retailer’s Website

Beauty retailer sites – such as Ulta.com and Sephora.com – remain the most popular starting point for online beauty shoppers. This year, 58% of consumers most commonly start the online purchase journey for beauty products on a beauty retailer site, up from 44% in 2021. 

Amazon continues to be less popular among beauty shoppers. This year, 19% indicate they most often begin shopping for beauty products on the ecommerce giant, down from 22% in 2021. 

Amazon is often perceived as unbeatable. But by providing engaging experiences to online beauty shoppers, it’s clear brands and retailers can compete, and win. 

Where Online Beauty Shoppers Start the Purchase Journey
When shopping ONLINE, where do you most often begin shopping for beauty products?
2019
Beauty retailer’s website (Ulta, Sephora)
16%
Amazon
47%
Brand’s website (Benefit, Glossier)
11%
Mass retailer’s website (Target, Walmart)
13%
Department store website (Nordstrom, Macys)
7%
Social media platform
3%
Other
3%
2021
Beauty retailer’s website (Ulta, Sephora)
44%
Amazon
22%
Brand’s website (Benefit, Glossier)
9%
Mass retailer’s website (Target, Walmart)
13%
Department store website (Nordstrom, Macys)
3%
Social media platform
5%
Other
4%
2022
Beauty retailer’s website (Ulta, Sephora)
58%
Amazon
19%
Brand’s website (Benefit, Glossier)
7%
Mass retailer’s website (Target, Walmart)
6%
Department store website (Nordstrom, Macys)
3%
Social media platform
3%
Other
4%

In-Store Beauty Shopping is Alive and Well

Beauty ecommerce continues to grow. However, that doesn’t mean in-store beauty shopping is a thing of the past. 

This year, the largest portion of consumers (52%) spend between $1 and $50 each month on in-store beauty purchases. However, the majority spend between $51 and $100 (28%) and $101+ (17%). 

It’s clear brick-and-mortar stores continue to be valuable to beauty shoppers. In fact, as we’ll explore later, physical stores are a destination for many beauty shoppers, whether they’re stocking up on tried-and-true items or looking to try something new. 

Monthly In-Store Beauty Spending
Roughly how much money do you spend on IN-STORE beauty purchases per month?
2019
$0
5%
$1-$50
74%
$51-$100
18%
$101+
3%
2021
$0
5%
$1-$50
54%
$51-$100
23%
$101+
18%
2022
$0
3%
$1-$50
52%
$51-$100
28%
$101+
17%
Chapter 5

The Growing Role of User-Generated Content in Beauty Shopping

By now, the importance of user-generated content across all product categories is quite clear. But how are beauty shoppers leveraging UGC to make better purchase decisions?

Beauty Shoppers Value Many Forms of User-Generated Content

User-generated content can take many forms – from star ratings to written reviews to photos and videos – among others. 

Which of these forms of UGC do beauty shoppers pay attention to?

Ratings are the top consideration; three-quarters of beauty shoppers indicate they pay attention to a product’s average star rating. A customer’s opinion on specific extra details relevant to the product (aka the body of a review) are a close second, with 74% of beauty shoppers telling us this is something they pay attention to. 

A good portion of beauty shoppers also pay attention to review volume (68%), review recency (54%), customer-submitted photos (52%) and videos (25%), and customer-answered questions and answers (50%).

Most Important Elements of UGC
When considering whether to buy a beauty item, which of the following do you pay attention to?
Average star rating
75%
Customer opinion on specific extra details relevant to the product (skin type of reviewer, color of product, etc)
74%
Volume of reviews (the more reviews, the more credible it seems)
68%
Recency of reviews (the more recent a review is published, the more credible it seems)
54%

What types of information do beauty shoppers hope to find by reading reviews and consuming other types of UGC?

Beauty Shoppers Seek out Myriad Types of Information from UGC
When seeking out information provided by other shoppers (i.e. through reviews, images, videos etc.), which of the following do you pay attention to?
Consistency/quality of the product
82%
What the product looks like on a person in real life
75%
Skin type and effect on skin
74%
How long the product lasted (ie a few hours vs all day)
68%
Skin tone (and whether the shade worked for them)
68%
Other products that complement it
26%
Scent
25%

Now, let’s take a closer look at the types of UGC consumers turn to to get the information they need to make confident beauty purchases. 

Online Beauty Shoppers Depend on Reviews

Consistent with last year’s findings, nearly all (99%) of consumers read ratings and reviews at least sometimes when shopping for beauty products online. 60% do so always, up from 54% last year.

Online and In-Store Beauty Shoppers Alike Consult Ratings and Reviews
How often do you read ratings and reviews when shopping for beauty items?
2021
Online
Always
54%
Sometimes
45%
Never
1%
In-Store
Always
30%
Sometimes
55%
Never
15%
2022
Online
Always
60%
Sometimes
39%
Never
1%
In-Store
Always
30%
Sometimes
55%
Never
15%

Of note, Millennials and Gen Z’ers are more likely than their more senior counterparts to always read reviews when shopping for beauty products online.

Younger Online Beauty Shoppers Consult Reviews More Regularly Than Their Older Counterparts
How often do you read ratings and reviews when shopping for beauty items online?
Gen Z
Always
76%
Sometimes
23%
Never
1%
Millennials
Always
66%
Sometimes
33%
Never
1%
Gen X
Always
52%
Sometimes
1%
Never
47%
Boomers
Always
41%
Sometimes
56%
Never
3%

Beauty Shoppers Consult Reviews In-Store, Too

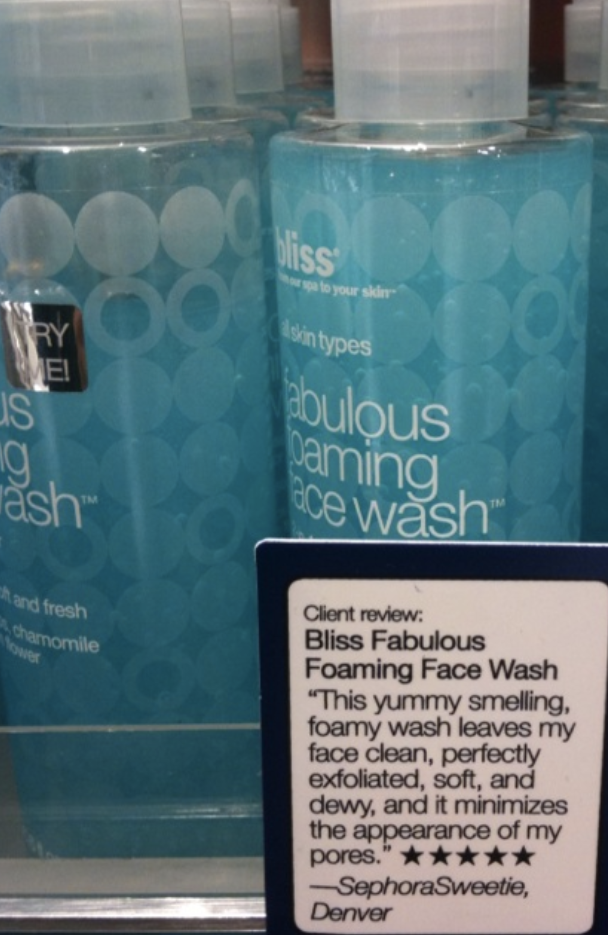
Reviews are also important for those making beauty purchases within the four walls of a brick-and-mortar store. 85% of beauty consumers read reviews at least sometimes when shopping in-store; 30% always do.

Younger consumers are even more likely to always consult reviews when shopping for beauty products in a physical store.

Younger In-Store Beauty Shoppers Consult Reviews More Regularly Than Their Older Counterparts
How often do you read ratings and reviews when shopping for beauty items in-store?
Gen Z
Always
40%
Sometimes
44%
Never
16%
Millennials
Always
34%
Sometimes
53%
Never
13%
Gen X
Always
26%
Sometimes
57%
Never
17%
Boomers
Always
22%
Sometimes
56%
Never
22%
Where In-Store Beauty Shoppers Prefer to Find Reviews
How do you prefer to see reviews while you’re shopping IN A STORE?
2021
On the brand or retailer site on my phone
45%
Through the app
23%
On in-store displays
22%
Phone notifications when entering the store
4%
Other
6%
2022
On the brand or retailer site on my phone
47%
Through the app
24%
On in-store displays
21%
Phone notifications when entering the store
3%
Other
5%

Beauty Shoppers Value Visual Content

Beauty products work differently for different people. For example, a moisturizer that works well for those with dry skin might not meet the needs of those with oily skin.

When shopping online, it can be difficult for a shopper to determine whether a given product will address their specific needs. However, finding photos and videos from other consumers with similar characteristics can help.

Nearly all (96%) of consumers seek out photos and videos from other consumers when shopping for beauty items online. A third (33%) always do so. 

Beauty Shoppers Frequently Seek Out Visual Content from Others Like Them
How often do you seek out images and videos submitted by previous customers while shopping for beauty items online?
Always
33%
Regularly
34%
Sometimes
29%
Never
4%
Young Beauty Shoppers Seek Out User-Generated Visual Content More Frequently
How often do you seek out images and videos submitted by previous customers while shopping for beauty items online?
Gen Z
Always
57%
Regularly
26%
Sometimes
14%
Never
3%
Millennials
Always
39%
Regularly
35%
Sometimes
23%
Never
3%
Gen X
Always
24%
Regularly
35%
Sometimes
36%
Never
5%
Boomers
Always
15%
Regularly
26%
Sometimes
45%
Never
14%

Online Beauty Shoppers Depend on Q&A

When a consumer is shopping for beauty products in a brick-and-mortar store, they have the opportunity to consult with a store associate to ask questions and get recommendations. That’s not the case for online beauty shoppers. 

To bridge the gap, many brands and retailers have a questions and answers (Q&A) section on product pages that allow shoppers to read questions that have already been asked – and submit their own. 

Today, the vast majority (98%) read Q&A at least sometimes; 70% do so regularly or always.

Most Online Beauty Shoppers Read Q&A
How often do you read Q&A (questions submitted by other shoppers and answered by the brand and/or other shoppers) when shopping for beauty items online?
Always
29%
Regularly
41%
Sometimes
28%
Never
2%

Younger shoppers are particularly frequent users of Q&A. Over a third (35%) of Gen Z’ers and 31% of Millennials always read Q&A when shopping online for beauty products.

Younger Shoppers Consult Q&A More Frequently
How often do you read Q&A (questions submitted by other shoppers and answered by the brand and/or other shoppers) when shopping for beauty items online?
Gen Z
Always
35%
Regularly
33%
Sometimes
29%
Never
3%
Millennials
Always
31%
Regularly
40%
Sometimes
27%
Never
2%
Gen X
Always
27%
Regularly
44%
Sometimes
27%
Never
2%
Boomers
Always
24%
Regularly
42%
Sometimes
30%
Never
4%
Chapter 6

Where & How Shoppers Purchase Tried-and-True Beauty Products

Most beauty shoppers have certain products they buy time and again. Maybe it’s a facial cleanser they’ve used for years or a mascara they know works great. Let’s explore where (and how) consumers are stocking up on their tried-and-true beauty products.

Beauty Retailer Websites Most Popular Destination for Stocking Up on Familiar Products; Amazon and Mass Retail Store Popularity in Decline for These Products

Consumers have many options when it’s time to replenish their go-to beauty products. Where are they most likely to buy? 

Specialty beauty retailers’ websites continue to gain traction. This year, the largest portion of consumers (35%) turn to a website such as Ulta.com or Sephora to restock on their favorite beauty items. This is up significantly from 22% in 2021.

As above where we ask beauty shoppers where they start their online shopping journey, Amazon is a distant second – with 16% of consumers saying it’s where they typically purchase familiar beauty items.

In addition, a significant portion of shoppers are stocking up on their favorite beauty items in-store. 15% say they typically purchase beauty products they’ve already tried at a special beauty retailer’s store (such as Ulta or Sephora), and 13% indicate mass retailer stores like Target and Walmart are their go-to for replenishments. 

Where Consumers Shop for Tried-and-True Beauty Products
When purchasing a beauty product you’ve already tried, where do you typically go to buy?
2019
Beauty retailer’s website (Ulta, Sephora)
11%
Amazon
32%
Beauty retailer’s store (Ulta, Sephora)
5%
Mass retailer’s store (Target, Walmart)
28%
Brand’s website (Benefit, Glossier)
6%
Mass retailer’s website (Target, Walmart)
18%
2021
Beauty retailer’s website (Ulta, Sephora)
22%
Amazon
17%
Beauty retailer’s store (Ulta, Sephora)
18%
Mass retailer’s store (Target, Walmart)
21%
Brand’s website (Benefit, Glossier)
10%
Mass retailer’s website (Target, Walmart)
12%
2022
Beauty retailer’s website (Ulta, Sephora)
35%
Amazon
16%
Beauty retailer’s store (Ulta, Sephora)
15%
Mass retailer’s store (Target, Walmart)
13%
Brand’s website (Benefit, Glossier)
11%
Mass retailer’s website (Target, Walmart)
10%

Beauty Shoppers Cite Many Reasons for Choosing the Channels They Do

We know where consumers are going to stock up on tried-and-true beauty products. But what’s the reason they choose one channel over another? There’s not a single factor behind a shopper choosing a specific channel to purchase known products. Rather, it’s the overall experience provided by that channel.

Why Consumers Purchase Habitual Products from Specific Channels
Why do you choose to purchase products you’ve already tried there?
Convenience
64%
Low Prices
57%
Fast Delivery
55%
I Want the Loyalty Points
55%
Free Shipping
54%

Consumers are Likely to Purchase New (to Them) Beauty Products Alongside Habitual Items

When beauty shoppers are stocking up on their favorites, do they simply grab what they need – and then head to the checkout?

Not always.

Nearly all (96%) of consumers say that when they’re purchasing a habitual beauty product, they’re at least somewhat likely to also buy a new product within the same purchase – up slightly from last year. Nearly half (43%) indicate they’re very likely to do so.

Many Consumers Purchase Habitual and Unknown Beauty Products Within the Same Transaction
When purchasing a habitual beauty product (a product you typically buy/need) how likely are you to also buy a new beauty product during the same purchase?
2019
Very likely
27%
Somewhat likely
55%
Unlikely
18%
2021
Very likely
40%
Somewhat likely
54%
Unlikely
6%
2022
Very likely
43%
Somewhat likely
53%
Unlikely
4%

The likelihood of purchasing a new beauty product alongside a tried-and-true one is particularly high among those who identify as beauty enthusiasts. Half (50%) of those in this group say they’re very likely to do so, compared to 21% of beauty brand loyalists and 24% of beauty novices.  

Likelihood of Purchasing a New Beauty Product and a Habitual One Within the Same Transaction by Shopper Type
When purchasing a habitual beauty product (a product you typically buy/need) how likely are you to also buy a new beauty product during the same purchase?
Beauty Brand Loyalist
Very likely
21%
Somewhat likely
67%
Unlikely
12%
Beauty Enthusiast
Very likely
50%
Somewhat likely
48%
Unlikely
2%
Beauty Novice
Very likely
24%
Somewhat likely
68%
Unlikely
8%

In addition, younger consumers are more likely to add a new (to them) beauty product to the same shopping basket as a tried-and-true product. 53% of Gen Z’ers and 47% of Millennials indicate they’re very likely to do so, compared to 39% of Gen X’ers and just over a quarter (26%) of Boomers. 

Likelihood of Purchasing a New Beauty Product and a Habitual One Within the Same Transaction by Generation
When purchasing a habitual beauty product (a product you typically buy/need) how likely are you to also buy a new beauty product during the same purchase?
Gen Z
Very likely
53%
Somewhat likely
41%
Unlikely
6%
Millennials
Very likely
47%
Somewhat likely
50%
Unlikely
3%
Gen X
Very likely
39%
Somewhat likely
56%
Unlikely
5%
Boomers
Very likely
26%
Somewhat likely
65%
Unlikely
9%
Chapter 7

How Consumers Discover and Buy New-to-Them Beauty Products

While there are certain beauty products consumers purchase time and again, many are also open to trying out new products.

Consumers are Very Open to Buying New-to-Them Beauty Products

For many consumers, the willingness to try new products has increased since the start of the pandemic. 

Today, over half (52%) of consumers say they’re more likely to try a new beauty product now than pre-COVID. This is up significantly from last year, when 40% of consumers felt this way.

COVID Has Increased Consumers’ Willingness to Try New (to Them) Beauty Products
Are you more likely to try new-to-you beauty products now than pre-Covid?
2021
40%
2022
52%

In fact, new beauty products account for a significant portion of consumers’ beauty spending – whether they’re shopping online or in a brick-and-mortar store. 

A third of shoppers say that new (to them) beauty products account for 26-50% of their online beauty spending. Another third indicate new products make up 1-25% of their total online beauty spending.

New products make up a significant portion of physical shopping baskets, too. The largest portion of shoppers (39%) say that between 26% and 50% of the beauty products they purchase in a brick-and-mortar store are items they’ve never tried before. 

A Significant Portion of Beauty Spending (Both Online and In-Store) is on Unfamiliar Products
Roughly what percentage of your beauty purchases are for beauty products you’ve never tried before?
2021
Online
0%
9%
1-25%
34%
26-50%
28%
51-75%
20%
76-100%
9%
In-Store
0%
9%
1-25%
41%
26-50%
31%
51-75%
15%
76-100%
4%
2022
Online
0%
7%
1-25%
33%
26-50%
33%
51-75%
20%
76-100%
7%
In-Store
0%
3%
1-25%
37%
26-50%
39%
51-75%
17%
76-100%
4%

Specialty Beauty Retailer Website are the Top Destination for Consumers Purchasing New-to-Them Beauty Products

Consumers are spending a significant chunk of their beauty budget on products they’ve never purchased before. Where are they most often going to buy these unknown items? 

A common theme running through our survey results, the most popular place to purchase an unknown beauty product is a specialty beauty retailer’s website. Over a third (36%) of consumers indicate this is where they typically go to buy new-to-them beauty products, up from 24% who said this was their go-to in 2021. 

Amazon and specialty beauty retailer stores are tied for second, with 14% indicating each of these places is where they typically go to buy new beauty products. Brand websites – such as benefitcosmetics.com and glossier.com – are close behind, with 12% of consumers indicating these types of websites are where they go to purchase products they’ve never tried before. 

Where Online Beauty Shoppers Start the Purchase Journey
When shopping ONLINE, where do you most often begin shopping for beauty products?
2019
Specialty beauty retailer website (Ulta.com, Sephora.com)
8%
Amazon
37%
Speciality beauty retailer store (Ulta, Sephora)
5%
Brand website (benefitcosmetics.com, glossier.com)
8%
Mass retailer store (Target, Walmart)
19%
Mass retailer website (Target.com, Walmart.com)
13%
Brand store (MAC Cosmetics, Lush)
6%
Department store (Macy’s, Nordstrom)
3%
Department store website (Macys.com, Nordstrom.com)
1%
2021
Specialty beauty retailer website (Ulta.com, Sephora.com)
24%
Amazon
18%
Speciality beauty retailer store (Ulta, Sephora)
17%
Brand website (benefitcosmetics.com, glossier.com)
11%
Mass retailer store (Target, Walmart)
15%
Mass retailer website (Target.com, Walmart.com)
8%
Brand store (MAC Cosmetics, Lush)
3%
Department store (Macy’s, Nordstrom)
3%
Department store website (Macys.com, Nordstrom.com)
1%
2022
Specialty beauty retailer website (Ulta.com, Sephora.com)
36%
Amazon
14%
Speciality beauty retailer store (Ulta, Sephora)
14%
Brand website (benefitcosmetics.com, glossier.com)
12%
Mass retailer store (Target, Walmart)
9%
Mass retailer website (Target.com, Walmart.com)
8%
Brand store (MAC Cosmetics, Lush)
3%
Department store (Macy’s, Nordstrom)
3%
Department store website (Macys.com, Nordstrom.com)
1%

Reviews Give Shoppers Confidence to Purchase New Products

If a consumer purchases a habitual product, they know exactly what to expect. However, when they venture out to try a new-to-them product, there’s a certain amount of risk involved. This is especially true when they’re shopping online and don’t have the opportunity to see and try out a product before making a purchase.

However, there are certain factors that boost their confidence – and their likelihood to give a new product a try. Chief among them? Product reviews.

Nearly all (92%) of consumers say that reviews are a factor they rely on for information when accessing a new beauty product they’ve never purchased before – up significantly from 74% in 2021.

In fact, the top five factors that consumers consider most when purchasing new beauty products have remained the same year-over-year. However, it’s interesting to note that the percentage of consumers who rely on each factor has increased significantly. 

Top Motivators for Trying New Beauty Products
2021
Ratings and Reviews
74%
Recommendations from family and friends
47%
Social media
45%
Trusted product name, packaging and/or description
40%
Price
37%
2022
Ratings and Reviews
92%
Recommendations from family and friends
70%
Social media
57%
Trusted product name, packaging and/or description
55%
Price
52%
Chapter 8

How Influencers Impact Consumers’ Beauty Purchases

For many beauty brands, influencer marketing is becoming a growing line item in the budget. According to a report from Influencer Marketing Hub, more than three-quarters of brand marketers plan to dedicate a budget to influencer marketing this year. In fact, the influencer marketing industry is expected to grow to $16.4 billion in 2022. 

But how much of an impact do influencers have on beauty shoppers? 

Younger Shoppers are More Swayed by Influencers

Overall, 61% of consumers indicate they’re swayed by the influencers they follow to buy beauty products, up from 56% last year. Millennial (68%) and Gen Z (74%) shoppers are even more likely to be swayed by beauty influencers.  

Influencers Sway Beauty Shoppers Across Generations
Are you swayed by the influencers you follow to buy beauty products?
2021
Overall
56%
Gen Z
74%
Millennials
66%
Gen X
50%
Boomers
34%
2022
Overall
61%
Gen Z
74%
Millennials
68%
Gen X
54%
Boomers
37%

Beauty enthusiasts are particularly swayed by influencers, when compared to beauty brand loyalists and beauty novices. This makes sense, given they are generally more willing to try new products. 

The Impact of Beauty Influencers by Shopper Type
Are you swayed by the influencers you follow to buy beauty products?
Beauty Brand Loyalist
2021
41%
2022
58%
Beauty Enthusiast
2021
63%
2022
67%
Beauty Novice
2021
46%
2022
47%

Beauty Shoppers Trust Their Favorite Influencers

It’s easy to assume that beauty shoppers place more trust in influencers with a large following. But is this actually true?

Not for the majority of beauty shoppers. 

Over half (53%) of shoppers say they trust the influencers they’re loyal to – no matter their follower count. 12% indicate they trust micro-influencers (those with less than 100,000 followers) the most, while a mere 6% say they trust macro-influencers (those with more than 100,000 followers) the most.

The remaining 28% indicate they are more willing to trust beauty suggestions from people they actually know. Across the board, these percentages remain largely unchanged from last year. 

The Impact of Beauty Influencers by Shopper Type
Are you swayed by the influencers you follow to buy beauty products?
2021
It doesn’t matter how many followers an influencer has. I trust the ones I am loyal to no matter their follower count
52%
I am more willing to trust beauty suggestions from people I personally know
32%
Micro influencers with less than 100,000 followers
11%
Macro influencers with more than 100,000 followers
5%
2022
It doesn’t matter how many followers an influencer has. I trust the ones I am loyal to no matter their follower count
53%
I am more willing to trust beauty suggestions from people I personally know
29%
Micro influencers with less than 100,000 followers
12%
Macro influencers with more than 100,000 followers
6%
Chapter 9

How Shoppers’ Values Influence Their Beauty Purchases

Consumers weigh a number of factors when purchasing beauty products, including price, brand, quality and ease of use – among others. But these days, many shoppers also seek out beauty brands and products that align with their values. 

The Importance of Black Ownership to Beauty Shoppers
How important is it to you that a beauty brand is Black-owned when considering a purchase?
Overall
Very important
11%
Somewhat important
23%
Makes no difference
66%
Gen Z
Very important
18%
Somewhat important
32%
Makes no difference
50%
Millennials
Very important
12%
Somewhat important
26%
Makes no difference
62%
Gen X
Very important
10%
Somewhat important
18%
Makes no difference
72%
Boomers
Very important
6%
Somewhat important
15%
Makes no difference
79%

In addition, 46% of shoppers say they specifically plan to purchase products in the future that are made by Black-owned beauty brands, down slightly from 50% a year ago. Again this year, younger shoppers are more likely to indicate they have plans to purchase from Black-owned beauty brands. 

Many Consumers Plan to Purchase from Black-Owned Beauty Brands in the Future
Do you specifically plan to buy products in the future that are made by Black-owned beauty brands?
2021
Overall
50%
Gen Z
75%
Millennials
58%
Gen X
44%
Boomers
31%
2022
Overall
46%
Gen Z
58%
Millennials
50%
Gen X
40%
Boomers
36%

Of note, beauty enthusiasts are significantly more likely to have plans to support Black-owned beauty brands in the future, when compared to beauty loyalists and beauty novices. This makes sense, as in general, beauty enthusiasts are more willing to experiment and try out new products.

Beauty Enthusiasts are More Likely to Seek Out Black-Owned Beauty Brands in the Future
Do you specifically plan to buy products in the future that are made by Black-owned beauty brands?
Beauty Brand Loyalist
2021
38%
2022
36%
Beauty Enthusiast
2021
55%
2022
49%
Beauty Novice
2021
45%
2022
39%

Clean Beauty Matters to the Majority of Shoppers

The environment is a serious concern for many. At the same time, many consumers are starting to pay more attention to what they put in and on their bodies. 

So perhaps it’s not surprising that the vast majority – 85% – of consumers indicate that it’s at least somewhat important to them that a beauty product is “clean” – in other words, made sustainably with natural ingredients. 

Interestingly, Boomers are the generation most likely to say that “clean” beauty is important to them when making a purchase.

Consumers Value Environmentally Sound Products
How important is it to you that a beauty product is “clean” (i.e. made sustainably with natural ingredients) when considering a purchase?
Overall
Very important
35%
Somewhat important
50%
Makes no difference
15%
Gen Z
Very important
40%
Somewhat important
45%
Makes no difference
15%
Millennials
Very important
34%
Somewhat important
51%
Makes no difference
15%
Gen X
Very important
34%
Somewhat important
51%
Makes no difference
15%
Boomers
Very important
44%
Somewhat important
45%
Makes no difference
11%

The “cleanliness” of a beauty product is something that matters to a lot of customers. But do they have plans to specifically seek out and purchase sustainably-made products? 

71% say they do, down slightly from 76% when we asked this question in 2021. Interestingly, this percentage is even higher among Gen Z (76%) and Boomer (75%) shoppers. 

Consumers of All Ages Plan to Seek Out “Clean” Beauty Products in the Future
Do you specifically plan to buy beauty products in the future that are "clean" (i.e. made sustainably)?
2021
Overall
76%
Gen Z
86%
Millennials
80%
Gen X
72%
Boomers
68%
2022
Overall
71%
Gen Z
76%
Millennials
71%
Gen X
70%
Boomers
75%

Beauty Shoppers Value Vegan Products

These days, a growing number of consumers are focused on animal rights. And many make it a priority to avoid animal products altogether.

Overall, 51% of consumers say that it’s at least somewhat important to them that a beauty product is vegan. This number is even higher among Gen Z and Millennial shoppers. 

Younger Shoppers Place More Importance on Vegan Beauty Products
How important to you is it that a beauty product is vegan when considering a purchase?
Overall
Very important
14%
Somewhat important
37%
Makes no difference
49%
Gen Z
Very important
20%
Somewhat important
44%
Makes no difference
36%
Millennials
Very important
15%
Somewhat important
39%
Makes no difference
46%
Gen X
Very important
12%
Somewhat important
34%
Makes no difference
54%
Boomers
Very important
9%
Somewhat important
33%
Makes no difference
58%

Consumers say vegan beauty is important to them. But do they have plans to seek out and purchase more of these types of beauty products in the future? 

Overall, 42% say yes. Gen Z’ers are the generation most likely to indicate they’re planning on purchasing more vegan beauty products in the future. 

Younger Shoppers are More Likely to Buy More Vegan Beauty Products in the Future
Do you specifically plan to buy beauty products in the future that are vegan?
Overall
42%
Gen Z
55%
Millennials
46%
Gen X
36%
Boomers
34%

In addition, beauty enthusiasts are the type of shopper most likely to say they plan to buy more vegan beauty products in the future. Again, this is likely because beauty enthusiasts are, in general, more open to trying new products.

Beauty Enthusiasts are Most Open to Buying Vegan Products in the Future
Do you specifically plan to buy beauty products in the future that are vegan?
Beauty Brand Loyalist ​
31%
Beauty Enthusiast
45%
Beauty Novice
34%
Chapter 10

7 Key Takeaways for Beauty Brands & Retailers

The way consumers shop for beauty products online and in-store is evolving – and will continue to do so. To remain competitive, beauty brands and retailers must understand the ever-changing needs and preferences of shoppers – and then adapt their strategies to meet them. 

Here are 7 key takeaways from our research of the habits of modern beauty shoppers. 

One
Beauty eCommerce Continues to Grow

When COVID hit, many consumers shifted their beauty spending online. If the data is any indicator, this habit is one that seems to be sticking around. This year, just under half (49%) of consumers told us they buy more beauty products online than they did prior to the pandemic. Although this is down just slightly from the year prior, it’s a highly significant percentage.

Clearly, consumers have embraced the convenience of browsing and buying beauty products online. Brands and retailers must make it a top priority to deliver engaging online shopping experiences – or risk losing shoppers to a competitor that does.

Two
Brick-and-Mortar Still Critical

Though many beauty shoppers are spending more online than they did pre-pandemic, brick-and-mortar continues to be important. 

Today, nearly all (97%) consumers spend at least some of their monthly beauty budget in a brick-and-mortar store. And nearly half (45%) spend over $50 online each month on beauty products.

Of course, it’s important to invest in digital. But brick-and-mortar stores should contribute to a compelling and channel blended experience.

Three
Beauty Consumers are Open to Trying New Products

Most consumers have tried-and-true beauty products they purchase time and time again. However, many are also open to giving new products a try.

Just over half (52%) of shoppers are more likely to try a new beauty product today than they were pre-COVID. And many tell us they’re likely to buy habitual and new-to-them products within the same transaction.

Consumers weigh myriad factors when deciding whether to purchase an unknown product, but one rises to the top. A staggering 92% of consumers say reviews are a factor they consider when deciding whether to purchase a new (to them) product.

It’s essential to generate plenty of reviews for newly launched or lesser known products. This content will boost shoppers’ confidence – and the likelihood they’ll buy.

Four
UGC is Essential for Online and In-store Shoppers Alike

Modern consumers depend on user-generated content to make informed purchase decisions – whether they’re shopping online or in-store.

Nearly all (99%) of consumers read reviews when shopping online at least sometimes, and 85% do so when shopping in a physical store location. In addition, 96% seek out visual content from other shoppers, and 98% read Q&A.

The presence of this content gives shoppers the confidence to make a purchase. Make it a priority to generate plenty of user-generated content. Then, showcase this content so it’s easy for shoppers to find, whether they’re browsing from home on a computer or in a store on a mobile device. 

Five
Beauty Shoppers Seek out Products and Brands that Align with Their Values

Factors like price and packaging still matter. However, a growing number of consumers pay attention to whether a product or brand aligns with their values – and they seek out those that do.

Specifically, we found that many consumers plan to seek out and purchase beauty products that are made by Black-owned brands, as well as those that are clean and vegan. 

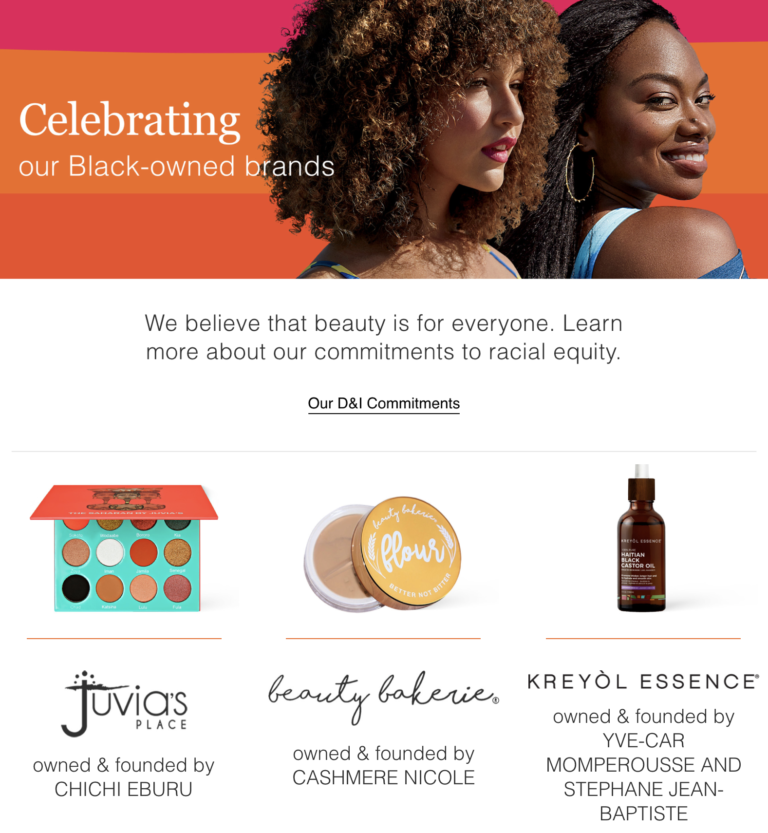
Showcase what’s unique about your brand or products so consumers can quickly determine whether it aligns with their values. For example, a beauty retailer might add sections to its website that make it easy for shoppers to find products that are from Black-owned brands, as well as those that are clean and vegan.

Six
Beauty Shoppers are Loyal to Their Trusted Influencers

61% of consumers are swayed by the influencers they follow to purchase beauty products. However, a greater following doesn’t necessarily equate to greater influence. Over half (53%) of beauty shoppers indicate they trust their beloved influencers – no matter how many followers they may have.

Consider leveraging micro-influencers who love your brand and products. One way to do this is to send samples to these influencers, and in exchange, ask them to write a review or post a photo on their Instagram account. This content will help future shoppers make more informed purchase decisions.

Seven
Beauty Brands and Retailers Must Continuously Measure and Optimize Their UGC Strategies

Nearly all beauty shoppers seek out user-generated content, whether they’re shopping online or in-store. So brands and retailers must make it a priority to collect and display more of this content if they expect to attract and retain shoppers. 

When developing your UGC collection and display strategies, best practices (especially those for the beauty industry) are a great place to start. However, all businesses are different. As such, it’s essential to continuously measure the performance of your UGC program – and use those insights to make changes that’ll garner an even bigger ROI.

Consumers nationwide can now read and provide authentic product ratings and reviews when shopping online

JUNE 1, 2022—CHICAGO—Consumer-generated product ratings and reviews, enabled by PowerReviews, are now live on Albertsons Companies’ websites. For the first time, shoppers can browse and interact with authentic product ratings and reviews on 11 of Albertsons Cos.’ retail websites, including Safeway, Vons, Jewel-Osco, and Shaw’s.

PowerReviews is providing ratings and reviews technology and services to Albertsons Cos., including the ability for brands to syndicate their user-generated content to related product pages on Albertsons Cos.’ sites to ensure a consistent shopper experience.

“Ratings and reviews have become such a significant factor in buyer decision-making that shoppers actually choose where they buy from based on the availability of this content,” said Mark Dillon, CEO at PowerReviews. “Albertsons Cos. has an established history of introducing technology to improve the customer experience, and we are excited and proud to work together to enhance their customers’ online shopping experience.”

Recent research supports this logic, with 83% of grocery shoppers saying they are more likely to purchase a new grocery item online if customer reviews exist for that product.

“Customer-generated ratings and reviews empower purchase decisions,” said Jill Pavlovich, SVP of Digital Customer Experience at Albertsons Cos. “We’re proud to be one of the first grocers to offer this authentic conversation with our shoppers about their favorite products.”

ABOUT POWERREVIEWS
PowerReviews is the Ratings and Reviews specialist doing more with user-generated content to grow businesses by enabling them to collect and share more and better user-generated content, display it for maximum conversion impact and analyze it to benchmark and improve product experiences. PowerReviews is headquartered in Chicago, IL, USA.

PowerReviews will be hosting a webinar on the new Albertsons Companies Ratings & Reviews program on June 9, 2022 with representatives of Albertsons Companies. More information on the program can also be found on the PowerReviews website.

ABOUT ALBERTSONS COMPANIES
Albertsons Companies is a leading food and drug retailer in the United States. As of February 26, 2022, the Company operated 2,276 retail stores with 1,722 pharmacies, 402 associated fuel centers, 22 dedicated distribution centers and 20 manufacturing facilities. The Company operates stores across 34 states and the District of Columbia with 24 banners including Albertsons, Safeway, Vons, Jewel-Osco, Shaw’s, Acme, Tom Thumb, Randalls, United Supermarkets, Pavilions, Star Market, Haggen, Carrs, Kings Food Markets and Balducci’s Food Lovers Market. The Company is committed to helping people across the country live better lives by making a meaningful difference, neighborhood by neighborhood. In 2021, along with the Albertsons Companies Foundation, the Company contributed nearly $200 million in food and financial support, including approximately $40 million through our Nourishing Neighbors Program to ensure those living in our communities have enough to eat.

Power Points

  • Review analytics can help brands and retailers boost review collection efforts, improve product marketing, and increase conversion rates.

  • Five UGC reports, including insights into overall review trends, merchant specific questions, Amazon reviews, and more.

  • We break down each report and share actionable tips for using the data.

Nearly 90% of shoppers say they simply won’t buy products without reading reviews first. And when consumers interact with ratings and reviews, the product experiences a 120.3% lift in conversion

The value of reviews is evident. As for how to squeeze more value from reviews… that’s where things get murkier. 

Fortunately, there’s something that can help: review analytics. Analyzing your reviews can provide answers to questions like:

  • What do your customers care about when it comes to your products?

  • Why, exactly, are your best-sellers best-sellers?

  • What changes can you make to turn your lower-sellers into better sellers?

  • Which of your review collection strategies generate the most reviews?

  • And much more

Regularly analyze your review content, and you’ll get ideas for increasing your review collection, improving your product marketing, and selling more products.

Here are five very specific reports that will help you level up your entire Ratings and Reviews program, ensuring you optimize for review collection and display – and in turn conversion – success.

1. Review Trends Report: How is your native review collection performing over time?

Any Review Trends Report displays a bird’s-eye view of how your review collection efforts are going. On a month-by-month basis, you can see the average star rating across all of your products. How many reviews have you collected? How long are those reviews, on average?

Here’s an example from a PowerReviews customer.

Review Trends Report Overview

The report also reveals the same metrics for your highest- and lowest-rated products.

Review Trends Report Product Comparison

Reports containing this information can help you spot trends in your native review collection efforts (e.g. the reviews you collect directly onto your website from shoppers who have bought your products). Does review volume stay steady throughout the year, or are there certain months when your review volume slumps or soars?

One potential actionable takeaway: To ensure you maintain a consistent flow of reviews, slower months could be an opportune time to run a review sweepstakes or sampling campaign to ensure recent reviews come in at a steady clip. 

Consistent review generation is essential to satisfying consumer expectations and keeping them on your product pages. Nearly 80% of consumers “always” or “regularly” consider review volume, and 86% of shoppers feel that recent reviews are more important when considering a product or brand they haven’t purchased before. And just over a third (38%) of shoppers will simply not purchase a product if the only reviews available were published three months ago or more.

For your products, you can see at a glance which products could use a little TLC. Low-rated products with longer review lengths indicate customers have a lot to complain about. Are there product or manufacturing issues you can fix? For products with longer reviews, what features or benefits do customers speak about? Be sure to call them out in your product description.

2. Review Form Performance Analytics: How is your review collection form performing?

In some aspects, your review generation efforts hinge on one critical element: how you ask for reviews. That’s why understanding the performance of your Review collection form is critical. 

At PowerReviews,  we solve for this with our Write-a-Review Report (or WAR Report for short). It shares key details, including your review submission rate, review starts, and review submissions — both overall and for every single one of your products. If you have significantly fewer review submissions than starts, you may have too many questions on your Write-a-Review form. Are there any non-essential questions you can remove to increase your submission rates?

Write-a-Review Report

In this example you can also see how many reviews you collect per day, on average, as well as your review start and submission rates by device (desktop, mobile, tablet, or other). If certain devices have significantly fewer submissions than starts, that could be a sign that the form or another element on your website is not mobile-friendly.

Also understand your review submission trends over time. If lower submission rates are becoming a trend, you might try shortening your review form to make it easier to submit a review.

3. Observations Reporting: How much of my review content never makes it to publication?

Some reviews aren’t fit to publish. They may contain profanity, personally identifiable information, or irrelevant content. At PowerReviews, our four-step content moderation process filters out this kind of content and tags it for review by our human moderation team. We call these “observations.”

Some of this content can’t be fixed – for example, angry reviewers who drop “F” or any other naughty bombs. However, some reviewers may unintentionally include personally identifiable information (PII), and that’s something that can be fixed with instructions on your review form.

In the report below (taken as an example from the PowerReviews Observation report), you can see a breakdown of publishable vs. unpublishable content based on observation moderations.

PowerReviews Observation Report

If you notice a significant number of reviews are moderated with “PII,” you can add helper text to your Write-a-Review form reminding people not to include personal information like names and location.

If there’s a high proportion of “irrelevant” content, you can enable review rejection emails to explain why a person’s review couldn’t be published. Once they understand the issue, they may go back and update their review. Either way, they’ll know how to write a publishable review the next time they purchase from you.

4. Deeper Review Collection Analytics: Which questions are answered the most on my review form?

To make their reviews more helpful to customers, many brands and retailers opt to add optional questions to their review form, beyond the standard star rating and blank text box. This is something we always encourage as it improves review quality – which shoppers value highly.

At PowerReviews, we call these merchant specific questions (or MSQs for short). MSQs can range from questions about size and fit (for apparel or shoe brands) to ideal use cases, pros and cons, and demographic information. Analyzing how these perform can be super valuable to informing future collection efforts.

For example: the below “MSQ Report” reveals which of these questions are most popular with customers, and the average star rating that corresponds to those questions.

MSQ Report

This data can inform your review collection efforts as well as your product marketing. For example, let’s say you manage reviews for a shoe brand. If a majority of customers say the shoe “feels narrow” and give it a low star rating, that may be your cue to update the product description with text like “This shoe runs small.”

5. Amazon Review Performance Report: How are reviews shared to Amazon from my site impacting my performance on Amazon.com and Amazon.co.uk?

At PowerReviews, we enable shoppers to also publish reviews they submit to your site to Amazon. After customers finish writing a review for your website, all they have to do is click this button. They’re taken directly to the corresponding product page on Amazon.com, where they can paste and submit their review.

The Share to Amazon Report displays several key metrics related to your Amazon reviews, including:

  • The total number of Amazon product pages you have
  • The total number of Amazon reviews for your products
  • The total number of reviews shared from PowerReviews to Amazon

You can also see the percentage of reviews shared from your site to Amazon, so you can understand how many customers are using this feature. 

The report even calculates the difference in review length between the two platforms. Review length is something consumers care about, with nearly 70% regularly seeking out longer, more detailed reviews. So this information can help you identify and act on this issue.

Unlock fresh insights with review analytics

Review collection, display, and promotion are all part of a well-rounded UGC marketing strategy. Add in review analytics, and your efforts will go so much further. You can make smarter decisions, optimize your marketing, and supercharge your review collection efforts.

The good news if you’re a PowerReviews customer is that you can access these reports now. And even if you’re not, we’d be happy to show them to you any time.

Savannah Claspell

Savannah is an Enterprise Customer Success Manager, passionate about using data and analytics to empower brands to grow their business. When she isn’t helping brands increase and leverage their UGC you can find her deep in a good book, running, or mountainside skiing.

A comprehensive breakdown of how various components of user-generated content impact conversion rates, based on an analysis of 1.5MM online product pages from over 1,200 brand and retailer sites during 2021.

Research at a Glance:

The Conversion Impact of User-Generated Content: The Complete Breakdown for 2022 is based on an analysis of 1.5MM online product pages from over 1,200 brand and retailer sites throughout the course of 2021 (and is an update of the previous version of this same research). Here’s a snapshot of our key findings.

The Very Presence of UGC Has a Positive Impact on Conversion
  • There’s an 8.5% increase in conversion among visitors who are served up some form of UGC on product pages.

  • The conversion lift is significantly larger – 100.6% – among visitors who interact with the UGC in some manner.
Reviews Double Conversion
  • Visitors who interact with ratings and reviews convert at a rate that’s 108.3% higher than average. 

  • Specific review features lead to even larger conversion lifts, including Helpful Yes votes (414.3%), Helpful No votes (292.9%), and Review Search (260.7%) – among others. We’ve included examples of these features in action later on in this report. 

  • 61.6% of visitors who interact with star rating filters specifically filter to see one-star reviews. These visitors still convert at a rate that’s 85.7% higher than average, proving that negative reviews aren’t conversion killers.
Q&A Remains the Most Powerful Form of UGC – and Its Impact Continues to Grow
  • In 2021, there was a 194.2% lift in conversion among visitors who interacted with Q&A content, making it the type of UGC that impacts conversion most. This is up significantly from a 157.1% conversion lift among Q&A interactors in 2020. 

  • Q&A features that have a particularly high impact on conversion include Show More Answers (217.9%), Click Read Answers (192.9%), and Answer Helpful voting (192.9%). Later on in this report, we’ll share real-life examples of each.
User-Generated Imagery Strongly Impacts Conversion
  • There is a 106.3% lift in conversion among visitors who interact with user-generated imagery on a product page, up significantly from a 91.4% lift in 2020.
  • Imagery interactions that are particularly impactful on conversion include clicking on the image gallery (110.7%), clicking to view the next image/video (103.6%), and clicking to see the previous image/video (96.4%)
Find What Works for Your Business
  • When it comes to displaying UGC on your product pages, best practices are a great place to start. However, there’s no “right” way to do it.

  • Instead, analyze your UGC performance regularly and then optimize your strategy accordingly.
Chapter 1

Introduction

UGC Has Become an Expected Part of the Purchase Journey

When consumers are researching products and services, they’re no longer satisfied to hear from the brands and retailers that sell them. Instead, they want to hear from the real experts: those who have purchased and used the product or service in question.

In fact, user-generated content, including ratings & reviews, questions & answers, and visual content has become an essential component of the shopping journey for modern consumers. If there’s any doubt in your mind, consider these statistics:

of consumers read reviews when shopping online at least sometimes
0 %
of consumers read Q&A at least occasionally; 68% have submitted their own questions
0 %
of consumers regularly or always seek out visual content from other consumers prior to making a purchase
0 %

But What’s the Conversion Impact of UGC?

Collecting and displaying user-generated content is an important way to meet shoppers’ expectations. However, before investing in UGC, brands and retailers (understandably) want to know what’s in it for them. In other words, how does the presence of this content impact one of their most important metrics: conversion?

Now, we have a definitive answer.

We analyzed activity on over 1,200 brand and retailer sites over the course of 2021 to pinpoint the conversion impact of three key types of UGC: ratings & reviews, Q&A, and visual content. We also examined how that impact has changed in the year since our last analysis

Of course, each UGC display is different. While a visually appealing, on-brand UGC display is typically a priority for many, the ultimate aim must be to create a display that has the greatest conversion impact. For this reason, we have examined how specific features of each type of UGC impact conversion.

Measure and Optimize UGC Regularly to Unlock the Biggest ROI

While understanding how UGC elements impact conversion is important, it’s only the beginning. That’s because each business is different. And while one feature may be particularly impactful for some brands and retailers, it might not be as effective for others. 

Ultimately, you’ve got to determine what works best for your business. 

Start with best practices, and test new features and functionality that are shown to impact conversion. Then, measure your UGC performance on a regular basis and use those insights to optimize your UGC display for even better results. 

Chapter 2

Methodology & Definitions

This report is based on an analysis of 1.5MM online product pages from over 1,200 brand and retailer sites over the course of 2022. Here is a key of terminology to refer back to when reading the report:

Time period for analysis
This data was pulled for the period from January 1, 2021 to December 31, 2021.
Websites analyzed
Activity on more than 1.5 million product detail pages across 1,200 ecommerce websites. These websites run the gamut of ecommerce categories.
Visitor conversion
The visitor conversion metric, used as the baseline for this report, is calculated based on conversions from individual visitors within a 24 hour period. A new visitor session starts every 24 hours, with all accompanying downstream implications on the conversion metric.
Ecommerce UGC page visitor overall
Calculated for any consumer visiting a product detail page that runs PowerReviews UGC display analytics technology.
UGC impression
Calculated based on unique visitors who have scrolled a product page enough to be served an impression of at least one type of UGC (review, Q&A, or imagery). The review snippet (the UGC element used at the top of PDPs to display a summary of the average star rating, number of reviews, etc.) is excluded from the UGC impression metric. Throughout this report, we use this metric to more closely examine the different types of UGC – specifically reviews, Q&A, videos and imagery.
UGC interaction
A metric calculated based on visitors who interact with UGC. Some examples of UGC interactions include clicking “read more” on a review, opening a user-submitted photo, or using the search box to run a search within review content.
Chapter 3

A High Level View of How UGC Impacts Visitor Conversion

The Mere Presence of UGC on a Product Page Positively Impacts Conversion

During 2021, there was a 2.8% conversion rate on the 1,200 sites we analyzed that run PowerReviews’ UGC technology. 

This may be slightly higher than benchmarks you’ve seen from other sources. There are a couple reasons for this variance.

  1. We base conversion on visitors rather than sessions. See above for more information on our methodology.

  2. Assuming the PDP is built this way (which most are), all shoppers in the sample we analyzed are served up some form of UGC above the fold. Typically, this is a summary that includes average star rating and review distribution. Again, see the methodology section for more details on what we classify as a UGC impression or UGC interaction. 

When a visitor scrolls to a point where they see some form of UGC, they’re more likely to convert. In fact, there’s an 8.5% lift in conversion when a visitor is served up some form of UGC. In comparison, UGC impressions resulted in a 4.3% lift in conversion in 2020.

UGC Interactions Significantly Boost Conversion

When site visitors actually interact with UGC, the impact on conversion is even more significant. There’s a 100.6% lift in conversion among those who interact with UGC, down slightly from a 108.4% lift in 2020. 

We’ll dive deeper into how consumers interact with UGC throughout this report.

How UGC Impacts Conversion
2020
Ecommerce UGC Page Visitor Overall Conversion Rate
3.4%
UGC Impression Conversion Rate
3.6%
4.3% conversion lift from UGC Impression
UGC Interaction Conversion Rate
7.2%
108.4% conversion lift from UGC Interaction
2021
Ecommerce UGC Page Visitor Overall Conversion Rate
2.8%
UGC Impression Conversion Rate
3.1%
8.5% conversion lift from UGC Impression
UGC Interaction Conversion Rate
5.7%
100.6% conversion lift from UGC Interaction

By simply displaying UGC (including reviews, Q&A and visual content) you can experience a notable lift in conversion. However, UGC interactions drive an even larger impact. 
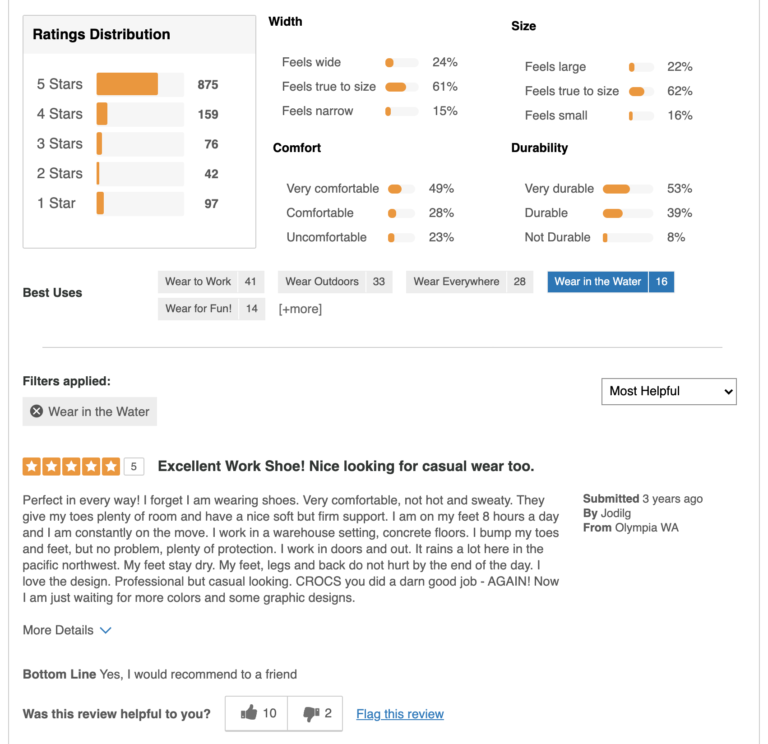
Chapter 4

How Review Interactions Impact Conversion

Reviews Double Conversion Rates

It’s no secret that a growing portion of consumers are shopping online – a trend that is unlikely to slow down. Statista forecasts that ecommerce will make up nearly a quarter of total retail sales worldwide by 2025. 

While online shopping is convenient, it also involves a level of risk. That’s because it’s impossible to know for certain that a product will fit one’s needs – especially without seeing it in person first.

Reviews can help shoppers overcome this risk and increase their likelihood of making a purchase. There’s a 108.3% lift in conversion among visitors who interact with reviews.

The Impact of Review Interactions on Conversion
Lift in conversion when visitors interact with reviews
2020
120.3%
2021
108.3%

The Impact of Various Review Features on Conversion

How Various Review Features Impact Conversion
The conversion lift for visitors who engaged with each ratings and reviews feature, compared to the standard conversion rate for the same pages
2020
Helpful Yes
314.7%
Helpful No
182.4%
Review Search
202.9%
Footer Page Previous
288.2%
Footer Back to Top
129.4%
Review Snippet
129.4%
Faceoff Positive
138.2%
Footer Page Next
182.4%
Faceoff Negative
120.6%
Review Sort
109.7%
Filter Stars
111.8%
Filter Tag
35.3%
More Details
105.9%
2021
Helpful Yes
414.3%
Helpful No
292.9%
Review Search
260.7%
Footer Page Previous
242.9%
Footer Back to Top
178.6%
Review Snippet
164.3%
Faceoff Positive
128.6%
Footer Page Next
117.9%
Faceoff Negative
114.3%
Review Sort
114.3%
Filter Stars
89.3%
Filter Tag
78.6%
More Details
50%

Helpful Votes

While some reviews are helpful when a shopper is making a purchase decision, others simply aren’t. A visitor can indicate if a given review is helpful (or not) by clicking on the thumbs up or thumbs down icon.

Helpful voting is the review interaction that impacts conversion most. There’s a 414.3% lift in conversion among visitors who click the thumbs up icon. In comparison, there was a 314.7% lift in conversion as a result of this interaction in 2020.

Interestingly, there’s also a large conversion lift – 292.9% – among visitors who click the thumbs down icon on a review. While a specific review might not be particularly helpful, it doesn’t necessarily deter a shopper altogether.

Review Search

Typically, a consumer doesn’t read every single review for a given product. Instead, they seek out content that’s relevant to them. One way they can do this is by typing a search term into the review search box.

There’s a 260.7% lift in conversion among visitors who interact with the review search feature, up from 202.9% among those who took this action in 2020. 

Footer Page Actions

Once a visitor has scrolled to the bottom of a review display, they have the opportunity to take a few different actions. They can go to the next page of reviews, return to the previous page, or return to the top.

Here’s a snapshot of how these footer actions impact conversion – both in 2020 and in 2021. Notably, “back to top” is the footer action that’s garnered the largest year-over-year lift in conversion. 
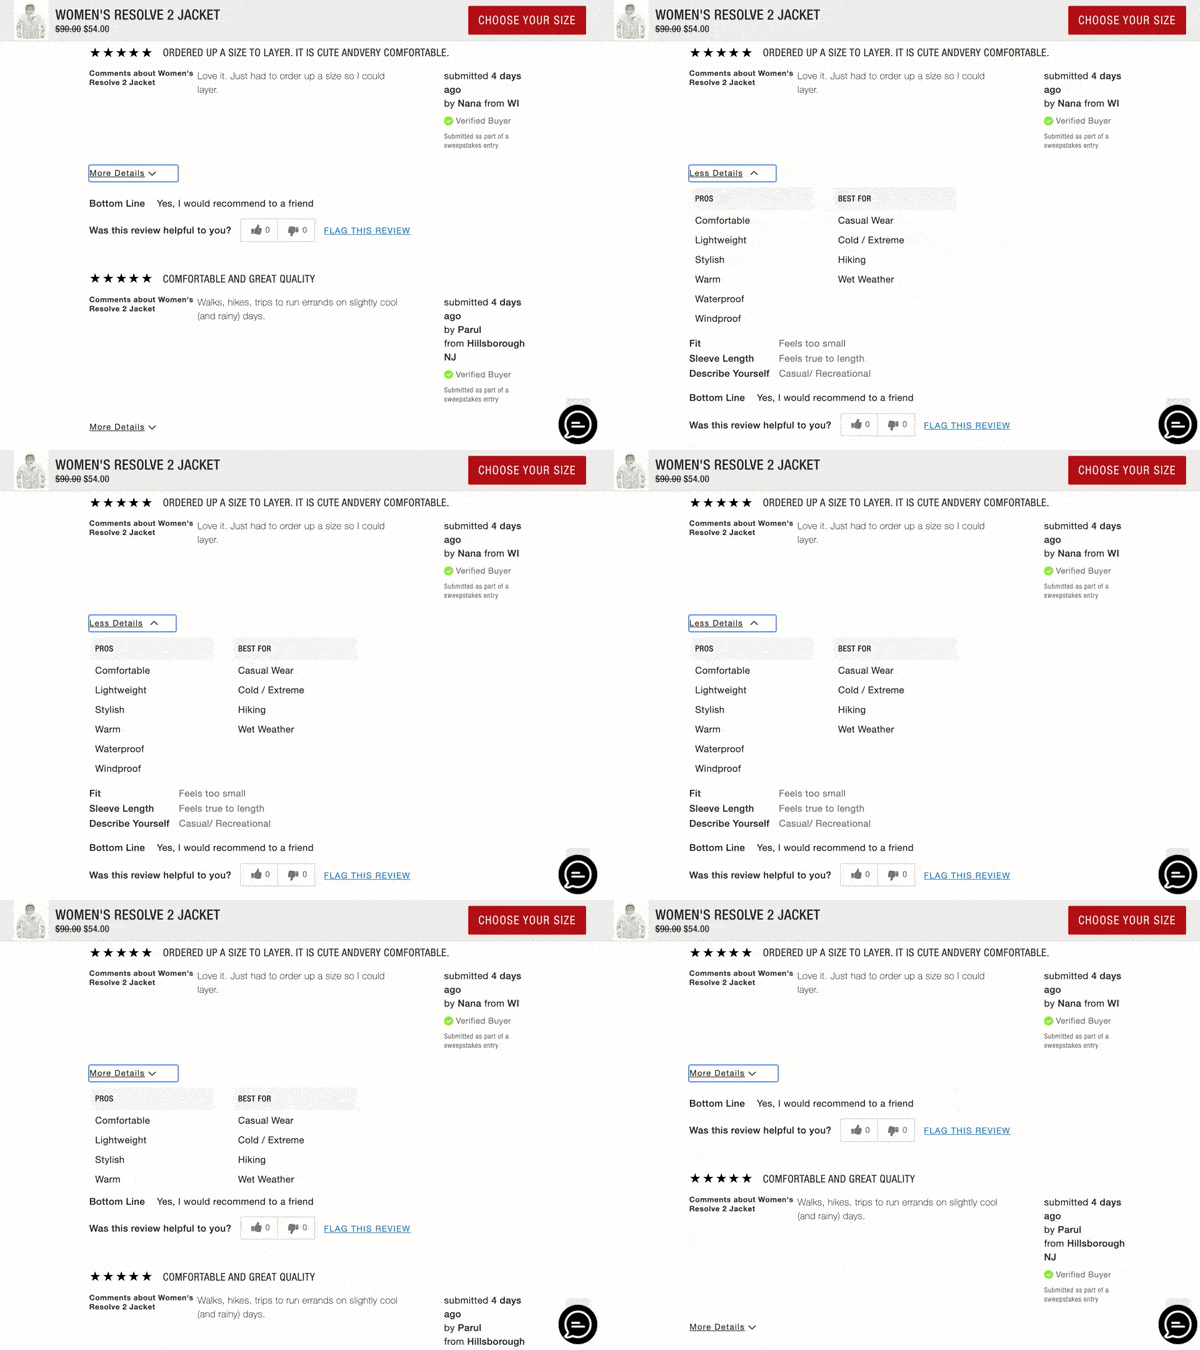
How Footer Actions Impact Conversion
2020
Previous
288.2%
Next
182.4%
Back to Top
129.4%
2021
Previous
242.9%
Next
117.9%
Back to Top
178.6%

Review Snippet

It’s considered a best practice to display a review overview (also known as a snippet) at the top of product pages. The snippet provides a high level overview of the review content for a product and typically includes information such as the average star rating and the number of reviews available for the product.

If a visitor clicks on the snippet, they’re taken to the full review display, where they can read individual reviews, as well as sort and filter content to find what’s most relevant to them. There’s a 164.3% conversion lift among consumers who click the review snippet, up from a 129.4% lift in 2020. 

Review Faceoff

Some brands and retailers display a product’s most liked positive review alongside its most liked negative review one. This is referred to as a review faceoff, and it’s a great way for shoppers to quickly determine the best case and worst case scenarios of a given product.

There’s a 128.6% lift in conversion when shoppers click to read the entire positive review that’s featured in the snapshot. 

What’s perhaps more interesting is that there’s a 114.3% lift among shoppers who click to read the entire negative review. This is proof that negative reviews don’t necessarily deter shoppers. Instead, this content allows consumers to understand the worst case scenario of a given product. If it’s something they can live with (or that simply isn’t relevant to them), they’re still likely to move forward with the purchase. 

Review Sorting

The best review displays allow visitors to easily sort reviews to surface what matters most to them. For example, a visitor might sort content based on recency, helpfulness, or the availability of visual content.

There is a 114.3% lift in conversion among shoppers who click to sort reviews. This is up slightly from 2020, when there was a 109.7% conversion lift for this type of interaction. 

Here’s a closer look at how different types of sorting behavior impact conversion – both in 2020 and 2021.

Conversion Lift by Type of Review Sorting Behavior
2020
Review Sort Most Recent
73.5%
Review Sort Highest
158.8%
Review Sort Most Helpful
200%
Review Sort Oldest
108.8%
Review Sort Lowest
102.9%
Review Sort Images
170.6%
2021
Review Sort Most Recent
196.4%
Review Sort Highest
142.9%
Review Sort Most Helpful
121.4%
Review Sort Oldest
110.7%
Review Sort Lowest
103.6%
Review Sort Images
89.3%

Star Filters

Many brands and retailers include a feature in their review display that allows shoppers to see how many reviews were written for each star rating. Shoppers can then click on a specific star rating – and just the content submitted with that particular rating will be displayed.

There’s a 89.3% lift among shoppers who click to filter by star rating. 

Let’s zoom in further to see how many visitors filter reviews by each star rating – and how it impacts conversion.
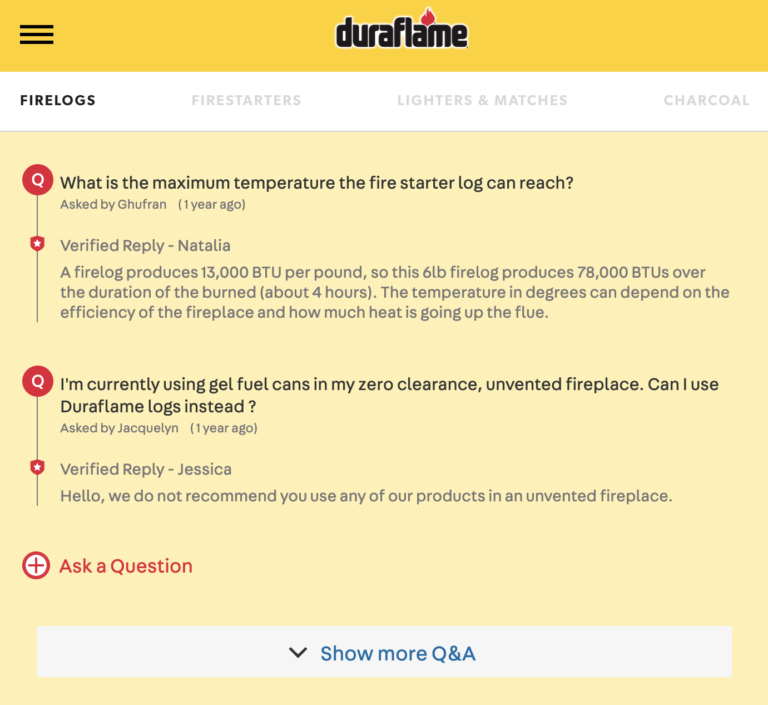
Conversion Lift by Type of Review Sorting Behavior
5 Stars
Star Interactors Engage
29.3%
Conversion Lift
139.3%
4 Stars
Star Interactors Engage
20.3%
Conversion Lift
146.4%
3 Stars
Star Interactors Engage
22.4%
Conversion Lift
121.4%
2 Stars
Star Interactors Engage
22.4%
Conversion Lift
107.1%
1 Star
Star Interactors Engage
61.6%
Conversion Lift
85.7%
Note: Star interactors typically filter by more than one rating.

The most common way to filter by star rating is to see only one-star content. This isn’t surprising, as previous research found that 96% of consumers specifically seek out negative reviews – with over half (52%) explicitly looking for one-star content.

What is surprising is that those who filter to see one-star content still convert at a rate that’s much higher than average. In fact, there’s a 85.7% lift in conversion among those who filter to see one-star reviews. Again, this is proof that the presence of negative reviews isn’t enough to deter many consumers. Rather, negative reviews are a tool that consumers depend on to make more informed purchase decisions.

Filter Tags

Some brands and retailers ask those writing reviews to select “tags” related to the product. These might include pros, cons and best uses of a product – among others. 

These brands and retailers then allow future shoppers to filter reviews by these specific “tags.” 

Visitors who filter reviews by tags convert at a rate that’s 78.6% higher than average. This is up significantly from 2020, when there was a 35.3% conversion lift among visitors who filtered reviews by tags. 

More Details

When a visitor is reading a review, sometimes they have the opportunity to expand it to get additional details about the shopper that wrote the review and their experience with the product.

There’s a 50% lift in conversion among shoppers who click to expand a given review to read more details. 

Chapter 5

The Growing Impact of Q&A Interactions on Conversion

When a consumer is shopping in a store, they can reach out to a sales associate to ask questions and get product recommendations. That’s not possible for online shoppers. 

Instead, many of these consumers scroll the product page to find the questions and answers (Q&A) portion of the page. There, they can see if other shoppers have already submitted similar questions – and gotten answers. If not, they can submit their own. 

Q&A Continues to be the Most Impactful Kind of User-Generated Content – And its Impact is Growing

When we analyzed 2020 data, we found that of the types of UGC, Q&A had the largest impact on conversion. 
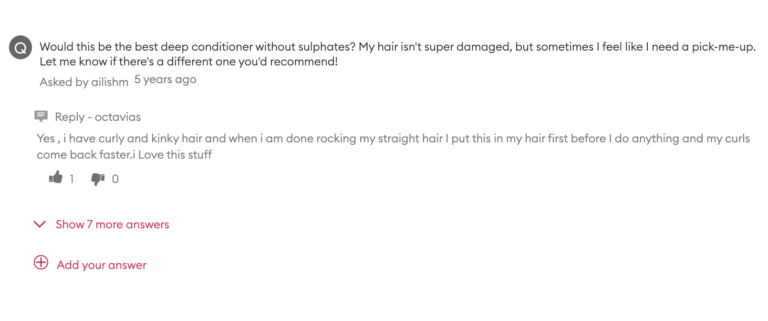
This continues to be the case. In fact, the impact of Q&A on conversion continues to grow. In 2021, there was a 194.2% lift in conversion among those who interacted with Q&A content, up significantly from a 157.1% conversion lift in 2020.

Impact of Q&A on Conversion
Lift in conversion when visitors interact with Q&A
2020
157.1%
2021
194.2%

Many Types of Q&A Interactions Positively Impact Conversion

A typical Q&A display includes various features and functionality. Let’s examine how interacting with key features impacts purchase behavior. 

How Key Q&A Features Impact Shopper Behavior
Conversion lift among visitors who engaged with each Q&A feature
2020
Show More Answers
164.7%
Click Read Answers
158.8%
Answer Helpful
141.2%
Answer Question
111.8%
Ask Question Snippet
137.1%
Ask Question Header
79.4%
2021
Show More Answers
217.9%
Click Read Answers
192.9%
Answer Helpful
192.9%
Answer Question
150%
Ask Question Snippet
139.3%
Ask Question Header
100%

Show More Answers

On a typical product page, a set number of questions and answers appear. If there is more Q&A than what is initially displayed, the shopper can click on text that reads “Show more Q&A” to access it. 

If a shopper seeks out additional Q&A beyond the content that’s initially displayed, it’s clear they’re interested in learning a lot about a given product. They’re also more likely to convert. In fact, there’s a 217.9% lift in conversion among shoppers who click “Show more Q&A.” This is up significantly year-over-year. In 2020, there was a 164.7% conversion lift when shoppers clicked to show more Q&A.

Click Read Answers

By default, a single answer is usually displayed for a given question submitted via Q&A. However, there are instances when there might be multiple responses to a single question. For example, a question might have an official response from the brand, as well as from someone who purchased the product. The visitor can click “show more answers” to see any additional responses. 

There’s a conversion lift of 192.9% among visitors who click to show more answers. In 2020, the lift for this action was 158.8%

Answer Helpful

If a shopper finds a response to a previous customer’s question to be particularly helpful, they might opt to tap or click the thumbs up icon.

Those who click the helpful icon convert at a rate that’s 192.9% higher than average. This is up significantly from 2020, when there was a 141.2% lift in conversion among visitors who took this action.

Answer Question

Our previous research found that 94% of shoppers value answers to Q&A that are posted by verified buyers who have already purchased the product in question. So it’s not surprising that a growing number of brands and retailers allow different experts to post answers to Q&A – including existing customers. 

A site visitor can post an answer to an existing question by clicking on the text that says “add your answer.” 

There’s a 150% lift in conversion among visitors who take this action. This is up significantly from 2020, when there was a 111.8% lift in conversion among visitors who clicked “add your answer.” 

Ask Question Snippet

On some brand and retailer sites, shoppers see an overview – or “snippet” – at the top of product pages. This snippet provides shoppers with a high-level overview of the UGC available for that particular item, and it may include a link a visitor can click to submit their own question.

Visitors who click on “Ask a Question” in the UGC snippet convert at a rate that’s 139.3% higher than average. This is up slightly from a 137.1% lift in conversion among visitors who took this action in 2020. 

Ask Question Header

Visitors can also submit questions by clicking or tapping the “Add a Question” button that’s part of the Q&A header. 

In 2021, there was a 100% increase in conversion among visitors who clicked “Add a Question” from the Q&A header, compared to a 79.4% lift among those who took the same action in 2020.

Chapter 6

How User-Generated Imagery Impacts Purchase Behavior

Shoppers Who Interact With User-Generated Visual Content are (a Lot) More Likely to Convert

During 2021, the overall conversion rate across the brand and retailer sites we analyzed was 2.8%. However, that rate is significantly higher among visitors who interact with user-generated photos and videos on a product page: 5.9%. That’s a huge 106.3% lift in conversion.
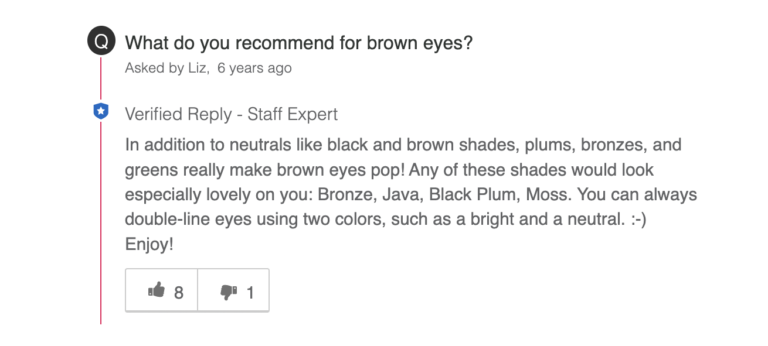
How Interactions with User-Generated Visual Content Impact Conversion
Lift in conversion when visitors interact with user-generated imagery
2020
91.4%
2021
106.3%

User-generated visual content continues to have an increasingly large impact on conversion. For the sake of comparison, there was a 91.4% lift in conversion among visitors who interacted with this content in 2020.
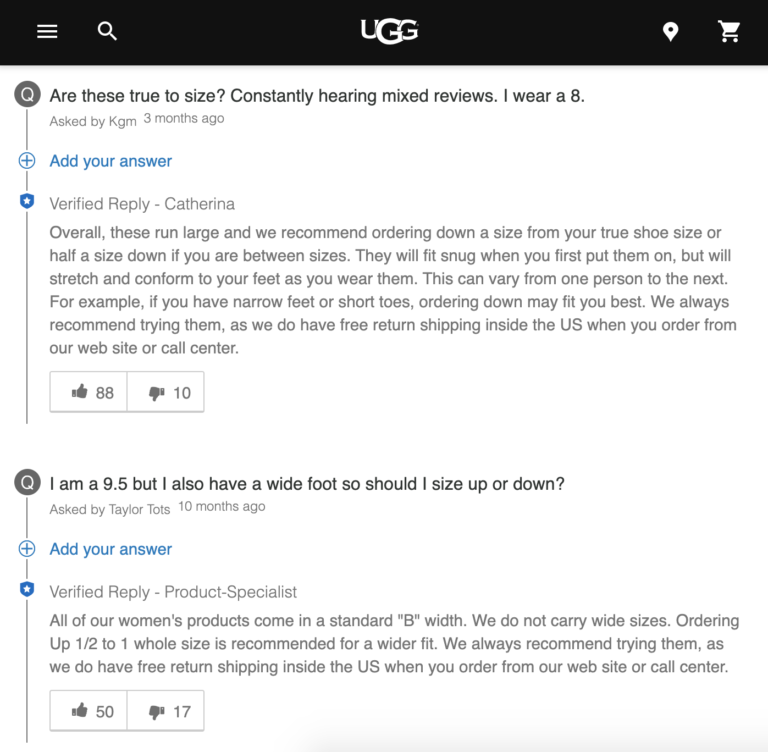
How Various Interactions with User-Generated Visual Content Boost Conversion

There’s no denying that those who interact with photos and videos submitted by other consumers are a lot more likely to make a purchase Now, let’s explore how different types of visual content interactions impact conversion.
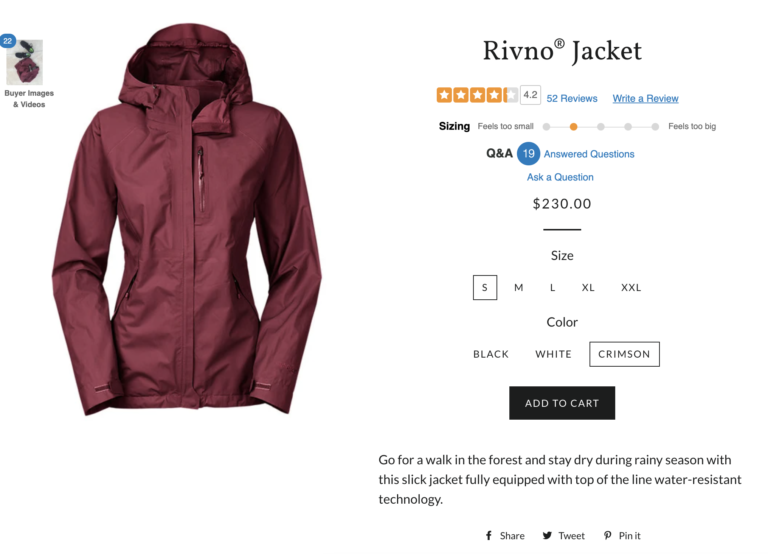
2020
Image Gallery
94.1%
Image Gallery Next
91.2%
Image Gallery Previous
79.4%
2021
Image Gallery
110.7%
Image Gallery Next
103.6%
Image Gallery Previous
96.4%

Image Gallery

Once you’ve started to collect photos and videos from your shoppers, it’s a best practice to showcase it in a visual content gallery on the appropriate product page. Our analysis found there’s a 110.7% conversion lift among shoppers who click on any image within such a gallery – up from a 94.1% lift in 2020. 

Image Gallery Navigation

Once a visitor has clicked on an image or video in an imagery gallery to enlarge it, they typically have the option to navigate to other imagery by clicking on the forward and back arrows.

There’s a 103.6% lift in conversion among visitors who click to see the next image. The conversion lift is 96.4% among those who click the arrow to view the previous image.

Notably, both forward and back navigation in the image gallery had a larger impact on conversion in 2021 than they did in 2020. 

Chapter 7

5 Key Takeaways

The impact of UGC can no longer be denied. Modern consumers expect it, regardless of what they’re shopping for. And those who interact with it are more likely to make a purchase. 

Here are our 5 key takeaways from our latest analysis.

One
The Very Presence of UGC Impacts Conversion

If a shopper scrolls a product page long enough to be served up some form of UGC, there’s a 8.5% lift in conversion. The impact is significantly higher – 100.6% – among visitors who interact with user-generated content.
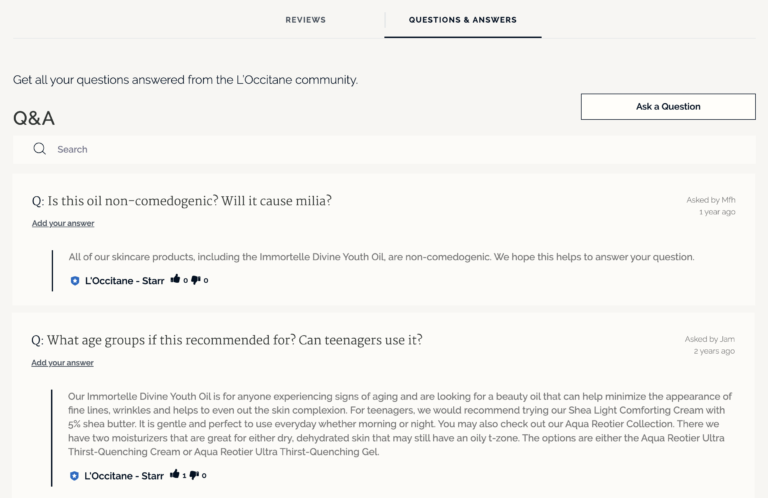
UGC is no longer optional. It’s essential for any brand or retailer looking to grow sales in an increasingly competitive market. If you’re not already collecting and displaying this content, you’re leaving money on the table. 

Two
Reviews Fuel Confident Purchase Decisions

There’s risk involved with purchasing a product online, sight unseen. However, reviews can help shoppers overcome this risk – and increase the likelihood they’ll make a purchase. In fact, there’s a 108.3% lift in conversion among shoppers who interact with reviews on product pages. 

Start collecting reviews. And prominently showcase this content so it’s easy to find and consume, whether a shopper is using a computer or their mobile device. In addition, consider adding features and functionality to your review display that make it easy for your shoppers to sift through content to find the reviews that are most relevant to them. 

Three
Q&A is (Still) the Most Impactful Type of UGC on Conversion

Online shoppers don’t have the opportunity to ask questions and get recommendations from an in-store associate. Instead, many turn to the Q&A portion of a product page to read questions that have already been submitted – and pose their own. 

There’s a 194.2% lift in conversion when shoppers interact with Q&A content, making it the type of UGC that has the largest conversion impact. 

It’s essential to provide online shoppers with a means to get answers to outstanding questions. Add a Q&A section to your product pages, and be sure to equip it with plenty of features that make it easy for shoppers to sift through existing questions – and ask their own. 

Four
User-Generated Visual Content is No Longer Optional

A growing number of consumers specifically seek out visual content from other shoppers before making a purchase. And this content has a large (and growing) impact on conversion. There’s a 106.3% lift in conversion among visitors who interact with imagery submitted by shoppers – which is up from a 91.4% lift the year prior. 

If you’re not already, start collecting photos and videos from your shoppers, both natively and via Instagram. Then, showcase it in a visual content gallery on your product pages that’s easy to find and navigate.

Five
Ongoing Measurement and Optimization is Key to Maximizing the Potential of Ratings & Review Programs

Throughout this report, we’ve explored the features of UGC that have the largest impact on conversion overall. However, it’s important to remember there’s no “one size fits all” UGC display that’ll work for all businesses. Rather, a feature that’s a powerful conversion-driver for one brand may have very little impact for another.

As such, it’s essential to continuously measure the performance of your UGC program. Your UGC partner should make it easy to determine which UGC features are driving conversion – and which aren’t. You can use those insights to make impactful changes to your display that’ll help you drive an even larger lift in conversion – and help you grow your sales and market share.

Despite Increasing Importance to Consumers, Average Media Coverage for Most Brands Hovers Around 37%

Key Findings:

  • Across verticals, products had 12.8 images and/or videos, on average.

  • The verticals with the most media coverage overall were Toys, Games & Video games; Travel; Financial Services*; and Baby.

  • The verticals with the most media per product included Financial Services*; Medical Components/Supplies; Consumer Appliances & Electronics; and Health & Beauty.

Methodology: Analysis of lifetime Ratings and Reviews submitted across 25.4MM+ online product pages on 3,600+ brand and retailer sites (Qualifier: Activity had to be recorded on the page in the previous 12 month period prior to March 7, 2022). Average rating recorded is the average rating at time of data extraction on March 7, 2022.

99% of consumers look for photos and videos submitted from other customers at least sometimes; 77% do so always or regularly. Visual UGC is especially important to younger consumers, with 91% of Gen Z’ers and 84% of Millennials always or regularly seeking it out. Given the high value consumers place on visual UGC, we analyzed media coverage (percentage of products with at least one user-submitted image or video displayed) and average volume of media per product in a given vertical.

The verticals with the most media coverage overall were Toys, Games & Videogames (68.7%), Travel (58.5%), Financial Services (58.2%), and Baby (52.8%). The verticals with the highest average media per product included Financial Services (58.1), Medical Components/Supplies (31.9), Consumer Appliances & Electronics (26.3), and Health & Beauty (23.3).

Across verticals, there is an average of 12.8 images and/or video per product. The average overall media coverage was 37.0%.

From Marketing Validation to Conversion Booster: The Rise of Visual UGC

User-generated visual content has become increasingly important to consumers. Today, 80% of consumers say photos from other customers are more valuable than those provided by brands or retailers. Five years ago, only 44% felt this way.

Visual UGC is not only important to consumers; it increases their likelihood of conversion. More than half of consumers say imagery provided by previous purchasers is a top factor influencing their purchase decision. When people interact with visual UGC, the conversion rate nearly doubles from 3.4% to 6.6% (an increase of 91.4%). For some verticals, such as Apparel and Home & Garden, the conversion lift is even higher — at 119.1% and 149.9%, respectively.

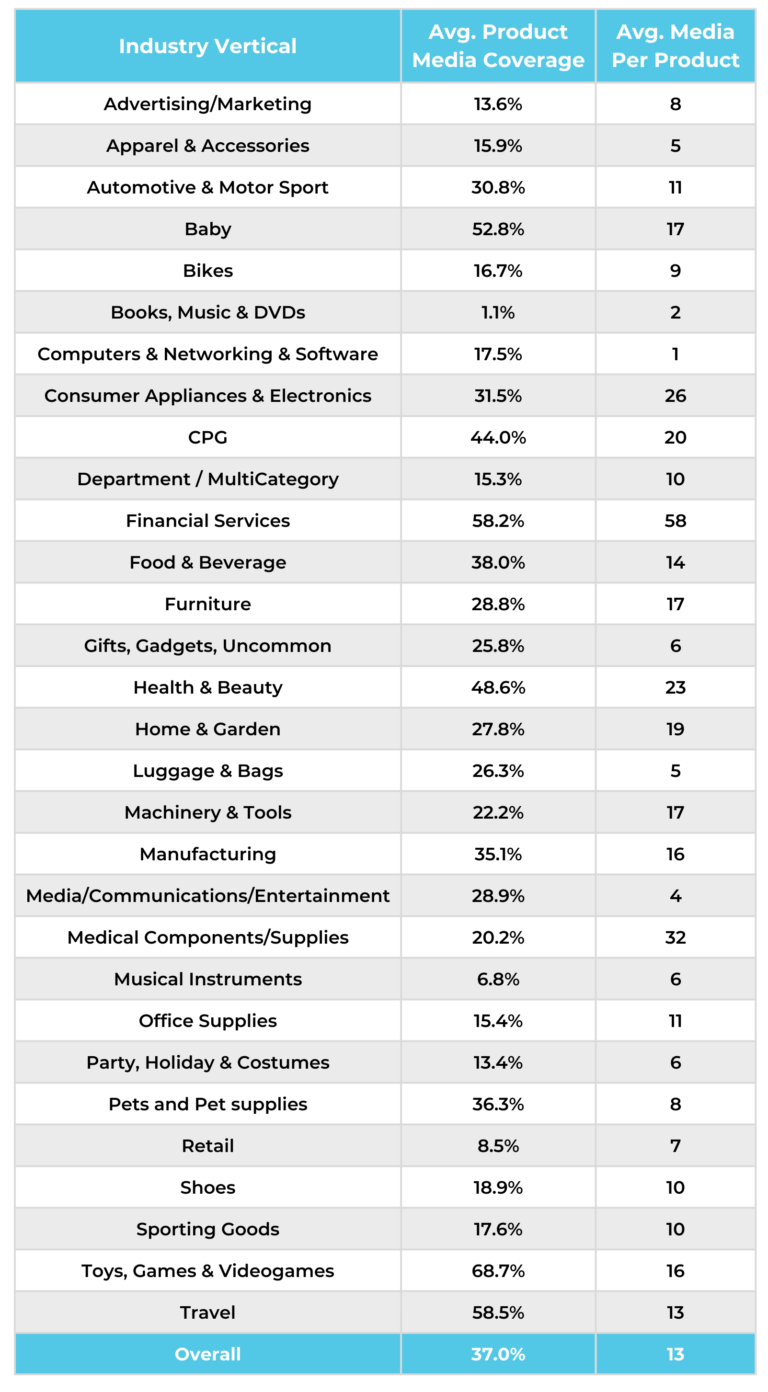
By the same token, a lack of visual UGC can deter purchases. A third of Gen Z shoppers and nearly a quarter (21%) of Millennials won’t purchase a product if there is no visual content from people who previously bought it. Visual media is so important to consumers that 65% of shoppers rate images as the most valuable part of any individual review, even above the review length, title, and aggregated pros and cons lists. 

Visual media has a powerful impact on conversions because it provides context beyond the typical ecommerce product photo carousel. Consumers can see how a shirt looks on the body of someone who isn’t a model, maybe even someone who has a body just like them. They can see how the color looks in different types of lighting. Visual UGC also invites shoppers to visualize using the product in real life. They can see other customers using your milk frother, styling your accessories, or building your desk furniture.

Five Snackable Data-Backed Visual UGC Collection Tips

  1. Incentivize shoppers to provide photo and video: A large swatch of consumers — as many as 85% — need to be incentivized to leave a review. Make it worth their while. Run a product sampling campaign, host a review sweepstakes, or make visual UGC a point-earning activity in your rewards program.

  2. Mine social media for visual UGC: There’s no need to reinvent the wheel. If shoppers have already posted about your products on social media, repost their content to your site, too. Using this strategy, PowerReviews customer Shure Incorporated was able to quickly collect over 1,200 images.

  3. Syndicate images to retailer partners: This can not only help lift conversion rates on partner websites, but can also encourage those customers who you don’t have a direct line of contact with (e.g. email) to add media content to their review. When people see others doing something, they’ll often follow in their footsteps.

  4. Include filters so customers can easily find images and video: Over three-quarters (77%) of shoppers find filtering options useful when browsing review content. The number is even higher among younger consumers. In addition to filters for star rating or “helpful” votes, include one for whether the review includes visual content. 

  5. Make it easy to submit visual UGC: Be clear about what’s required for an upload to be accepted (file format, size, etc.). Ensure your review form and media upload form is mobile-friendly, so customers can upload it on the fly. Allow people to link to photos from Facebook or Instagram as well, increasing the social proof factor. 

*Financial services organizations tend to have an atypical use case for ratings and reviews (e.g. rating of credit card or call center interactions). Specifically, they tend to generate high volumes of reviews on a limited number of products, hence the high volumes of visual media evident here.

More Benchmarks

Sorry, we couldn't find any posts. Please try a different search.

The Average Review Is Only 218 Characters Long, Far Below the Consumer-Preferred 500+ Minimum

Key Findings:

  • Across verticals, the average review is 218 characters long.

  • The verticals with the longest reviews included Media/Communications/Entertainment; Bikes; and Travel. 

  • The verticals with the shortest reviews included Technology; Medical Components/Supplies; and Apparel & Accessories.

Methodology: Analysis of lifetime Ratings and Reviews submitted across 25.4MM+ online product pages on 3,600+ brand and retailer sites (Qualifier: Activity had to be recorded on the page in the previous 12 month period prior to March 7, 2022). Review length aggregates correct at time of data extraction on March 7, 2022.

Review length is an important consideration for consumers, with 68% of consumers always or regularly seeking out longer, more detailed reviews, with nearly all – 97% – doing so on at least an occasional basis. 

88% of consumers regularly or always look beyond the basic summary to read the actual review content. This behavior is even more common among big spenders. 62% of shoppers who spend $2,001+ per month always go beyond basic review information to read the content of reviews, compared to only 41% of those who spend $1-$250 per month.

In our analysis, reviews are 218 characters long, on average. The verticals with the longest reviews included Media/Communications/Entertainment (361 characters), Bikes (307 characters), and Travel (303 characters). The verticals with the shortest reviews included Technology (110 characters), Medical Components/Supplies (111 characters), and Apparel & Accessories (131 characters).

We analyzed review length because longer reviews are not only highly valued by consumers, but they generate more conversions for brands and retailers. How long is long enough?

Reviews of 500+ Characters Drive Largest Conversion Lift & SEO Benefits

Our research shows that reviews of 500 characters or more have the largest impact on conversion rate. Given the averages identified, this should be regarded as a “stretch goal” However, reviews of this length are more than 2 times more likely to be rated as helpful by consumers (people who sort by “Most Helpful Reviews” have the highest conversion rate lift).

Conversion Rate of Visitors that Engaged with Each Feature
Highest Rating
157.8%
Lowest Rating
105%
Images
167.3%
"Most Helpful" Reviews
192.1%
Most Recent Reviews
80.9%
Oldest Reviews
107.3%

Consumers prefer longer reviews because they provide richer detail and more relevant information. They help buyers make more informed decisions, and weigh whether the writer of a review has a use case similar to them. They’re also more likely to contain emotional content about a product that can sway a reader to purchase. 
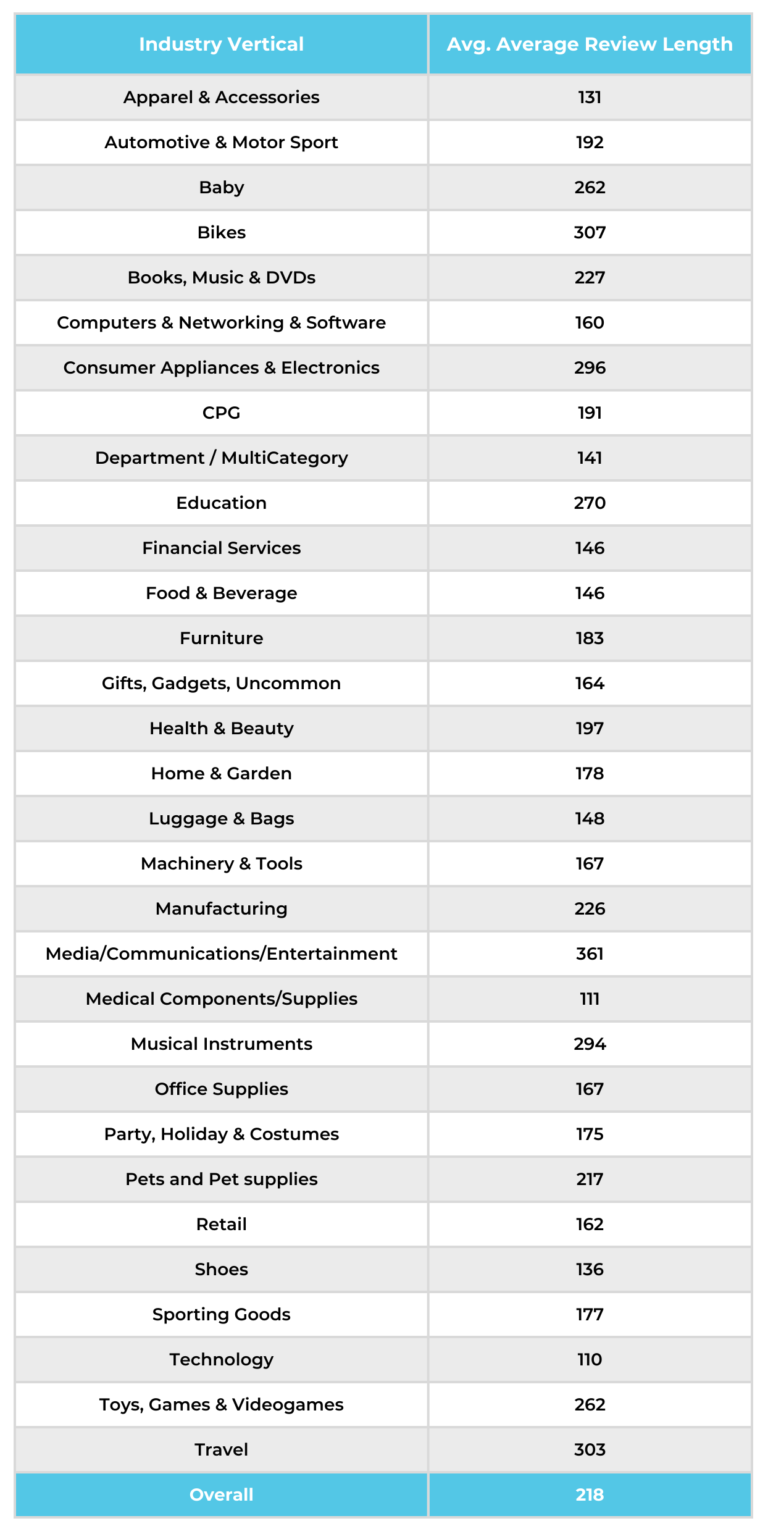
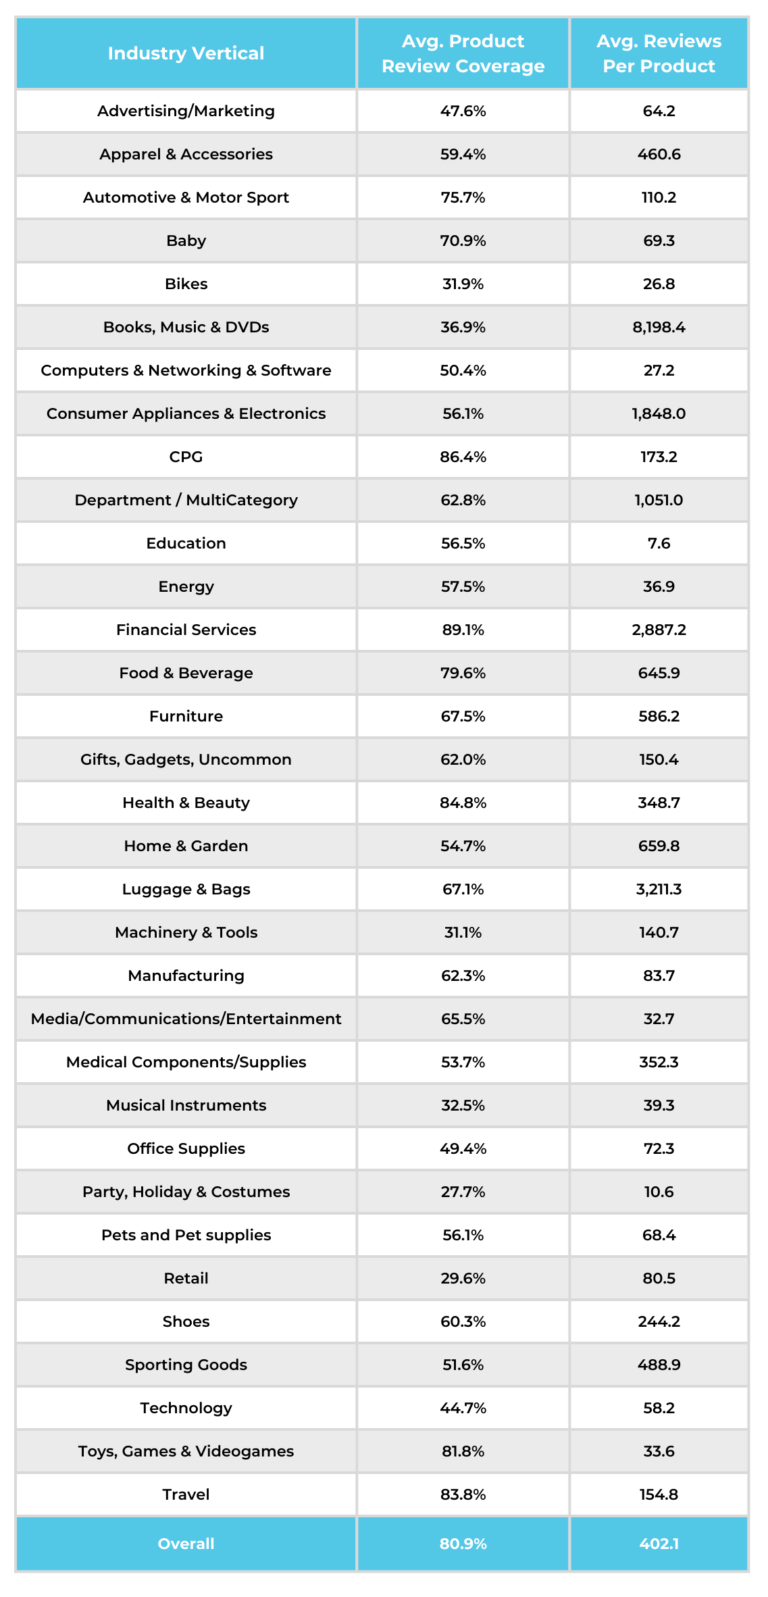
Longer reviews provide additional SEO benefit to brands. Longer reviews are more likely to contain more descriptive content about a product, including more keywords, which can positively contribute to SEO rankings.

Even the highest average in our analysis – 361 characters – still falls far short of the 500+ character stretch goal. There is a clear and significant opportunity for brands to improve their review content and collect longer reviews.

Five Snackable Data-Backed Review Length Tips

  1. Add a character counter to your review form: These track the length of the review and encourage reviewers to keep writing with positive phrases like “Keep going!” and a green progress bar. Customers can still submit a shorter review if they want, but adding some interactivity to the review form can encourage them to leave longer, more helpful reviews.

  2. Optimize your review submission form for longer content: Expand your form beyond the standard text box and star rating. Add clickable pros and cons, use cases, and more for people to choose from. These prevent review writer’s block by giving the reviewer ideas of what they can write about in the text box later on, while also providing more information for you to include in your review display. PowerReviews customer Room and Board provides a great example.

  3. Reward longer reviews: If you have an existing loyalty or rewards program, give your customers more loyalty points when they write longer reviews vs. simply leaving a star rating or a shorter review. As they accumulate more points, they can receive an award like an exclusive discount or gift.

  4. Let customers know that longer reviews are more helpful: 67% of consumers say that “helping and guiding others” motivates them to leave a review, while 65% are motivated by a “desire to help the brand improve the product.” Explain that the more they can share will not only help others make better, more informed purchases, but can also provide valuable feedback to you as the brand behind the product.

  5. Run a product sampling campaign: Send free samples to your customers and ask them to leave a review. Our research shows that product sampling campaigns – when done right – generate reviews that are 29% longer on average. When PowerReviews customer Vornado ran a sampling campaign, they enjoyed even more success, with 44% longer reviews. Reviews submitted through the campaign had 608 characters on average.
  6.  
  7.  

More Benchmarks

Sorry, we couldn't find any posts. Please try a different search.

The Average Product Boasts 402 Reviews, But This Is Still Lower Than Consumer Expectations

Key Findings:

  • Overall review coverage across verticals is 80.9%, with 402.1 reviews per product, on average. 

  • The verticals with the highest overall review coverage included Financial Services; CPG; and Health & Beauty.

  • The verticals with the lowest overall review coverage included Party, Holiday & Costumes; Retail; and Machinery & Tools.

Methodology: Analysis of lifetime Ratings and Reviews submitted across 25.4MM+ online product pages on 3,600+ brand and retailer sites (Qualifier: Activity had to be recorded on the page in the previous 12 month period prior to March 7, 2022). Review coverage data correct at time of data extraction on March 7, 2022.

To benchmark review volume, we analyzed overall review coverage (how many products have at least 1 review) and review coverage per product (the average number of reviews per product). The average review coverage across verticals is 80.9%, with 402.1 reviews, on average, for each product.

The three verticals with the highest overall review coverage included Financial Services (89.1%), CPG (86.4%), and Health & Beauty (84.8%). Those with the lowest overall review coverage included Party, Holiday & Costumes (27.7%), Retail (29.6%), and Machinery & Tools (31.1%). 

On a per-product basis, Books, Music & DVDs shined with 8,198.4 reviews per product, on average, followed by Luggage & Bags (3,211.3 reviews per product) and Financial Services (2,887.2 reviews per product). The verticals with the lowest review coverage per product included Education (7.6 reviews per product), Party, Holiday & Costumes (10.6 reviews per product), and Bikes (26.8 reviews per product).

Financial services stands out as a “top performer” but this does come with a caveat: specifically, the financial services use case for a reviews platform tends to be unique (here are some examples). While every deployment is different, typically these organizations tend to collect reviews on fewer products overall – which goes some way to explaining the results here.

While the idea of having 1,000+ reviews per product may sound astronomical, the winners here are not exceeding consumer expectations; rather, they are meeting them.

The Importance of Review Coverage: Consumers Expect High Review Volumes

Review coverage is one of the top factors shoppers consider when reading reviews, second only to star rating. 79% of consumers “always” or “regularly” consider review volume. In late 2021, we surveyed more than 9,000 consumers about their expectations for review coverage. One in four consumers told us that ideally, a product would have more than 500 reviews. In this Benchmark Report, fewer than one-quarter (23%) of the verticals meet this expectation. 

Increasing review coverage is not just about meeting consumer expectations, it also drives tangible benefits for brands: review coverage has an exponential impact on purchasing behavior. 64% of consumers say that they are more likely to buy a product with 1,000 reviews than one that has only 100, assuming they have the same average star rating. This number is even higher among Gen Z shoppers (80%) and Millennials (74%). 

When a product goes from 0 reviews to 1, the conversion rate increases by 52.2%. Collect 51 to 100 reviews, and the conversion rate is 148.7% higher. When you start collecting reviews in the thousands, the conversion rate keeps increasing — illustrating that when it comes to reviews, more is always better. For example, there’s a 296.2% lift in conversion among shoppers who are exposed to 5,000 or more reviews.

Conversion Lift Relative to Number of Reviews Displayed
0 Reviews Displayed
0%
1-100 Reviews Displayed
76.7%
101-250 Reviews Displayed
143.2%
251-500 Reviews Displayed
166.4%
501-1000 Reviews Displayed
172.1%
1001-5000 Reviews Displayed
224.7%
5000+ Reviews Displayed
292.6%

It is easy to understand why a product with 0 reviews has a lower conversion rate. If we change the baseline to 1 to 100 reviews, however, we still see an incredible conversion lift when products begin accumulating over 1,000 reviews. For example, products with 1,001 to 5,000 reviews convert at a rate 83.7% higher than those with 1 to 100 reviews. Reach 5,000 reviews, and the conversion rate increases by 122.1%!

Conversion Lift Relative to Number of Reviews Displayed
1-100 Reviews Displayed
0%
101-250 Reviews Displayed
37.6%
251-500 Reviews Displayed
50.7%
501-1000 Reviews Displayed
54%
1001-5000 Reviews Displayed
83.7%
5000+ Reviews Displayed
122.1%

Review coverage is especially important when customers are purchasing new products or brands, according to 71% of consumers

Consumers consider review coverage to be particularly important for certain verticals, including Consumer Appliances & Electronics, Health & Beauty; Apparel & Accessories; Furniture; and Pet Supplies. However, no matter your vertical, the message is clear: more reviews are always better. The journey to 1,000 reviews starts with these five tips.

Five Snackable Data-Backed Review Volume Tips

  1. Follow up with every customer to leave a review: Our research shows that nearly 80% of all review content comes from an email request. Send an email to every verified purchaser asking them to review their purchase. Follow up after 7 days for seasonal products, 14 days for perishable and soft goods, and 21 days for hard goods.

  2. Prioritize: Review coverage is a big concern for pretty much every brand and retailer. Where possible, look to prioritize collection for products with few (or no) reviews.

  3. Get creative: While email is the most common review collection method, there are others. Asking for reviews via text message and on store receipts are two such examples. Are you maximizing your opportunities to ask for reviews?

  4. Incentivize: When La Colombe Coffee Roasters ran a review sweepstakes, the brand generated over 6,000 reviews across 90% of their products, leading to a 3X conversion lift. The campaign was so successful the brand now runs a quarterly sweepstakes. Similarly, 73% of consumers say they need an incentive to write a review, be it a purchase discount or loyalty points. Make writing a review a point-earning activity in your customer loyalty program. When customers are sent a free product sample, they are also more likely to write a review. This is why product sampling is such a commonly used technique.

  5. Syndicate your reviews to retail partners: By syndicating your reviews, you can drive review coverage across your brand’s website as well as those of your retail partners, such as Amazon, Target, and Walmart. This ensures that consumers are presented with a high volume of reviews to read, no matter where they prefer to buy your products.

More Benchmarks

Sorry, we couldn't find any posts. Please try a different search.

Across Verticals, Average eCommerce Product Rating is 4.5 Stars

Key Findings:

  • Across verticals, our data shows that the average rating for any given product is 4.5 stars out of 5.

  • The verticals with the highest star ratings included Advertising / Marketing (4.9 stars), Technology (4.8 stars), and Financial Services and Media / Communications / Entertainment, both at 4.7 stars.

  • The verticals with the lowest ratings included Energy (3.4 stars), and Baby, Education, and Computers & Networking & Software, all at 4.2 stars.

Methodology: Analysis of lifetime Ratings and Reviews submitted across 25.4MM+ online product pages on 3,600+ brand and retailer sites (Qualifier: Activity had to be recorded on the page in the previous 12 month period prior to March 7, 2022). Average review length recorded is based on review length at time of data extraction on March 7, 2022.

Across verticals, our data shows that the average rating for any given product is 4.5 stars out of 5. This is actually the exact star rating we recommend brands aim for, as a sizable number of consumers are suspicious of perfect 5-star ratings, including 46% of shoppers overall and 53% of Gen Z shoppers

Even the vertical with the highest star rating — Advertising/Marketing — has a 4.9 rating as opposed to a 5. The verticals with the next highest ratings include Technology, at 4.8 stars, and Financial Services and Media / Communications / Entertainment, both at 4.7 stars. 

Previous research we conducted with Northwestern University found that shoppers are most likely to purchase products with an average star rating between 4.2 and 4.5 stars. Our latest benchmarks indicate that the sweet spot has risen slightly since but we continue to see the highest conversion rates in the 4.25 – 4.99 average rating range. Positively, only one vertical — Energy — fell beneath this baseline star rating, with 3.4 stars out of 5.

Ratings and reviews are the single most important factor impacting purchase decisions, ranking above price, free shipping, brand, and recommendations from family and friends. 97% of consumers read ratings and reviews prior to making a purchase. Among them, the star rating is the first thing shoppers notice, with 77% considering the average rating of a product when reading reviews.

Five Snackable Data-Backed Average Rating Tips

  1. Regularly solicit feedback and new reviews: Be willing to ask for reviews more than once. One in three people need to be asked two or three times before they leave a review. Follow up at least two times, and 96% of consumers say they will write a review.

  2. Prominently display star ratings on product detail pages: Include a breakdown of the overall star ratings, so people can see how many shoppers rated 5, 4, 3, 2, or 1 stars. This allows shoppers to click on any of the bars to see only reviews of a certain star rating. Shoppers who click on these filters convert at 111.8% the rate of those who visit the same page and do not.

  3. Don’t be afraid of negative reviews: 62.4% of shoppers actively seek out one-star reviews by clicking on these star breakdowns — and they still convert at a rate that’s 108.8% higher than average. Negative reviews are an important tool shoppers depend on to make informed purchase decisions. One-star reviews can actually help shoppers confirm a product is right for them, if the one-star reviewer had a different use case or pain point. Negative reviews can also help brands reduce returns. 70% of consumers say they would have been less likely to return a product they purchased online if they had consulted the ratings and reviews first.

  4. Read and respond to reviews: Listen to the feedback provided by your customers, and use it to inform new features and product redesigns. When relaunching a new and improved product, share free samples to generate new reviews quickly. Between 85% to 91% of consumers say receiving a product free of charge, or before it’s sold to the general public, would incentivize them to write a review.

  5. Focus on experience: Providing a positive customer experience should always be a brand’s first priority, as that will naturally drive positive ratings and reviews. When asked what motivates them to write a review, 91% of consumers responded with “a positive experience,” while 76% who responded “a negative experience.”
  6.  

More Benchmarks

Sorry, we couldn't find any posts. Please try a different search.