








Now’s the time for brands and retailers to start preparing for the 2022 holiday shopping season. But what can they expect?

Here’s a snapshot of when consumers will start checking off their lists, where they’ll shop, how much they’ll spend, and what will fuel their purchase decisions, according to 12,866 U.S. shoppers.

When Holiday Shopping Will Start

In the past, Black Friday was the official kickoff to the holiday shopping season. But now shoppers are getting an increasingly earlier start.
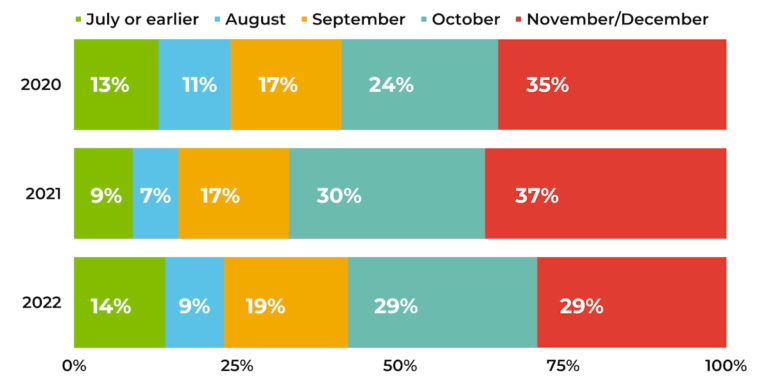
Many Shoppers are Starting Early
When did/do you expect to start thinking about your holiday shopping this year?
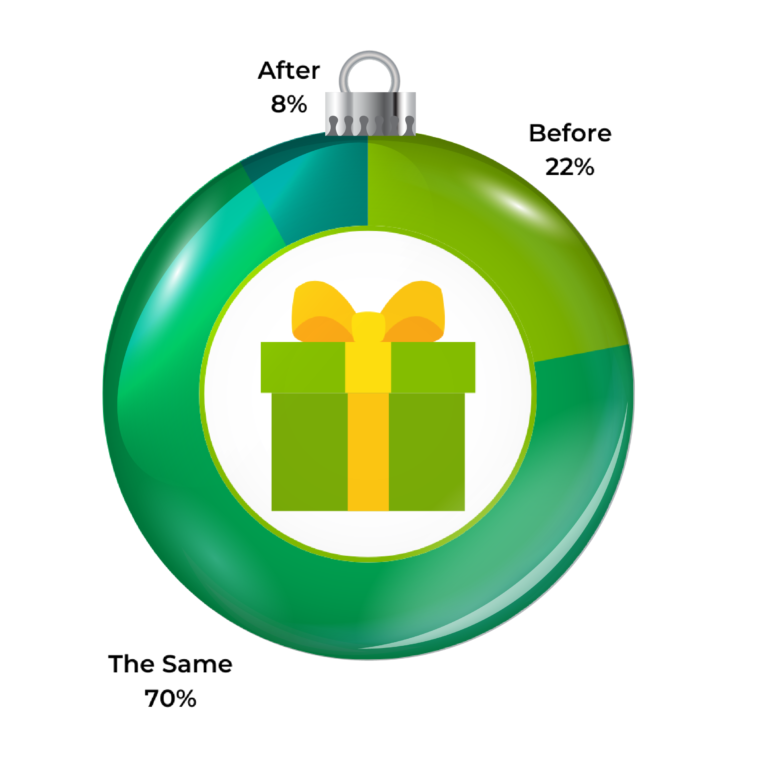
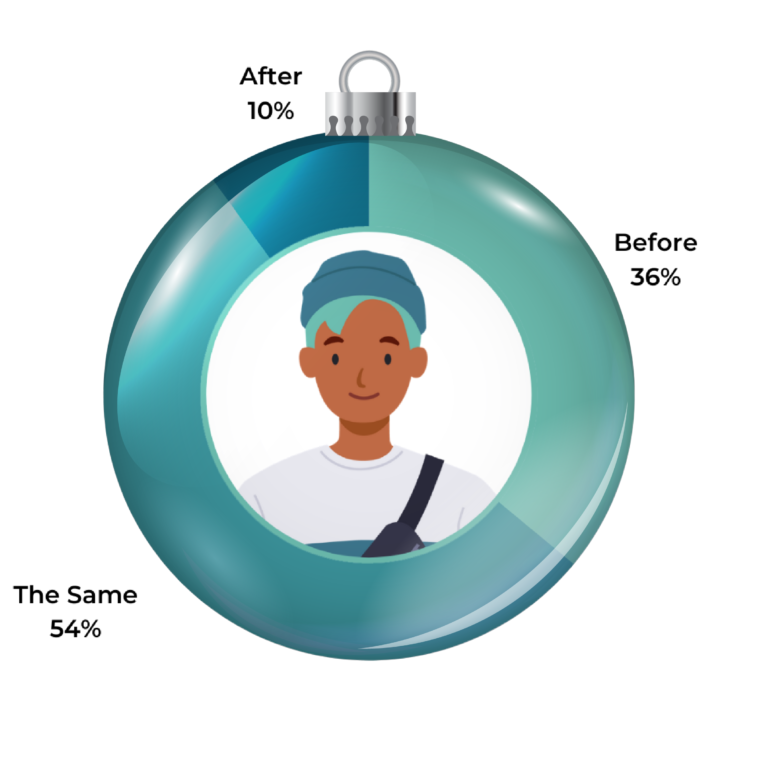
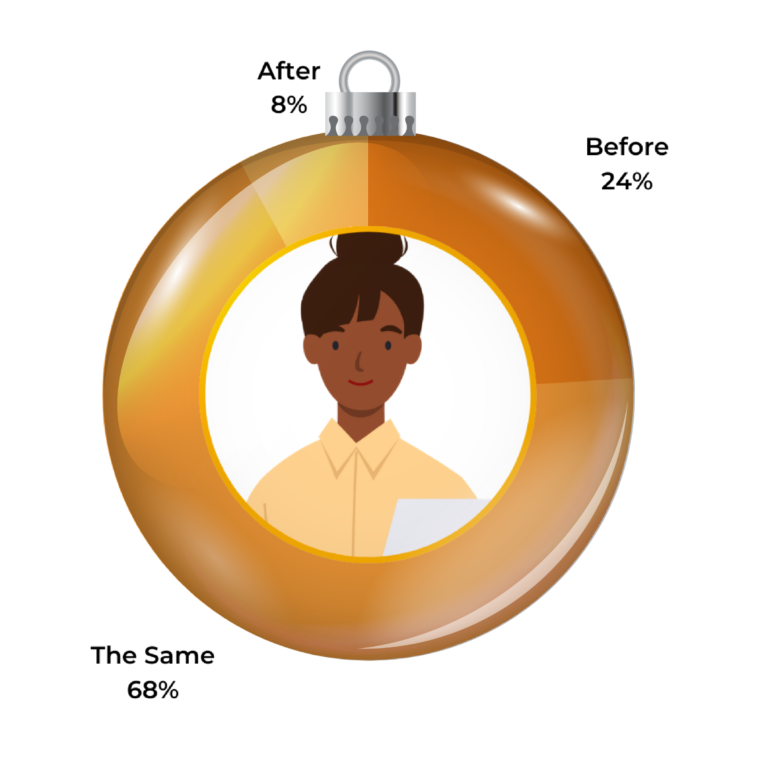
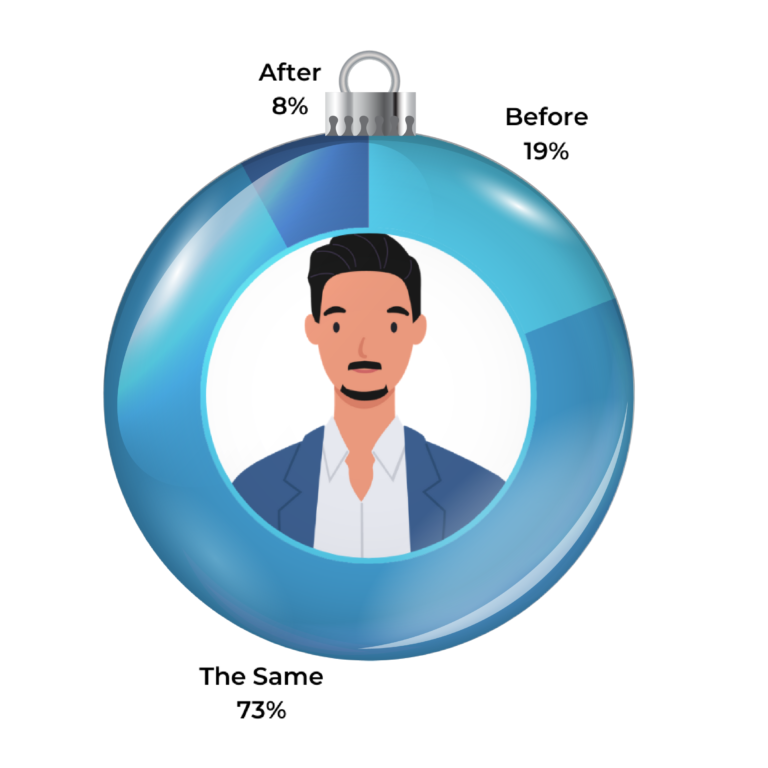
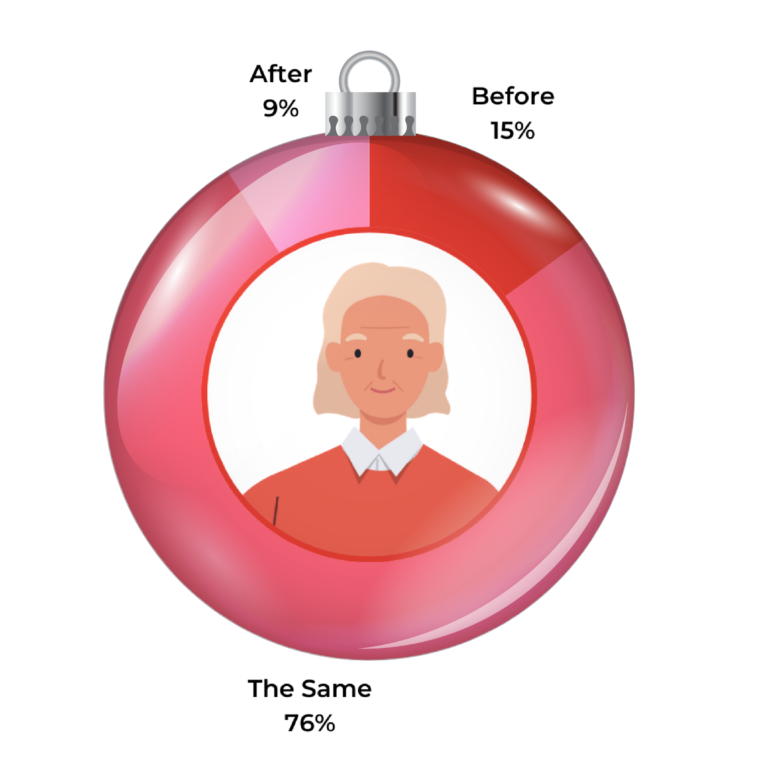
Most Will Start Their Holiday Shopping at the Same Time as Usual
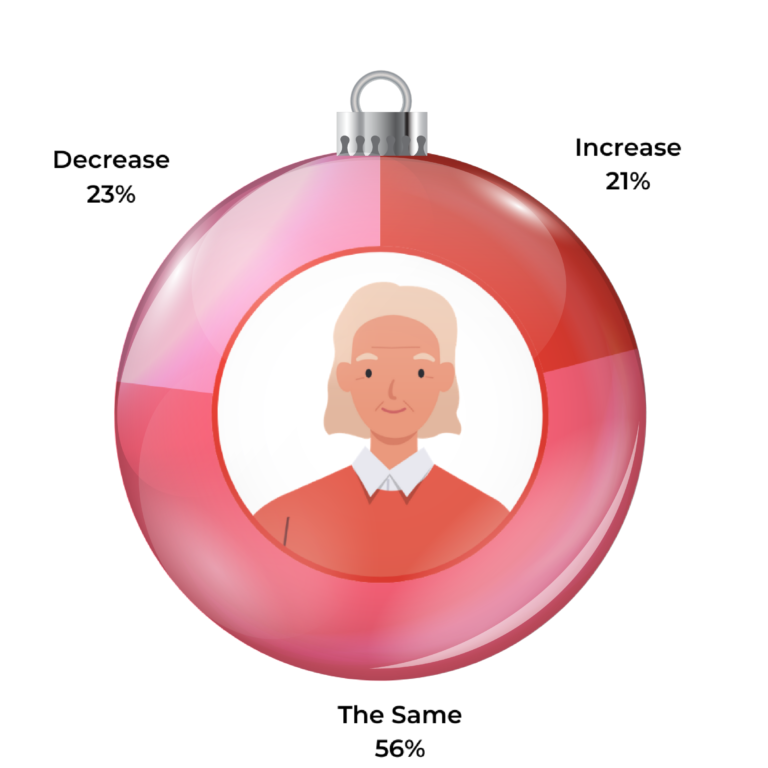
Do you plan to start your holiday shopping before or after you typically do?
Overall
Gen Z
Millennials
Gen X
Boomers

Expected Holiday Spending

There have been plenty of headlines about the slowing economy and high inflation. But how will these factors impact holiday spending?
Holiday Spend Breakdowns
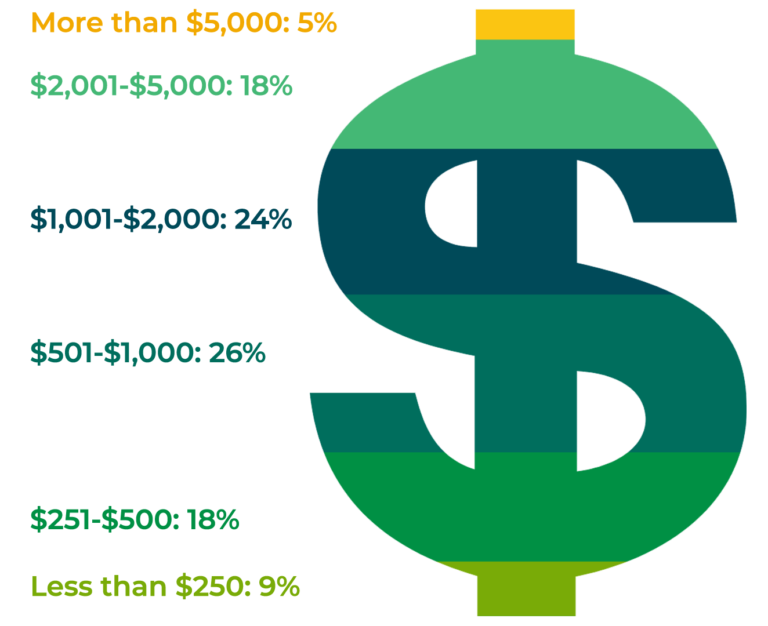
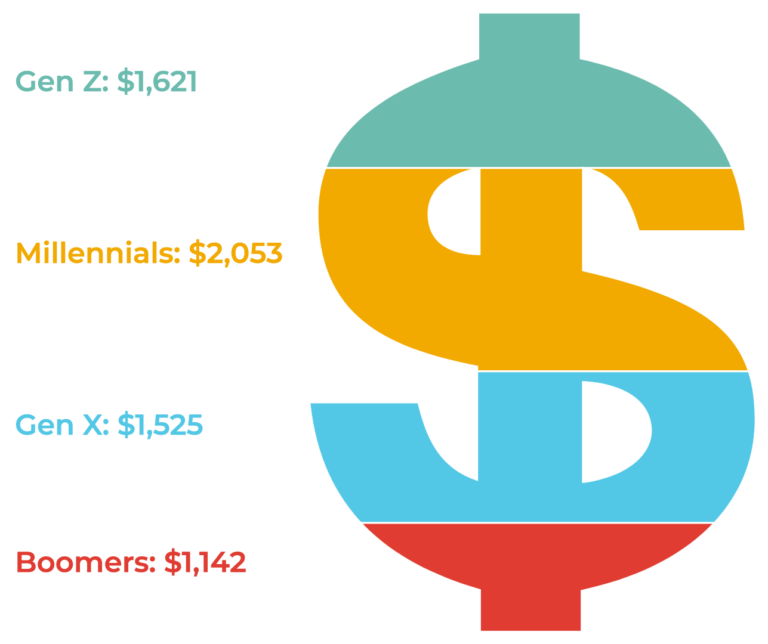
Total Anticipated Holiday Spend
Average: $1,802
Anticipated Online Holiday Spend
Average: $1,212
Generational Differences
Total Anticipated Holiday Spend
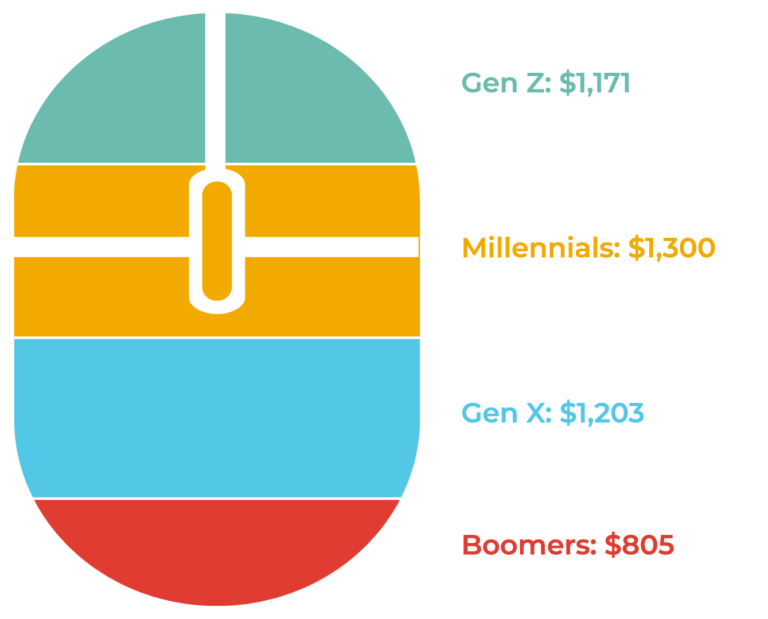
Anticipated Online Holiday Spend
Millennials will drop more cash than any other generation, but will spend the lowest proportion (63%) online
Gen X will spend the highest proportion online (79%) of any generation.
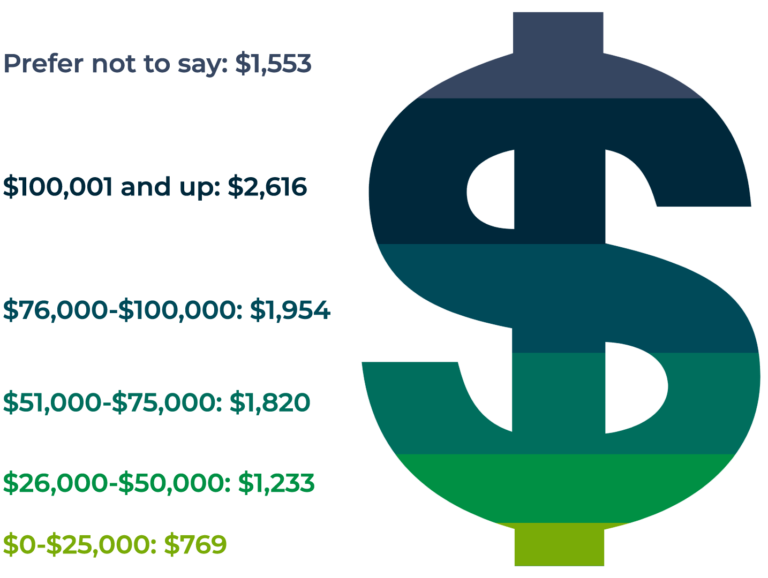
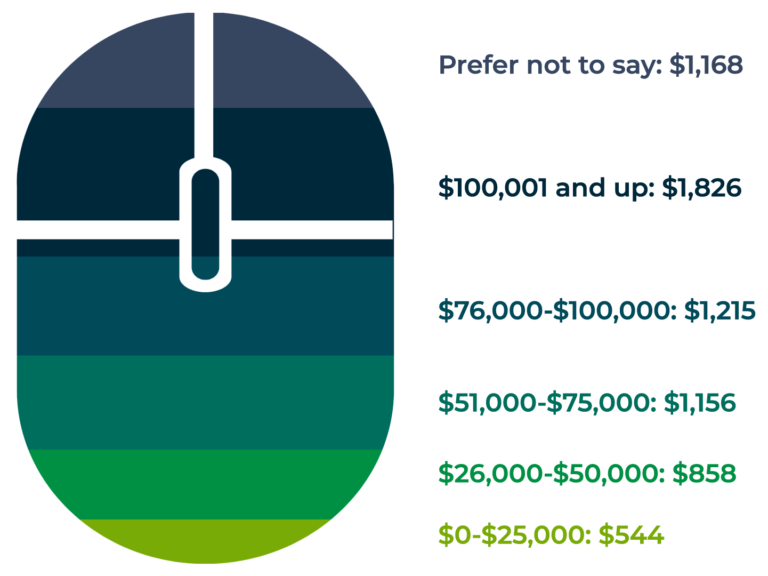
Holiday Spend By Household Income
Total Anticipated Holiday Spend
Anticipated Online Holiday Spend
*Respondents were asked to consider all Holiday-related spend - including events / activities, gifts, meals - for responses to these questions

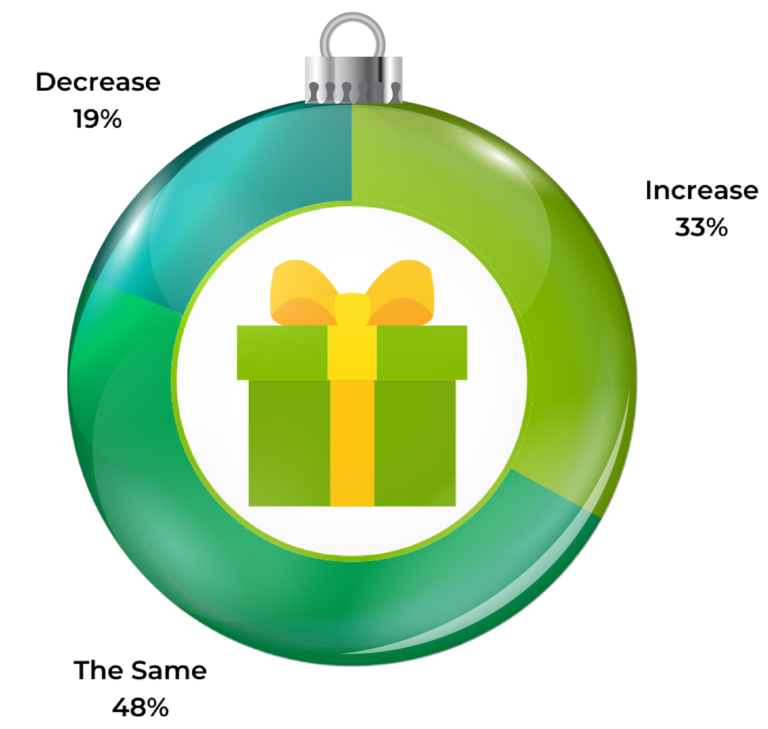
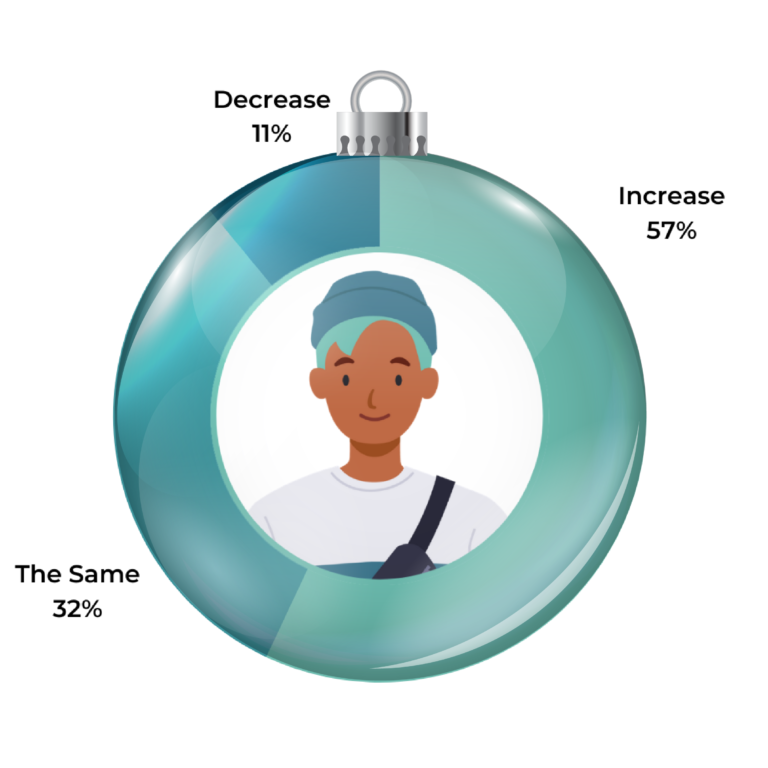
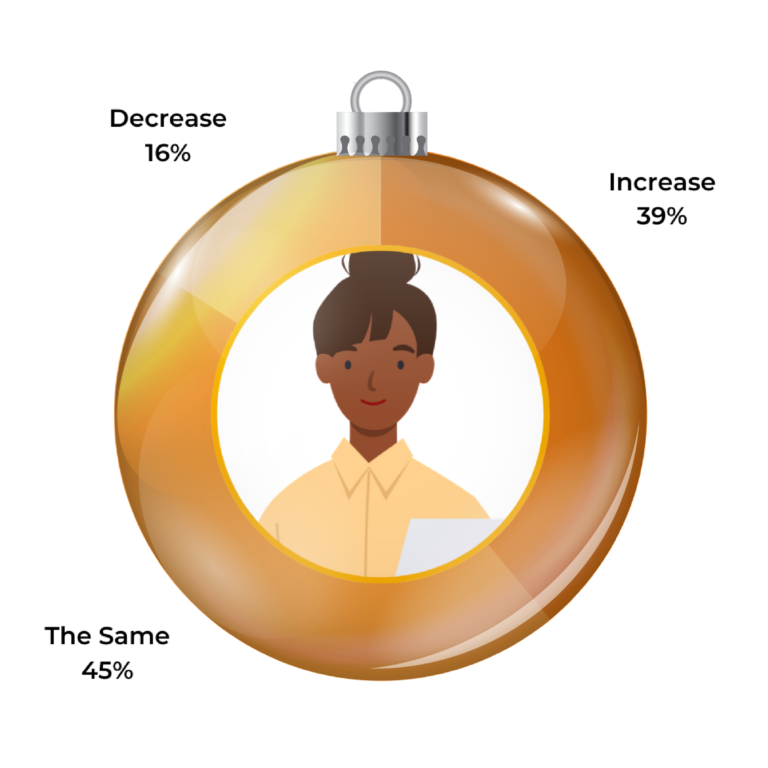
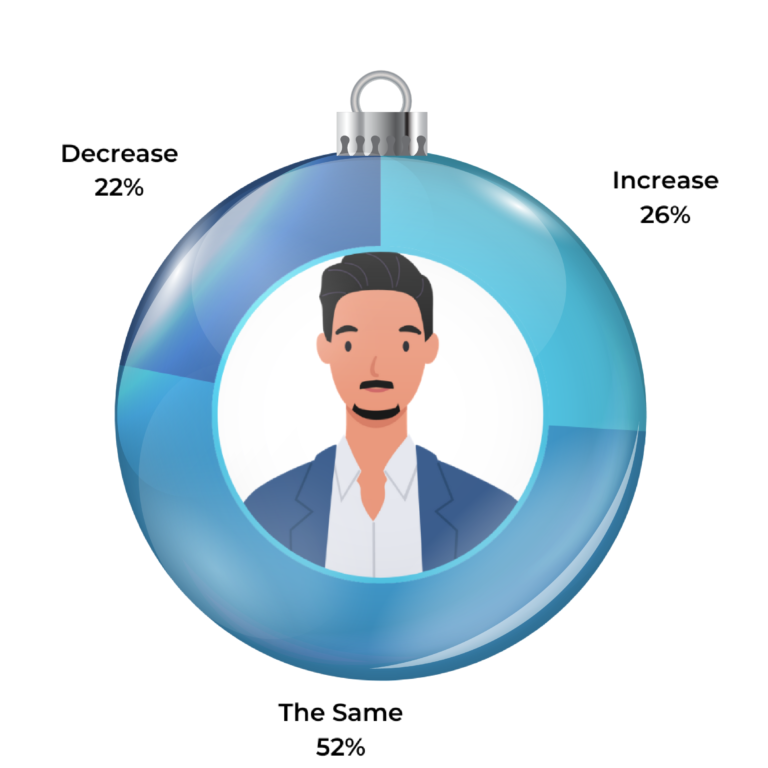
How 2022 Holiday Shopping Will Compare to Last Year

How is this year’s overall, online and in-store holiday spending expected to compare last year? Let’s take a closer look.
Total Anticipated Holiday Spend: 2021 vs 2022 (online and in store)
Do you plan to spend more or less on holiday shopping this year compared to last year?
Overall
Gen Z
Millennials
Gen X
Boomers

Where Consumers Will Shop Online This Holiday Season

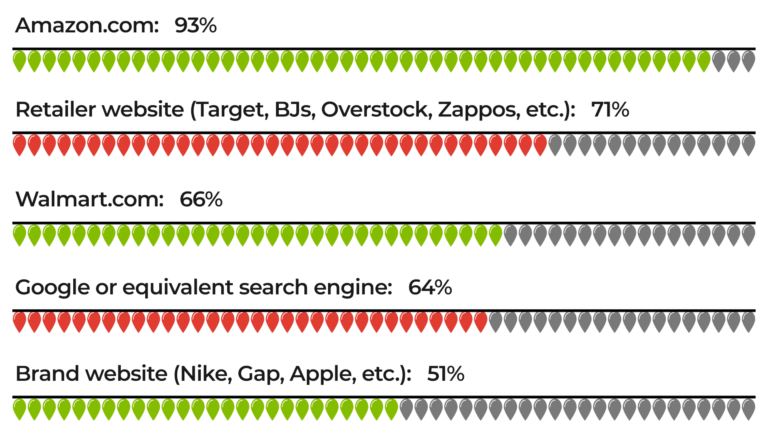
There are nearly endless online shopping options. Here’s a look at where this year’s holiday shoppers will go online to check off their lists.
Top Online Destinations for 2022 Holiday Shopping

Top Factors That’ll Influence Holiday Shopping Decisions

Consumers will weigh many factors when shopping for themselves and others this holiday season. As in previous years, price and ratings and reviews consistently come out on top.
Top Considerations When Purchasing Gifts for Others
Price
2022 92%
2021 82%
2020 87%
Ratings & Reviews
2022 72%
2021 71%
2020 71%
Shipping/delivery costs
2022 69%
2021 65%
2020 68%
Ease/speed of shipping
2022 58%
2021 60%
2020 60%
Trustworthiness of brand
2022 47%
2021 58%
2020 56%
Refund/Returns Policy
2022 43%
2021 44%
2020 43%
Familiarity with Products or Brands
2022 41%
2021 57%
2020 54%
Family/Friends Recommendations
2022 40%
2021 46%
Values of the Manufacturing Brand
20%
35%
33%
Search Engine Ranking
2022 13%
2021 18%
18%
Brands/Influencers on Social Media
2022 11%
24%
Top Considerations When Shopping for Yourself
Price
2022 93%
2021 79%
2020 85%
Ratings & Reviews
2022 68%
2021 68%
2020 67%
Shipping/delivery costs
2022 67%
2021 59%
2020 63%
Ease/speed of shipping
2022 52%
2021 54%
2020 56%
Trustworthiness of brand
2022 51%
2021 53%
2020 52%
Refund/Returns Policy
2022 44%
2021 43%
2020 41%
Familiarity with Products or Brands
2022 43%
2021 53%
2020 51%
Family/Friends Recommendations
37%
39%
Values of the Manufacturing Brand
22%
34%
33%
Search Engine Ranking
2022 15%
18%
19%
Brands/Influencers on Social Media
2022 12%
25%

A Solid UGC Strategy Can Help Make Your Holiday Season Extra Merry

Ratings and reviews will be a key consideration for shoppers this holiday season – ranking only behind price in terms of importance. In fact, consumers will turn to reviews whether they’re shopping for themselves or others during the upcoming holiday period. 

Ready to brush up your ratings and reviews strategy to give holiday shoppers what they’re looking for? Check out our Complete Guide to Ratings and Reviews

More Reviews and Stronger Average Ratings Increase Product Page Visits

Key Findings:

  • Basic review information – typically review count and average rating – is usually displayed at earlier discovery-focused stages of the digital shopping journey to create interest and ultimately drive traffic to specific product pages.

  • This article explores the relationship between review information and resulting page views by examining shopper activity across a representative sample of 8.8 million product pages.

  • A higher volume of reviews and favorable average product ratings clearly drive more traffic to product pages.

When it comes to conversions on product pages and reviews, the evidence is very clear: a strong reviews footprint (i.e. average ratings of more than 4 stars and high review volumes) leads to more conversions.

But how much of an impact does review footprint have on attracting shoppers to product pages in the first place? We analyzed shopper interaction data from more than 8.8 million product pages to find out.

Understanding the Digital Shopper Journey

Average rating and review volume are displayed prominently throughout most digital shopping journeys, being prioritized by most sites at the early stages of the funnel.

Typically, this information is published alongside a product image, price (including any discount) and shipping specifics on Product Listing Pages (PLPs), search result pages and even – in some cases – home pages.

Review Volume Impact on Traffic - All Ecommerce Sites

The below two charts are an analysis of all time site behavior across an illustrative sample of more than 8.8 million Product Display Pages (PDPs) from brand and retailer sites – which accounts for more than 27.7 billion page visits in total.

The chart highlights the percentage of total PDPs that exist of those we analyzed with the corresponding review volumes at the time the data was pulled.
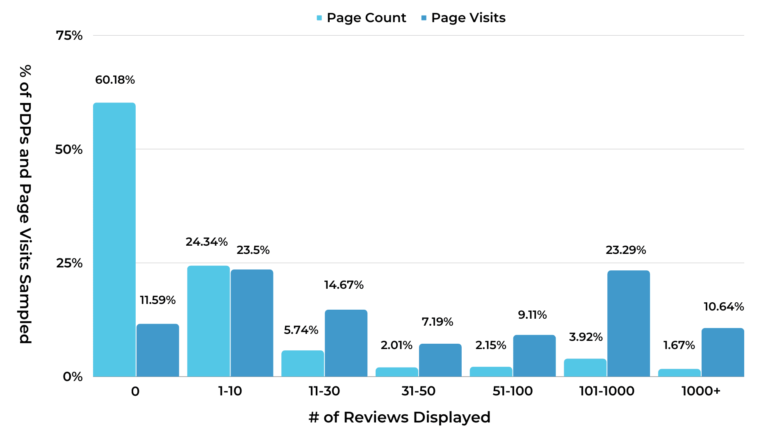
Once a page has reviews displayed, it outperforms in terms of % of visitors going to that page relative to the % of total product pages it represents.
Analysis based on an illustrative sample of 8,841,414 Product Display Pages (PDPs) - which accounts for 27,702,856,033 page visits in total. Review volume data correct as at August 11, 2022.
Bottom line: having any reviews on your product pages drives more traffic to those pages.

Across all the product pages we analyzed, the overwhelming majority (60.2%) don’t have any reviews. However, these PDPs only accounted for 11.6% of all page visits. This firstly demonstrates the huge opportunity for brands and retailers with review-less product pages.

Beyond that, this analysis clearly illustrates how the presence of reviews leads to significantly higher volumes of traffic to product pages.

The obvious next question to ask is how many reviews do I need to experience the benefits? This is never an easy question to answer as there is so much nuance and individual circumstance involved.

In the above, for example, around a quarter of all page visits occur on pages with between one and ten reviews. But this also accounts for a similar proportion of pages analyzed.

There are simply fewer pages with higher review volumes, and that’s because collecting reviews is hard. This means that that dataset is smaller.

However, we start to see the biggest increments in traffic for products with 11 reviews or more. And the numbers for pages with more than 100 reviews clearly standout.

Overall, these account for 2% of pages but 31% of traffic (both totals are rounded to the nearest whole number). So we can say with confidence that this should be the aspiration for all brands and retailers looking to get more eyeballs on their product pages and their products.

Review Volume Impact on Traffic - Retailer Sites

Brands selling their products on retail sites are of course preoccupied with standing out on and maximizing returns from those channels. So, drivers of traffic to PDPs is something they should be thinking about – assuming they are not already.

In this section, we therefore restrict the analysis to the retailer websites included in the above sample – examining the relationship between product page visits and review volumes on those product pages.
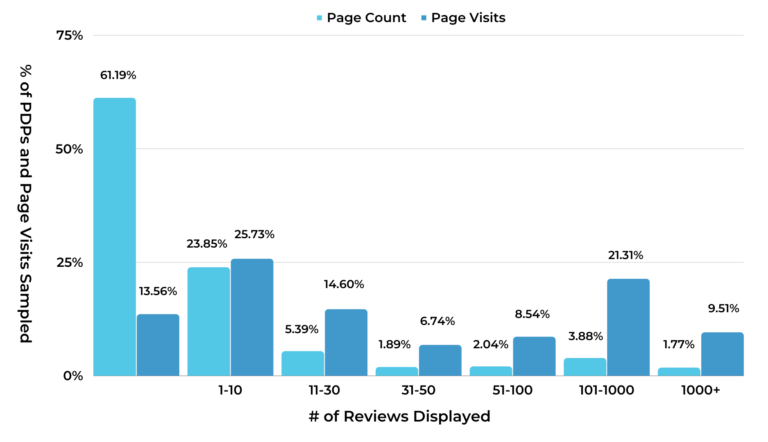
Distribution of Page Visits by Review Volume on Retailer Sites
Analysis based on an illustrative sample of more than 8,105,477 Product Display Pages (PDPs) - which accounts for 19,838,070,215 page visits in total. Review volume data correct as at August 11, 2022.

While the numbers deviate a little, the main trends are similar to the combined brand and retailer analysis. 

For brands looking to stand out on retail channel websites, there are three key takeaways: while the majority of product pages (61%) do not have reviews, those that do attract significantly more traffic and – for the most part – the more reviews, the bigger the page view gains.

In other words: ensuring that you have the maximum volume of reviews on your product pages on retailer sites is a critical retail channel marketing strategy.

Average Rating Impact on Traffic - All Ecommerce Sites

Typically, an average rating is displayed alongside a review count at any time it is highlighted in the buyer journey. The chart directly below – a different methodology from the above analysis – highlights the lift in traffic volumes over the average rating band with the lowest review volume (1.0 – 1.9 average rating).

For full transparency, we also wanted to highlight the average review volumes of products in each of the average rating bands. This is the total volume of reviews for products in that average rating band divided by the total volume of products in that average rating band. 

As identified in the above section, review volume clearly has a factor on traffic and – as indicated here – is correlated to the average rating of the product.
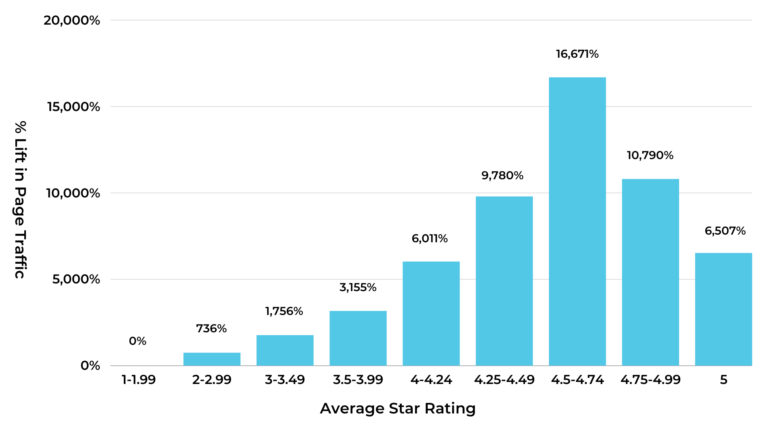
Impact of Average Star Rating on Page Traffic
Analysis based on an illustrative sample of 8,841,414 Product Display Pages (PDPs) - which accounts for 27,702,856,033 page visits in total. Review volume data correct as at August 11, 2022.

In line with our conversion-based analysis on the impact of average ratings, the largest gains in Product Display Page (PDP) views occur above the 4.0 star mark. So this should be the aspiration for all brands and retailers running a ratings and reviews program.

Products in the 4.5 – 4.99 average rating range attract the most traffic and highest review volumes, making this the absolute sweet spot.

Consumers are skeptical of 5.0 average star ratings. They typically follow the mantra: if something looks to be good to be true, it invariably is.

Average Rating Impact on Traffic - Retailer Sites Only

But what impact does average rating have specifically on retail sites for brands that use these as key sales channels?

In this section, we again restrict our analysis to the retailer websites included in our sample – examining the relationship between product page visits and average rating on those product pages.
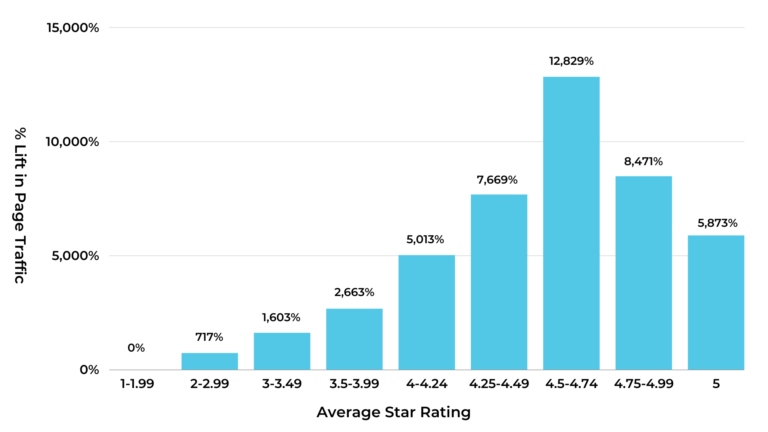
Impact of Average Star Rating on Page Traffic for Retailer Sites
Analysis based on an illustrative sample of more than 8,105,477 Product Display Pages (PDPs) - which accounts for 19,838,070,215 page visits in total. Review volume data correct as at August 11, 2022.

As with the brand and retailer analysis, the retailer only segmentation demonstrates the same themes: that more than four stars should be the goal and that 4.5 – 4.99 average rating range is the absolute sweet spot for traffic (and review volume).

However, the specific numbers do differ slightly. For example, 4.5 – 4.74 average rating products experience lower traffic lifts in the retailer only analysis (12,829% vs 16,671% for brands AND retailers).

But – really – this is splitting hairs. The overall impact of a strong average rating on product page traffic is immense whichever way you slice it.

Key Takeaways

  1. Your ratings and reviews footprint and presence has a significant impact on your ability to capture interest earlier in the customer journey and pull shoppers into your funnel.

  2. You should aim for a minimum average rating of 4.0 stars across a minimum of 11 reviews for each product in order to drive traffic to your product pages.

  3. However, any improvement on either of these baselines will create meaningful performance improvements.

Note: We use the terms Product Display Page (PDP) and Product Page interchangeably above. They have the same meaning in the context of this article.

More Benchmarks

Sorry, we couldn't find any posts. Please try a different search.

Consumers’ growing concern with fake and manipulated product review footprints – and how brands and retailers can preserve the authenticity of this content, according to a survey of more than 3,200 shoppers in the UK

Survey at a Glance:

The Growing Threat of Fake Reviews for Brands and Retailers in the UK is based on survey responses from 3,265 consumers in the UK from July 2022. Here’s a sneak peek of our key findings.

Fake Reviews are Top of Mind for Consumers
  • When reading reviews, 90% of consumers in the UK are concerned about fake content.

  • While they’re concerned about the entire ecommerce ecosystem, one site rises far above the others: Amazon. 83% are concerned with review reviews on Amazon.co.uk.
Fraudulent Reviews are Common – and Their Presence Negatively Impacts Purchase Behaviour
  • 87% of consumers think they’ve read a fake review in the past.

  • 67% of shoppers in the UK indicate that they’d be less likely to purchase a product if they found what they thought was a fake review. 
Consumers Value Review Authenticity – and Brands and Retailers Must Preserve It
  • When browsing reviews, 71% of consumers consider how authentic the content is.

  • 82% of UK shoppers regard reviews tagged with information about the source of said review as more authentic and real. Verified buyer and verified reviewer tags have a particularly favourable perception among shoppers.
When Perfect Isn’t - In Fact - Perfect
  • A mere 6% of shoppers believe that the ideal star rating for a product they’re considering is a perfect 5.0.

  • The largest portion of shoppers – 45% – say that the ideal average star rating falls between 4.0 and 4.49. 
Chapter 1

Introduction

The vast majority of consumers rely on reviews to make informed purchase decisions – whether they’re shopping online, in-store, or some combination of the two. Consumers value this content because it’s honest, authentic and unbiased – for better or worse. 

But there are threats to this authenticity: fake reviews and manufactured review presences (i.e. creating an artificially positive representation of the product by blocking negative reviews).

Recently, there have been plenty of news stories about rising concerns over fake reviews – and businesses that suppress negative content. In fact, governments are even stepping in to squelch this growing problem. The European Union (EU) Omnibus Directive 2019/2161, which came into effect in 2020, expands regulations to protect consumers – including stricter demands on fake and misleading reviews. And earlier this year, in the US, the Federal Trade Commision (FTC) fined clothing retailer Fashion Nova $4.2m for suppressing negative reviews.

It’s undoubtedly a global problem. But the fake and inauthentic reviews issue has perhaps garnered more attention in the UK than anywhere else.

Fake reviews – and suppressing negative content – misleads consumers. This leads to poor purchase decisions. It’s a short-term play that will catch up with the brand concerned before long. But that doesn’t mean it can’t be effective to driving sales before it does.

What’s more, the presence of fake reviews can tarnish a business’ hard earned reputation. And failing to publish negative content can cause consumers to lose trust in a brand or retailer.

Now, more than ever, brands and retailers must make it a priority to preserve the authenticity of reviews. But why? And how?

Recently, we surveyed more than 3,200 consumers in the UK to understand the importance to shoppers of review authenticity – and what can be done to preserve it. In this report, we share our key findings – as well as recommendations for brands and retailers looking to preserve consumer trust.

Chapter 2

Who We Surveyed

This report is based on an analysis of a survey completed by 3,265 UK consumers during the month of July 2022. Here’s a snapshot of who we surveyed. 

Generations

Gen Z
(1997-present)
3%
Millennials
(1981-1996)
52%
Gen X
(1965-1980)
38%
Baby Boomers
(1946-1964)
7%

Household Income

£0-£25,000
29%
£26,000-£50,000
34%
£51,000-£75,000
18%
£76,000-£100,000
7%
£100,001+
3%
Prefer not to say
9%

Monthly Online Spend

Nothing
1%
£1-£50
16%
£51-£100
33%
£101-500
35%
£501+
11%
Prefer not to say
4%
Chapter 3

Growing Concern About Fake Reviews

These days, the majority of consumers consult reviews when shopping for just about anything. But for consumers in the UK, fake reviews are top of mind.

Most Consumers are Concerned with Fake Reviews

When reading product reviews from other customers, nine out of 10 shoppers in the UK indicate that they’re concerned with fake content. Notably, Gen Z shoppers are more likely to be concerned with fake reviews than older shoppers – but it’s still relatively consistent across the board. 

Fake Reviews are a Concern Among Shoppers of All Ages
When reading product reviews from customers, are you concerned about fake reviews?
Overall
90%
Gen Z
95%
Millennials
89%
Gen X
90%
Boomers
91%

But just how concerned are shoppers by fake reviews?

When asked to rank their concern on a scale of one to five (with one being least concerned and five being the most), the average response was 3.22. In fact, many consumers are quite concerned with fake reviews, with 89% ranking their concern as three or higher.

Many Consumers Assign a High Rank to Their Concern with Fake Reviews
Rank your level of concern about the presence of fake reviews on a scale of one to five
1 (least concerned)
2%
2
9%
3
40%
4
27%
5 (most concerned)
22%

UK Consumers are Particularly Concerned with Fake Reviews on Amazon

When shopping online, consumers in the UK have a wide array of options. But are there certain sites for which consumers are particularly leery of fake reviews?

As it turns out, yes. 

Amazon wins by a long shot. The largest portion of consumers – 83% – are concerned about fake reviews when shopping on Amazon.co.uk. Argos.co.uk is a distant second, with just over a quarter (26%) of UK shoppers feeling concerned about fake reviews there. Fake reviews are still a concern – but much less so – for other top online stores in the UK. 

The Websites UK Concerns are Most Concerned About Fake Reviews
Which of the following online shopping websites are you concerned about having fake reviews?
Amazon.co.uk
83%
Argos.co.uk
26%
Currys.com.uk
19%
Tesco.com
12%
Asda.com
12%
JohnLewis.com
10%
Sainsburys.co.uk
9%
Morrisons.com
9%
MarksandSpencer.com
8%
Ocado.com
7%
Chapter 4

The Prevalence of Fake Reviews – and How Consumers Spot Them

The vast majority of consumers in the UK are concerned with fake reviews. But how prevalent is this content? And how do consumers spot it?

Most Consumers in the UK Have Spotted a Fake Review in the Wild

As it turns out, consumers are very familiar with fake reviews. Nearly nine in ten (87%) of consumers believe they’ve read a fake review in the past. 

Interestingly, younger consumers are more likely to think they’ve read a fake review than older ones. Perhaps this is because younger shoppers are more adept at spotting the signs of a fake (more on that later) – or maybe they’re simply more cynical. 

Most Consumers Suspect They’ve Read Fake Reviews
Do you think that you’ve ever read a fake review?
Overall
87%
Gen Z
95%
Millennials
88%
Gen X
85%
Boomers
80%

The likelihood of having read a fake review is also correlated with income. The higher the income, the more likely shoppers are to suspect they’ve read fake reviews. 

But why? Most likely, because higher income consumers spend more online. Therefore, they read more reviews – and are more likely to encounter fakes.

Higher Income Consumers are More Likely to Have Come Across Fake Reviews
Do you think that you’ve ever read a fake review?
£0-£25,000
84%
£26,000-£50,000
86%
£51,000-£75,000
89%
£76,000-£100,000
95%
£100,001+
93%
Prefer not to say
85%

How Shoppers Identify Fake Reviews

It seems fake reviews are quite prevalent, with most consumers in the UK suspecting they’ve run into them at least a time or two. But what is it that makest a shopper suspect a review is a fake?

The top red flag is the wording of the review. In other words, how it’s written. However, there are several other features that make shoppers think a review may be fake, including extremity and a lack of specific detail. 

Red Flags for Fake Reviews, According to UK Consumers
Which of the following features in a review makes you concerned it may be fake?
Wording of reviews and/or how it’s written
60%
Too extreme (whether positive or negative)
55%
Lack of specific detail
53%
Poor grammar or doesn’t make sense
52%
The name/profile of the reviewer
33%
Chapter 5

The Negative Impact of Fake Reviews

Consumers keep an eye out for fake reviews. And if they find one that looks fishy, they’re less likely to make a purchase. 

Fake Reviews Deter Many Shoppers

Nearly seven in ten (67%) of shoppers say that if they found what they thought was a fake review, they wouldn’t buy the product in question. 

Interestingly, Boomers are the generation most likely to pass up a product if they find a potentially fake review. 

Consumers Steer Clear of Products with Fake Reviews
If you read what you thought was a fake review for a product that you were interested in, would you still buy it?
Overall
67%
Gen Z
70%
Millennials
68%
Gen X
67%
Boomers
71%
Chapter 6

The Importance of Preserving Review Authenticity

Consumers consider many factors when reading reviews. One factor that rises to the top is review authenticity. Nearly three-quarters (71%) say that when reading reviews, they consider how authentic this content is.

And, as we’ve discussed earlier in this report, the presence of a review thought to be fake can send a shopper running in the other direction.

Clearly, brands and retailers must work to preserve the authenticity of reviews to preserve shoppers’ trust.

Transparency is Key

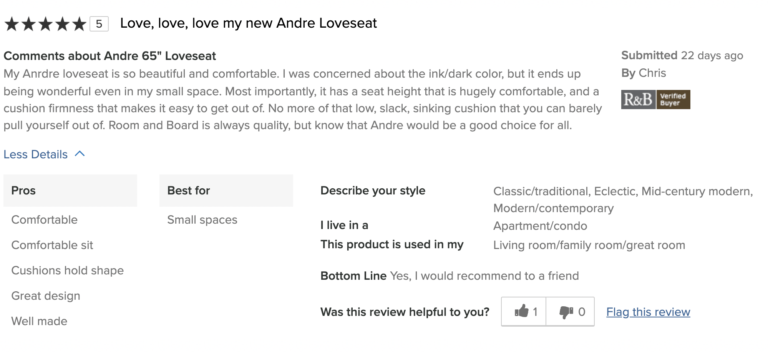
Reviews can originate from a number of sources. For example, a shopper might submit a review as the result of a post purchase email from the brand or retailer. In that case, the business knows the consumer is a verified buyer. Or, another shopper might have received a free sample of a product in exchange for a review.

One key way to boost shoppers’ trust in reviews is to disclose who wrote each one. The majority of shoppers – 82% – say they regard reviews tagged with information about the source as more authentic and real. Notably, such tags boost the confidence of younger shoppers slightly more than their older counterparts.
Disclosing the Source of a Review Boosts Consumer Trust
Do you regard reviews tagged with information about how the review was sourced (e.g. “Verified Reviewer”, “Verified Purchaser”, “Review submitted as part of sampling campaign”) as more authentic and real?
Overall
82%
Gen Z
84%
Millennials
82%
Gen X
82%
Boomers
75%

“Verified buyer” is the tag that has the biggest impact on shoppers’ perception of a given review. This makes sense, as readers can clearly see that the reviewer actually purchased the product in question. 

Verified Buyer and Verified Reviewer Badges are Especially Impactful
Which of the following tags, if any, on review content positively impact how you perceive that review content?
Verified buyer
66%
Verified reviewer
57%
Review submitted as part of sampling campaign
47%
Review submitted as part of sweepstakes campaign
12%
Staff reviewer
12%

Perfect Ratings Don’t Seem Real to Consumers

If there are only glowing reviews for a product, it can raise suspicions among shoppers. As we highlighted earlier in this report, a review being too extreme – whether positive or negative – raises suspicions among 55% of shoppers. What’s more, previous research found that 46% of shoppers are suspicious of products with a perfect average star rating of five out of five.  

Our most recent research found that a mere 6% of consumers feel that 5.0 is the ideal average star rating for a product they’re considering. On the other hand, the largest portion of consumers – 45% – believe the ideal average star rating falls between 4.0 and 4.49.

While negative reviews aren’t something to aim for, the occasional negative review isn’t the end of the world. Negative reviews help shoppers determine the worst case scenario for a given product. Then, they can make the call if it’s something they can live with. What’s more, by displaying negative content, you’re letting shoppers know you have nothing to hide – and that you’re a business they can trust.

Perfect Isn’t Ideal
What is the ideal average star rating (out of five) for a product in your opinion when considering purchasing a product?
Overall
Under 3.5 stars
1%
3.51-3.99 stars
7%
4.0-4.49 stars
45%
4.5-4.99 stars
41%
5.0 stars
6%
Gen Z
Under 3.5 stars
0%
3.51-3.99 stars
10%
4.0-4.49 stars
43%
4.5-4.99 stars
42%
5.0 stars
5%
Millennials
Under 3.5 stars
2%
3.51-3.99 stars
8%
4.0-4.49 stars
45%
4.5-4.99 stars
41%
5.0 stars
4%
Gen X
Under 3.5 stars
1%
3.51-3.99 stars
6%
4.0-4.49 stars
45%
4.5-4.99 stars
41%
5.0 stars
7%
Boomers
Under 3.5 stars
0%
3.51-3.99 stars
6%
4.0-4.49 stars
41%
4.5-4.99 stars
43%
5.0 stars
10%
Chapter 7

6 Key Takeaways for All Brands and Retailers

Reviews have become a key part of the purchase journey. Preserving the authenticity of this content must be a top priority for any business. Here are our five key takeaways from our latest survey.

One
Consumers Value Reviews – But They’re Wary of Fake Ones

We know from previous research that nearly all consumers read reviews when shopping online and over half (57%) do so when shopping in a brick-and-mortar shop. The presence of this content is proven to positively impact conversion.

However, fraudulent content is top of mind for shoppers, with 90% indicating they’re concerned about fake reviews. The shopping site they’re most concerned with fake reviews is Amazon.

Two
Consumers Have a Keen Eye for Fake Reviews

The majority of shoppers (87%) believe they’ve read a fake review in the past. There are certain things that make them suspicious of a specific review, including wording, extremity, and lack of detail. 

Your ratings and reviews provider should have a strong moderation process in place to identify potentially fraudulent reviews with these key red flags (among others). Be sure to ask. 

Three
Fake Reviews Tarnish Trust and Diminish Sales

The presence of even a single fake review can cause a shopper to rethink a purchase. Our research found that 67% of shoppers that found what they thought was a fake review wouldn’t purchase the product in question. 

Once trust has been lost, it’s difficult (if not impossible) to restore. Brands and retailers must ensure fake reviews never make their way onto product pages. 

Be sure your ratings and reviews provider – as well as your retail and marketplace partners – have strong measures in place to ensure fake reviews are identified – and never see the light of day.

Four
Transparency About the Source of Reviews Bolsters Shoppers’ Confidence

Consumers value reviews because they are authentic. One key way to preserve that authenticity is to let shoppers know the source of reviews. 82% say that reviews tagged with information about who wrote it are more authentic and real.

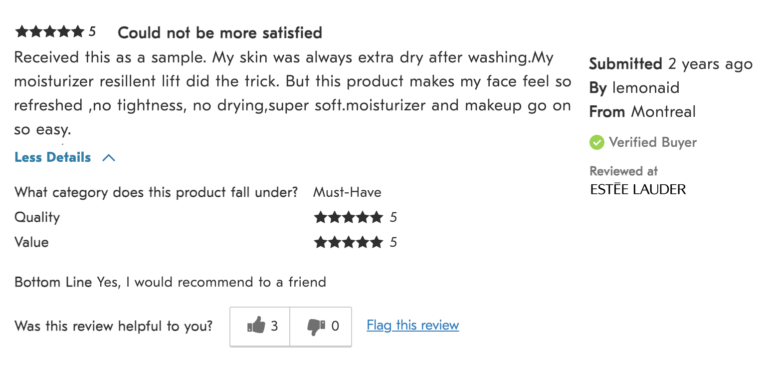
Be sure to appropriately badge all reviews. For example, if a review was written by a verified buyer, indicate it in the review. And if a shopper received a free sample, disclose it. Providing information about the source of reviews will bolster shoppers’ trust – and help them make more informed purchase decisions.
Five
Perfect Reviews Raise Red Flags

Over half of shoppers (55%) are suspicious when a given review is too positive or too negative. And only 6% of shoppers feel that the ideal star rating for a product is 5.0.

If a product only has glowing reviews, it can raise suspicions that the brand or retailer is suppressing negative content. So while it’s important to moderate content for fraud and appropriateness, never suppress a review simply because it’s negative. 

Consumers actively seek out negative reviews, and by displaying them, you’re empowering your shoppers to make more informed purchase decisions – while showing them you’re an honest company with nothing to hide.
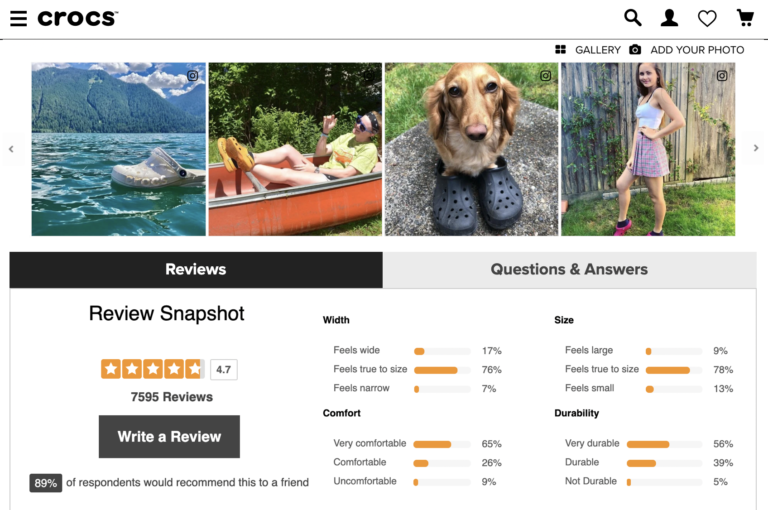
Crocs product pages feature interactive image galleries and searchable reviews, along with specific ratings related to key words
Six
Implement a Robust Review Verification Process

While there are a lot of things you can do to promote authentic review content, fraudsters tend to be a determined bunch. If you struggle to identify fake reviews at the scale you need to, you might need to call in the experts. PowerReviews has robust fraud detection processes that combine human involvement with the best technology to power the most authentic review programs in the world.
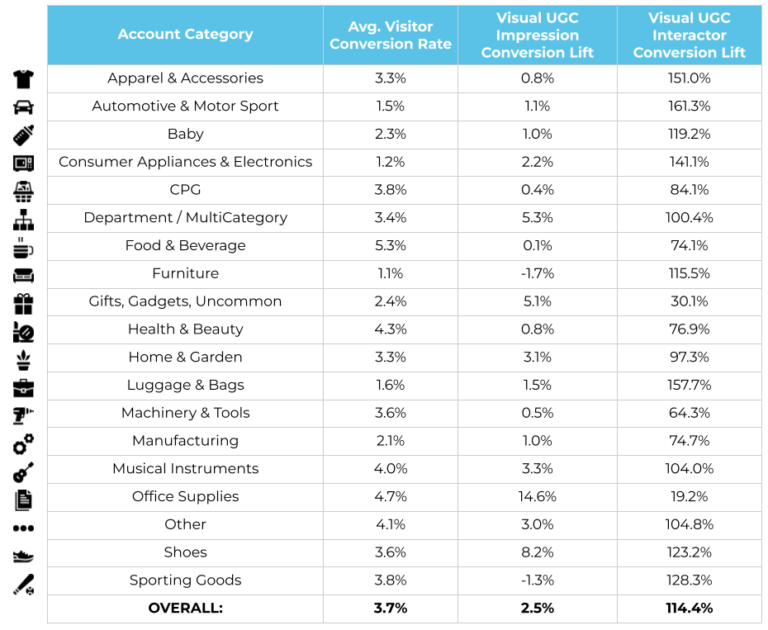
Modest conversion lift for Visual UGC impressions; but Visual UGC Interactions more than double conversion

Key Findings:

  • When site visitors interact with visual UGC (user-generated images and videos), the product experiences a 114.4% conversion lift, on average.

  • Product verticals with the highest conversion lift when visitors interact with visual UGC are Automotive & Motor Sport (161.3%); Luggage & Bags (157.7%); and Apparel & Accessories (151%).

  • Even a Visual UGC impression has a mildly positive impact on conversion, lifting it by 2.5%.

  • The verticals with the highest Visual UGC impression conversion lift were Office Supplies; Shoes; and Department/Multi-Category Retail. 

Methodology: Analysis of consumer UGC interaction across 25.4MM+ online product pages on 3,600+ brand and retailer sites in the previous 12 month period prior to June 28, 2022. Conversion data based on visits (i.e. subsequent conversion action took place 24 hours after the interaction or impression was recorded).

Pictures (and videos) paint a thousand words

Reviews can paint a picture, but there’s a reason they say an image is worth a thousand words. Visual UGC brings your product to life. It allows customers to see how your product looks, how it can be used, and who is using it — all of which makes them feel more confident about their purchase. 

That confidence is key and it is a huge factor in why consumers overwhelmingly prefer photos from other customers over photos provided by the brand. Pictures taken by real people, in real settings, feel more trustworthy. Today, a majority (80%) of consumers find photos from other customers more valuable than photos from brands or retailers, a number that has nearly doubled in the past five years (this same number was 44% in 2016).

At the same time, visual media is simply another input for customers. So – while for some it will be a positive – for others, it will give them the information they need to move onto another product. This explains why the impression uplifts are relatively modest while the interaction (which implies a deeper interest in the product) uplifts are significant.

What We Measured

In our analysis, we looked at both the conversion lift by visitor (those who merely saw visual UGC on the product page they visited) and by interactor (those who interacted with visual UGC on the product page they visited). We’ve also shared the average conversion rate for each vertical as a baseline.

Modest Visual UGC Impression Uplift

The mere presence of visual UGC had a slight, but positive, impact on conversion, at an average conversion lift of 2.5% across verticals. However, some categories benefited much more from the presence of visual UGC on their product pages. These included Office Supplies (+14.6%), Shoes (+8.2%), and Department/Multi-Category Retail (+5.3%).

Significant Visual UGC Interaction Uplift

When site visitors actually interact with visual UGC – e.g. clicking on an image, browsing a gallery, or watching a video – the conversion lift is much, much higher. Across verticals, interacting with visual UGC resulted in an average conversion lift of 114.4%. Even the vertical with the lowest media interactor conversion lift – Office Supplies – experienced a significant lift of 30.1%, showing just how powerful visual UGC can be when it comes to converting customers. The verticals that enjoyed the highest media interactor conversion lift included Automotive & Motor Sport (+161.3%), Luggage & Bags (+157.7%), and Apparel & Accessories (151.0%).

Five Snackable Data-Backed Visual UGC Tips

  1. Enable easy media collection through your review form. 85% of shoppers indicate they’re more likely to buy a product that has reviews that feature photos and videos in addition to written text. Make sure you have plenty of media on-hand by asking for it in your review form.

  2. Collect more content from social media. A third of Gen Zers and nearly a quarter of Millennials simply won’t purchase a product if there are no photos or videos from others who have purchased it. If you need to beef up your visual UGC, use your customers’ social media posts as an additional resource. 

  3. Display customer media in a visual content gallery. Our research found there’s a 110.7% conversion lift among shoppers who click on any image within such a gallery. 

  4. The more, the merrier: Create an extensive gallery. People like being able to easily browse through a gallery of customer-generated photos and videos. And, the ones who do are around twice more likely to convert.

  5. Make reviews containing images easily findable. Consumers that seek out this additional context about a product have a demonstrably bigger intent to buy. In fact, our research shows that shoppers who sort for reviews containing images have a 89.3% conversion lift.

More Benchmarks

Sorry, we couldn't find any posts. Please try a different search.

Power Points

  • Consumers value visual UGC across product categories, from food and beverage to health and beauty.

  • One of the easiest ways for brands to generate visual UGC quickly and consistently is with social curation.

  • Social curation – or the process of sourcing real-life imagery and videos of your products from social channels like Instagram – can help brands establish trust, lift conversions, and stimulate product discovery.

From window displays to television commercials, shoppers have always placed a high value on visual content. That’s not anything new. We’re visual creatures, after all.

What is new is the type of visual content shoppers value. User-generated visual content has become increasingly important to consumers. 94% of shoppers seek out visual UGC at least sometimes. One in four shoppers always seek it out. 

“But aren’t our photos enough?” you may ask. No, they’re not. Today, 80% of consumers say photos from other customers are more valuable than those provided by brands or retailers. That’s a big increase from five years ago, when only 44% felt this way.

What’s more, 54% of consumers say company-generated product photos are “unhelpful” and actually dissuade them from buying.

Fashion brands have embraced the power of UGC for years, mining their social media channels for customer images to share on their own websites and marketing materials.

We have a newsflash for you: this process, which is known as social curation, is no longer just for fashion brands. Increasingly, consumers expect to see visual UGC content across product verticals. Nearly 40% of online grocery shoppers, for example, seek out customer-submitted imagery and videos. From CPG to health and beauty, consumers want to see more imagery from other customers. 

Read on as we explore the power of social UGC for non-fashion brands, complete with real-world examples.

What is social curation?

Social curation is the process of sourcing product images posted by your customers on Instagram, and then displaying it through your own website to provide social proof and lift conversions. Here’s how it works.

88% of consumers specifically look for visuals (such as photos or videos) submitted by other consumers prior to making a purchase.

Step 1: Choose your collection criteria

The first step is choosing how you’ll collect the images from social media. With PowerReviews, you can designate certain @mentions, @tags, and #hashtags to source content from, such as mentions of your brand name or a campaign-specific hashtag.

It can be helpful to be specific with this (e.g. #BrandNameLove vs. #OOTD), as that ensures you generate more relevant content that actually features your products. For example, Duraflame uses the hashtag #BetterByTheFire:
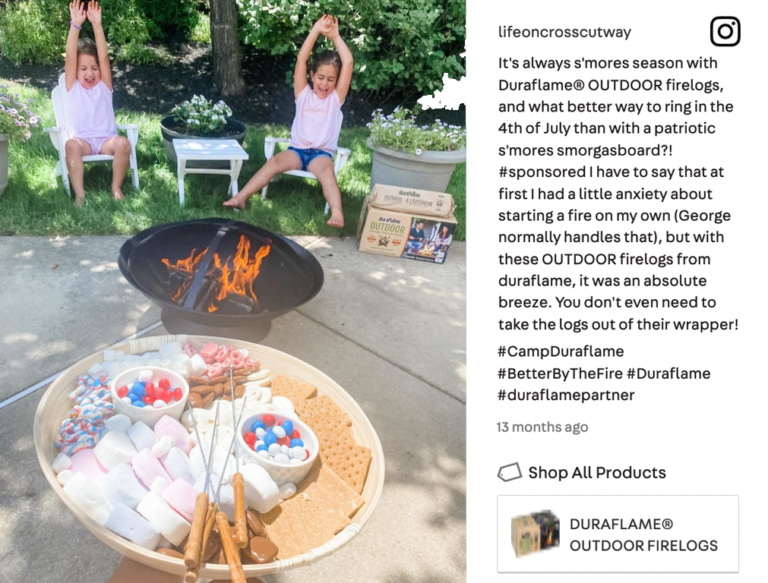
Step 2: Get permission

You’ll need to get permission from consumers before using their photos or videos across your website or in other marketing materials. Work with your legal team to establish a Terms and Conditions page, and link to this page whenever you ask for permission. 

Always be sure to attribute your customers’ content to them, such as linking to their Instagram page or including a caption like “Photo courtesy of [insert Instagram handle]. Here’s an example from Janie and Jack:

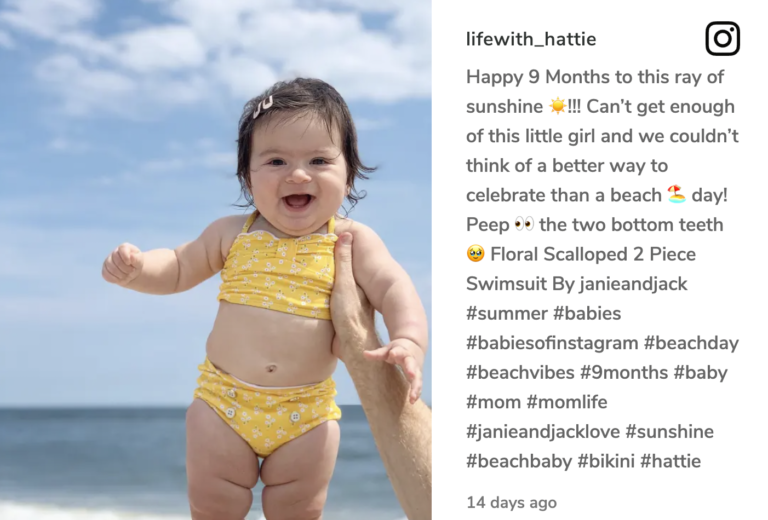
Step 3: Encourage customers to post

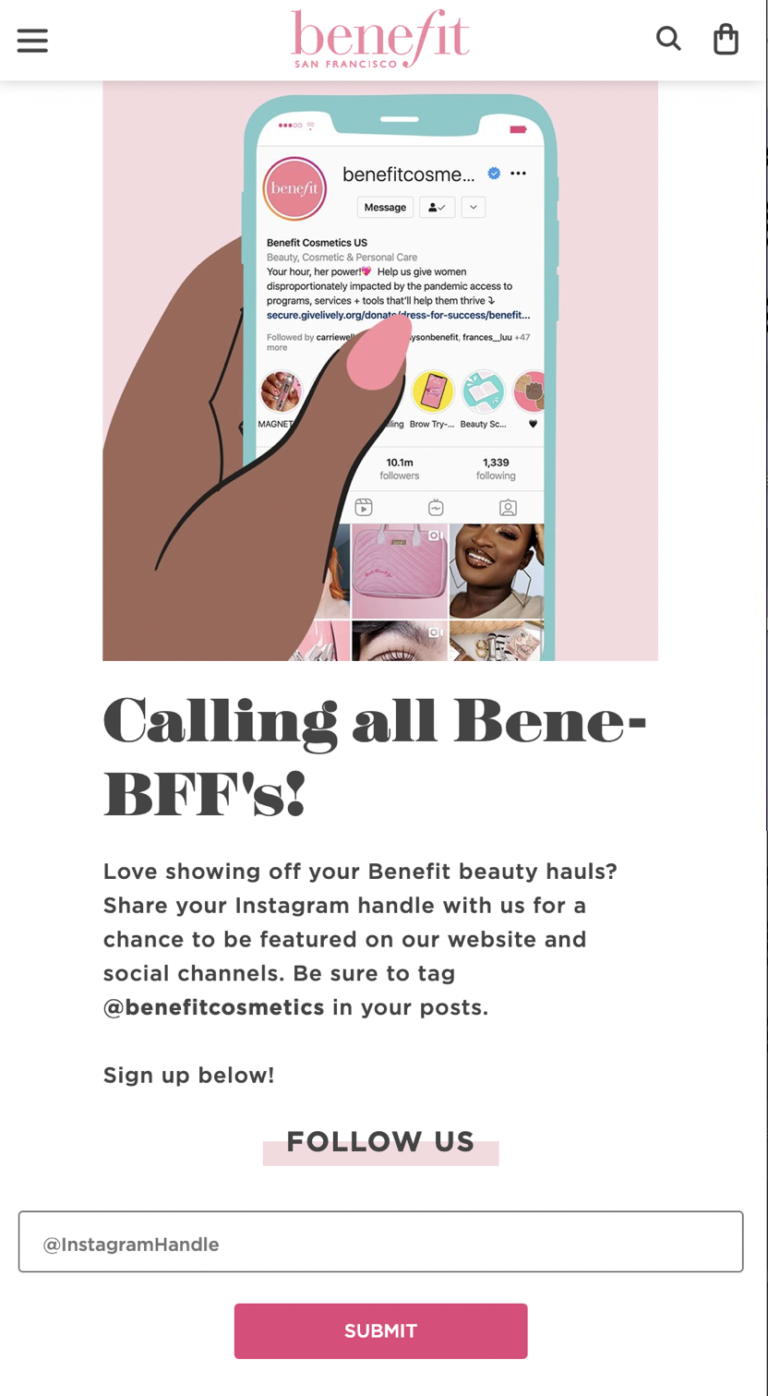
Once you’ve taken care of the legal p’s and q’s, it’s time to promote your campaign. Encourage customers to post photos with your products via email campaigns, social media posts, product packaging, billboards, and anywhere else you communicate with your customers. Give them some tips for how you want them to post, such as the hashtag they should use, and to be sure they’re actually featuring your products in their post. Here’s an example from Benefit Cosmetics:
Step 4: Reshare the images on your channels

Next, it’s time to put that social content to work! Once you have your customers’ permission, you can reshare their images on your:

  • Product pages
  • Home page
  • Category pages
  • In-store displays
  • Marketing emails
  • Advertisements
  • Social media channels

Step 5: Analyze your performance

Want extra credit? Monitor the performance of your social content. Who are your top creator contributors? What products are featured more, or less, often? How is the photo quality? Knowing the answers to these questions can help you find ways to improve your campaigns and collect more effective social imagery.

5 powerful benefits and use cases of social UGC

How important is social imagery, really? Visual media is so important to consumers that they overwhelmingly rate images as the most valuable part of any individual review, even above the review length, title, and aggregated pros and cons lists.  

Consumers Value Many Aspects of Individual Reviews
Which of the following types of detail included within individual reviews do you find useful or would find useful when reading them?
A picture/image of the product from someone who has used it
65%
Longer, more descriptive reviews
59%
Stories and accounts that relate to and are consistent with how you intend to use the product
57%
Aggregated pros and cons pulled from all the reviews submitted
54%
“Most positive review” vs “most negative review” pulled from all reviews submitted
45%
The tag/badge signifying how the reviewer obtained the product
42%
A video of the product from someone who has used it
36%
Demographic profile information
19%
Longer, more descriptive title
17%

Let’s take a look at some of the value brands and retailers can derive from curating and sharing social UGC.

1. Generate more conversions and sales.

More than half of consumers say imagery provided by previous purchasers is a top factor influencing their purchase decision. When people interact with visual UGC, their conversion rate doubles. Our latest data shows a 106.3% lift in conversion among visitors who interact with user-generated imagery on a product page. That’s a significant increase from the conversion lift of 91.4% found the year prior, indicating the increasing impact of user-generated imagery on purchase behavior. 

Imagery interactions that are particularly impactful on conversion include:

  • Clicking on the image gallery (110.7%)
  • Clicking to view the next image/video (103.6%)
  • Clicking to see the previous image/video (96.4%)

Further, our research shows that consumers who spend more online are more likely to “always” seek out visual content within reviews. 35% of consumers who spend $2,000+ online each month always seek out visual content within reviews, compared to 20% of those who spend $250 or less monthly.

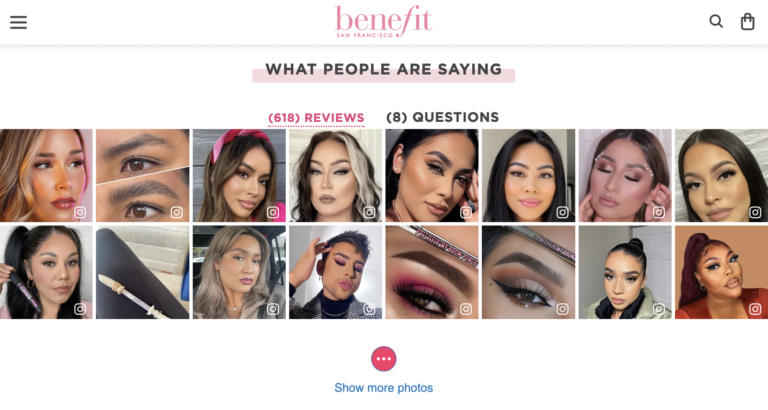
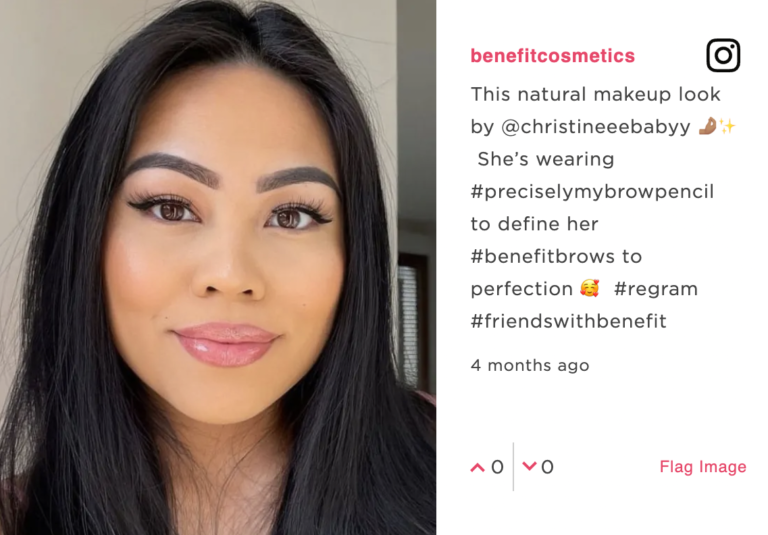
Benefit Cosmetics curates photos from their own social feed featuring real customers. They include the precise shade and product used in each image, enabling shoppers to see how the different shades look on different people.
2. Provide the authentic content consumers crave.

57% of shoppers read reviews to find imagery or photos of the product from a real-life shopper. Several of the top reasons consumers value visual UGC speak to authenticity

Top Reasons Consumers Value User-Submitted Photos and Videos
To see what the product looks like in real life
86%
To get a better sense of the size or sizing of the product
75%
It’s more authentic and “real” than standard brand-created imagery
65%
To understand how the product performs
58%
To see if the product fits your own personal need
56%
It creates trust in the product and/or brand
42%

Visual UGC that is collected from social media authenticates your marketing claims and provides powerful social proof. Not only are your customers willing to write a rave review, they’re so passionate that they’re happy to promote your brand on their social media pages. 

There’s another added benefit to social image curation. Almost everyone, whether or not they’re an influencer, treats their social media like they are an influencer. That means you get to collect influencer quality content without the pricey cost of maintaining an influencer relationship.

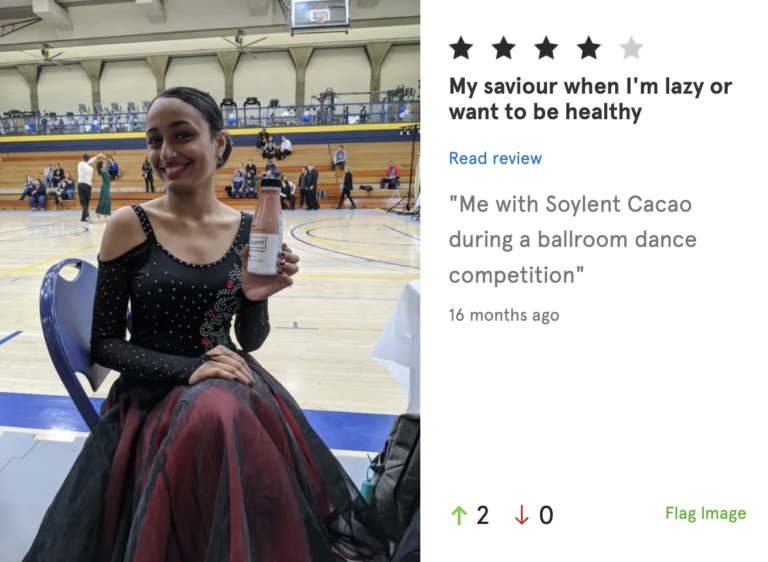
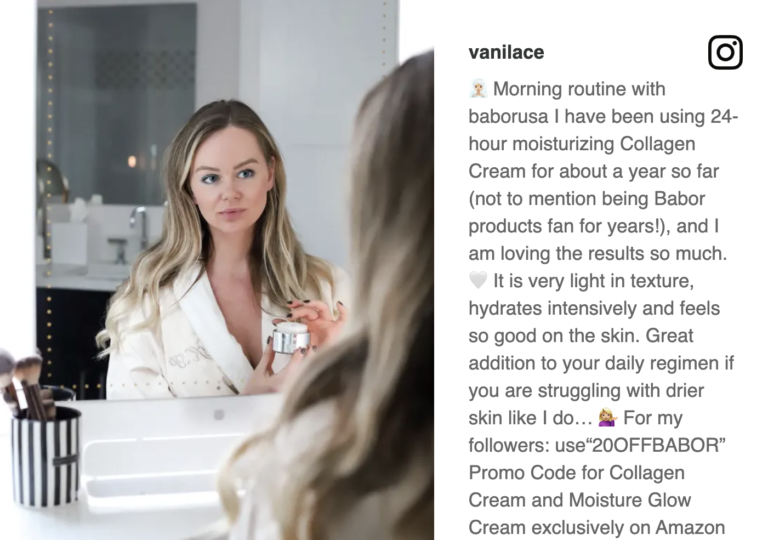
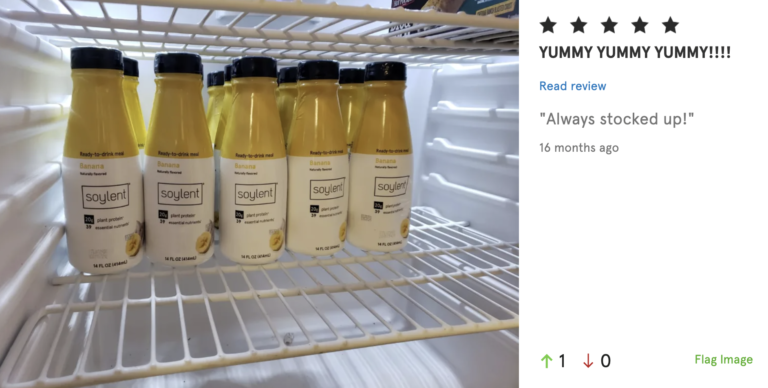
Here are two examples of social UGC, one from a beauty influencer for Babor and another from an everyday customer of Soylent. Both are persuasive and feature the product in an authentic light. 
3. Make inroads with younger demographics.

Visual UGC is especially important to younger consumers, with 91% of Gen Z’ers and 84% of Millennials always or regularly seeking it out. In fact, a third of Gen Z shoppers and nearly a quarter (21%) of Millennials won’t purchase a product if there is no visual content from people who previously bought it. 

Soylent recognized that social media is the essential medium for targeting a younger audience. The brand found that 100% of customers who go to their site look at their image gallery. This knowledge has helped them grow their business, launch new flavors, and expand to new retailers.
4. Share recipes and inspiration.

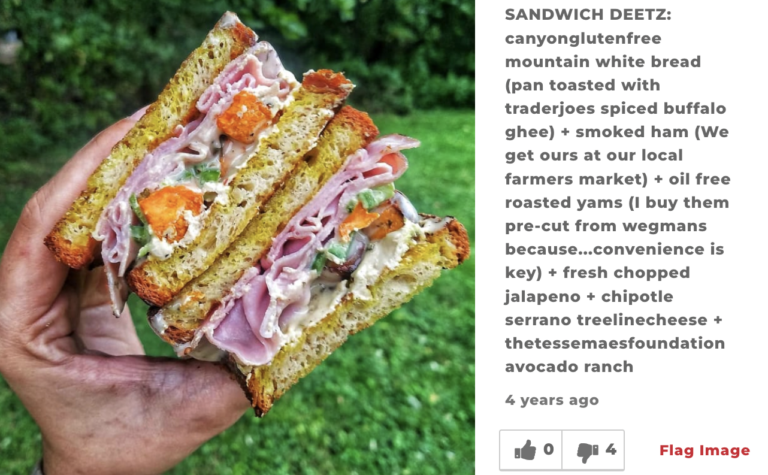
With all of the food influencers out there, there is a huge opportunity for CPG and grocery brands to pull in their content to their product pages. These creators dream up yummy recipes and show off the results on social media. By curating images like these from social media, your brand can inspire other shoppers.

Canyon Bakehouse’s product pages are filled with the types of images we’re talking about. They feature their customer’s delicious creations on the product pages, offering different ideas for how shoppers can use their gluten-free bread. “Social curation has allowed us to add a lot of color and credibility to the product display pages on our site,” shared Katie Pusateri, Marketing for Canyon Bakehouse.
5. Stimulate product discovery and inspire purchases.

With social curation, you can display shoppable customer image galleries on your site wherever you need to provide social proof, enable product discovery, and inspire sales. 

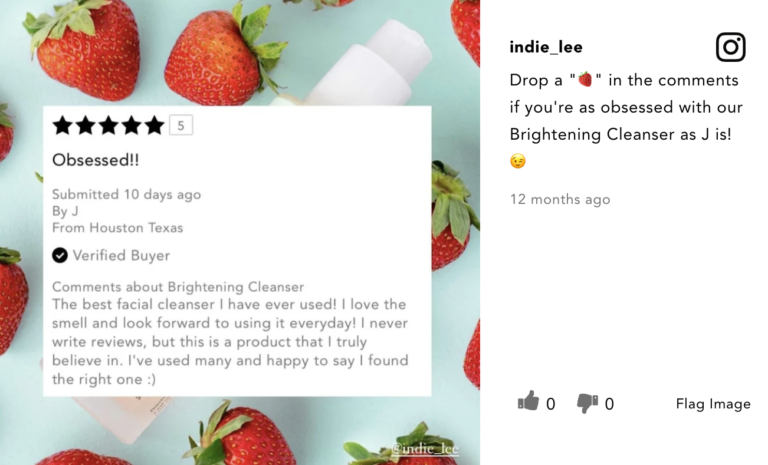
You can reuse these images in marketing materials across your website and email. You can even get really meta and showcase reviews in your social media, only to curate those same images right back on your product page, like Indie Lee does. It’s like the movie Inception for UGC!
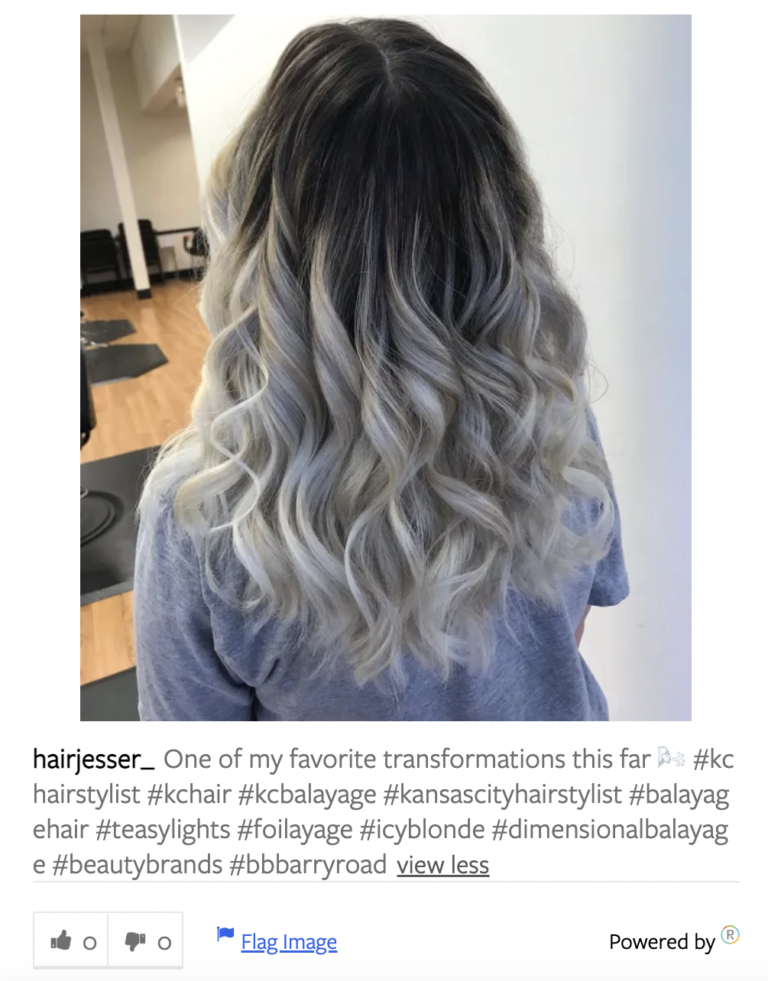
The #1 reason shoppers value visual UGC is to see what the product looks like in real life. Another popular reason is to understand how the product performs. By curating images from social media that include their branded hashtag, Beauty Brands enables shoppers to easily see how their product works for a wide range of hair colors, styles, and lengths. This helps build trust and inspire purchases for a wider range of shoppers than a simple product photo gallery could ever provide.
How to gather more social UGC

How many images is enough? You can never have too many images. Fortunately, when you’re collecting images from social media, you tap into an endless supply of creative and beautiful imagery created by real customers. 

If you’re looking for hard numbers, though, check out our latest benchmark study on visual UGC. Independent of vertical, the average product has 12.8 images or videos. However, what’s typical can vary by vertical. The typical food and beverage product has 14 images or videos, on average, while CPG products have 20 images or videos, and health & beauty products have 23 images or videos. 

The key, of course, is to have strong visual UGC coverage across all your products. Get started with these four tips for getting the most out of your visual UGC.

Reward reviewers for adding a photo or video.

From free samples to free discounts, up to 86% of customers need an incentive to leave a review.
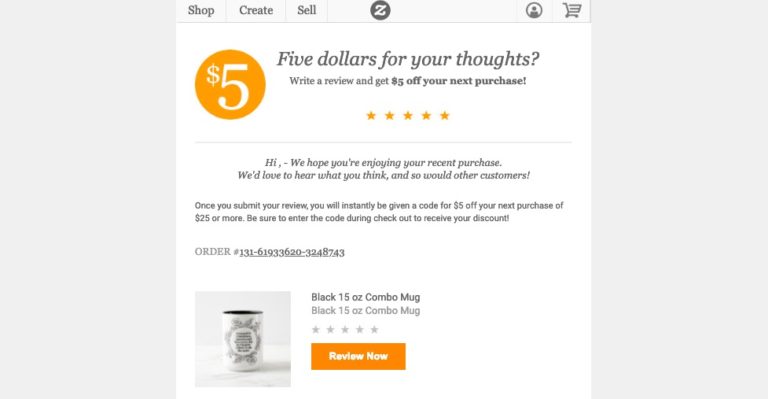
zazzle incentive for customer feedback

Make your galleries easily searchable.

Over three-quarters (77%) of shoppers find filtering options useful when browsing review content. Include a filter for reviews that feature visual UGC. 
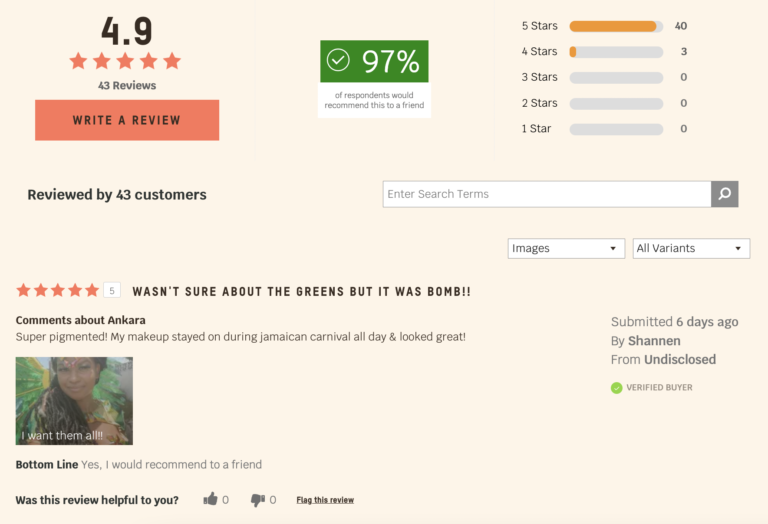
Include social links in your review form.

Make it easy for reviewers to add social UGC, by letting them upload photos from their Facebook or Instagram page.
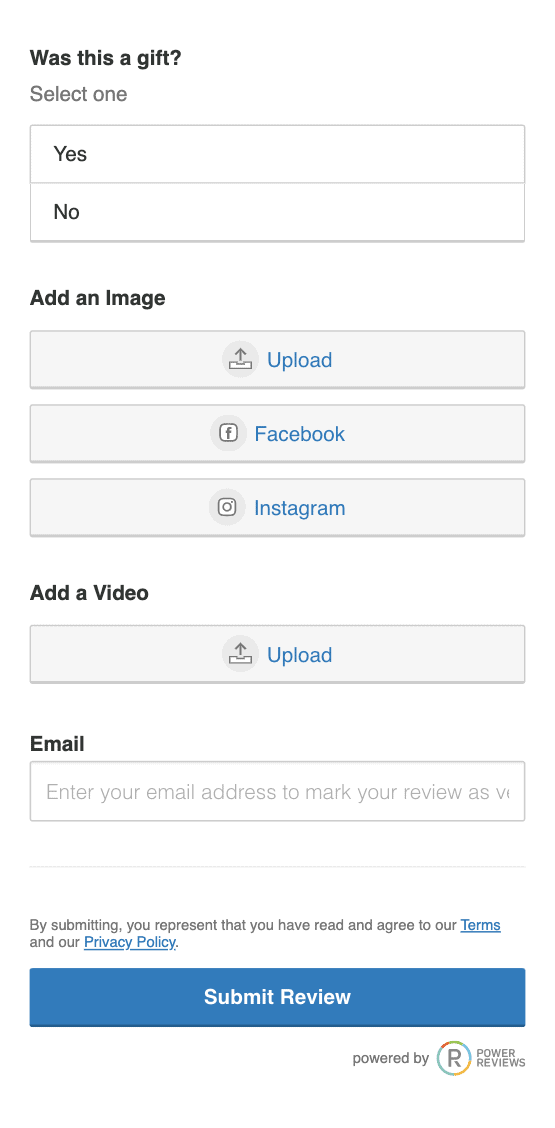
Use social curation.

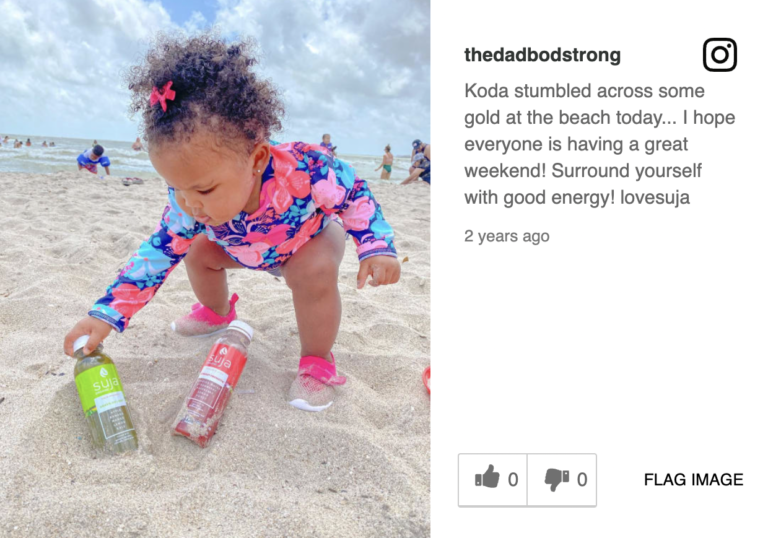
With PowerReviews Social Curation, brands and retailers capture 221% more images and videos. You can collect images posted with specific hashtags, from both your brand and customers. Suja Juice includes images from their brand account as well as fans in their review snapshot.
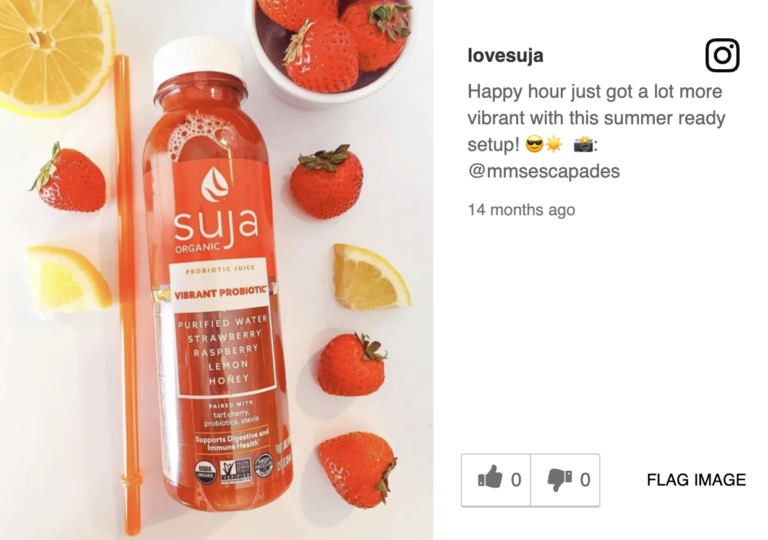
Unlock the power of social UGC

Social media is not just for sharing; it’s for selling. The brands who recognize this have a clear competitive advantage. They’re the ones who are collecting native content from their customers, showcasing it on their site, and leveraging it to boost sales and engagement. Adopt an image-first mindset today, and watch as your brand connects with – and sells to – customers better than before.


Kylie Sheehan

Kylie Sheehan is an Enterprise Customer Success Manager at PowerReviews. When she's not helping her clients optimize their Ratings and Reviews strategy to help them grow their sales, you can find her doing home renovation projects (and spending the majority of her time at Target and Home Depot)!

Your Guide to a 5-Star Summer

No summer bummers here! We’re back with a hot list of the top-rated products and must have’s to make sure your summer is 5 stars, no matter your agenda.

Contents

Backyard BBQ

Cherry Point Gray 4 Piece Sectional

$1,098

4.6
Rated 4.6 out of 5
Beautiful
@Beth
We love our outdoor sectional! Stylish, comfortable, and great quality.

Slatted Wood Adirondack Chair

$119.99

4.6
Rated 4.6 out of 5
Pretty and comfortable
@A
Great quality for the price. Great choice for outdoor fire pit. Oh and most importantly, they're comfortable! I haven't even added pillows yet.

Ruby Red Vodka

$8.99+

5
Rated 5 out of 5
Sharing Is Caring
@Ginny
I've had a lot of company lately. Everyone wants wine. I don't. I serve them their choice but I make myself a Deep Eddys Ruby Red and diet tonic and suggest they take a sip. Now they are all drinking Deep Eddy Ruby Red.

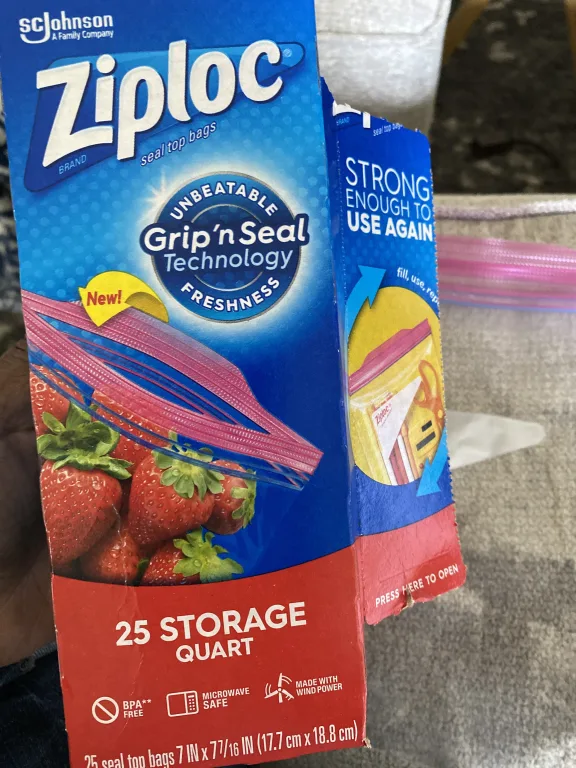
Large Slider Storage Bags

$5.79+

3.9
Rated 3.9 out of 5
What a great product
@Casey
They are easy to open and close well enough that you can put many products in them without them opening and leaking out. They are also big enough to carry sandwiches or basically any snack that you need to bring with.

Red, White, and Blue Kringle

$25.99

4.8
Rated 4.8 out of 5
Party Favorite
@EmmJayKay
My husband and I brought this to a party with our friends, and our friends could not stop raving about this!! Highly recommend!!

Orchard Fresh Peaches

$39.99+

4.6
Rated 4.6 out of 5
Delicious!
@Tracey
Each one arrived in perfect condition and blemish-free, super well-packed. So good I have ordered another 2 boxes and cannot wait til they get here!

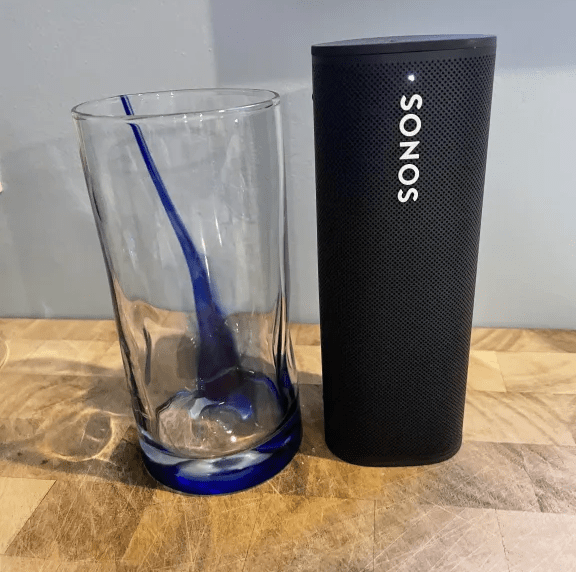
Roam Smart Speaker

$179

3.8
Rated 3.8 out of 5
Great sound in a small speaker
@Rebecca
I wanted something small and portable so we could have a speaker at the dinner table and the Sonos Roam is perfect! It's about the same size as a 10 oz. glass but has big sound.

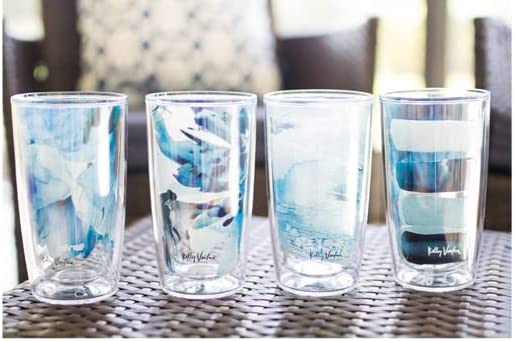
Kelly Ventura - Blue Collection

$49.99

5
Rated 5 out of 5
I would definitely buy this product again
@Karen
I love Tervis products because they don't sweat and leave rings on my furniture. I also love the different designs because then people can keep track of their glasses.

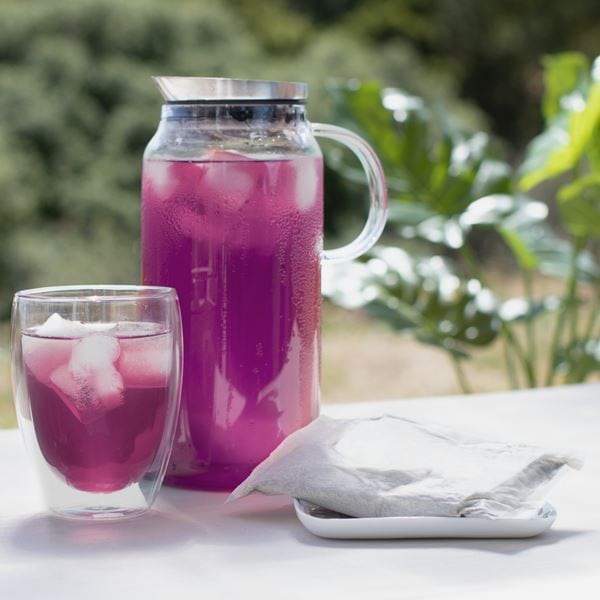
Hibiscus Sangria Large Iced Tea Pouches

$8

4.7
Rated 4.7 out of 5
Refreshing
@KM
This is now my go to for iced tea on really hot days. It keeps me hydrated and tastes great. It is not unusual for me to completely an entire pitcher in one day.

Glass Iced Tea Pitcher

$27.25

5
Rated 5 out of 5
Stylish and useful
@Mary Kay
I've had this pitcher in my refrigerator throughout the summer and into the fall. It has a small footprint, is easy to pour from, is well made, and looks beautiful.

Camp

Red, White & Blue Milk Chocolate Candy

$3.79+

4.6
Rated 4.6 out of 5
These were perfect
@Chataway
I purchased the red, white, and blue M&Ms for my daughter's Eagle Court of Honor. They were a perfect touch for each of the tables. I would definitely purchase M&Ms again for my next occasion.

Borealis Backpack

$99

4.7
Rated 4.7 out of 5
I would definitely buy this bag again.
@John
It has features galore. My favorites being the soft goggle pouch, high quality smooth zippers, vertically adjustable torso straps, and pack compressions straps to shrink the overall size of the bag when not full. Very impressed with this bag.

Outdoor Firelogs

$15.99+

4.9
Rated 4.9 out of 5
A MUST for camping
@Jaime
It's not really camping without these logs. They get the fire going quickly so you can focus on having fun. They burn for hours too. I buy the value packs, they are a great value!

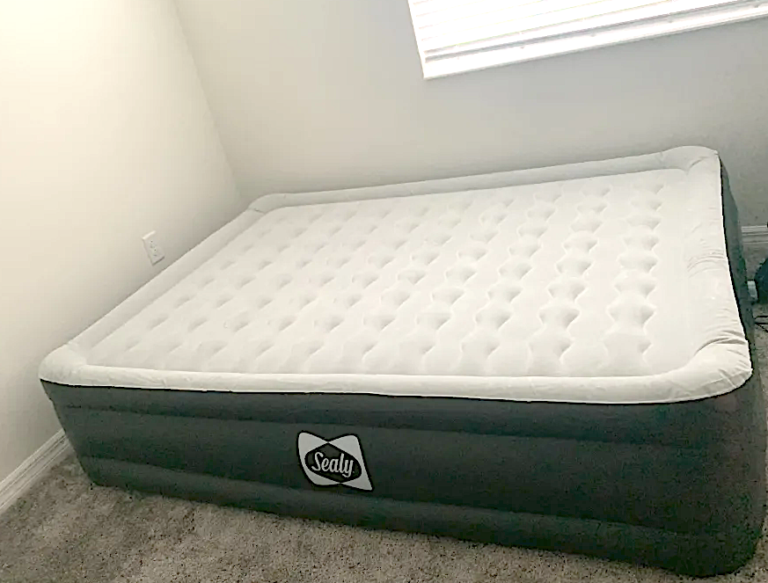
18" Tritech Queen Inflatable Air Mattress

$65

4.7
Rated 4.7 out of 5
Buy it! It's incredible and comfortable
@A
This is the best air mattress I've ever slept on. Very firm and sturdy but not too firm. I honestly love it. It just takes a few minutes to inflate and deflate and folds up neatly. Buy it!

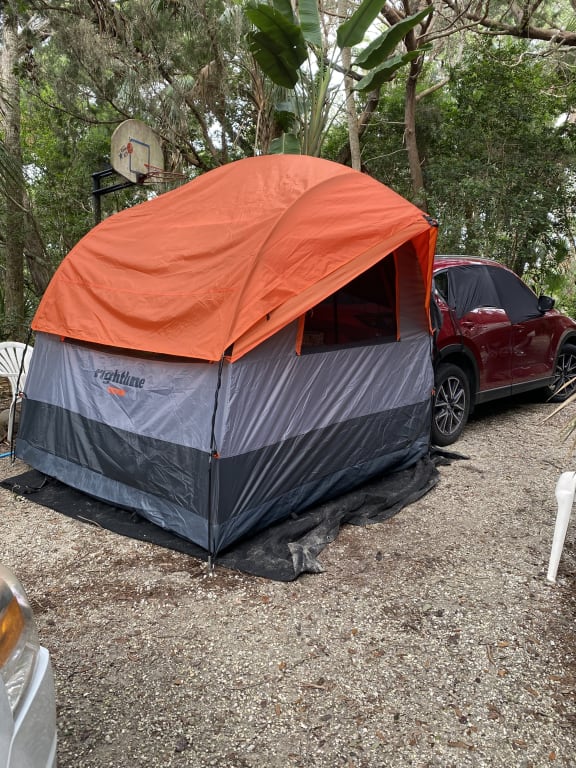
The Hatchback Annex Tent

$299.95

4.9
Rated 4.9 out of 5
I would recommend this
@Kathy
I did a test run for a solo camping trip I plan to do in September to the Smokies. I had not been tent camping for many years and at 69 I was able to camp successfully solo with my new tent.

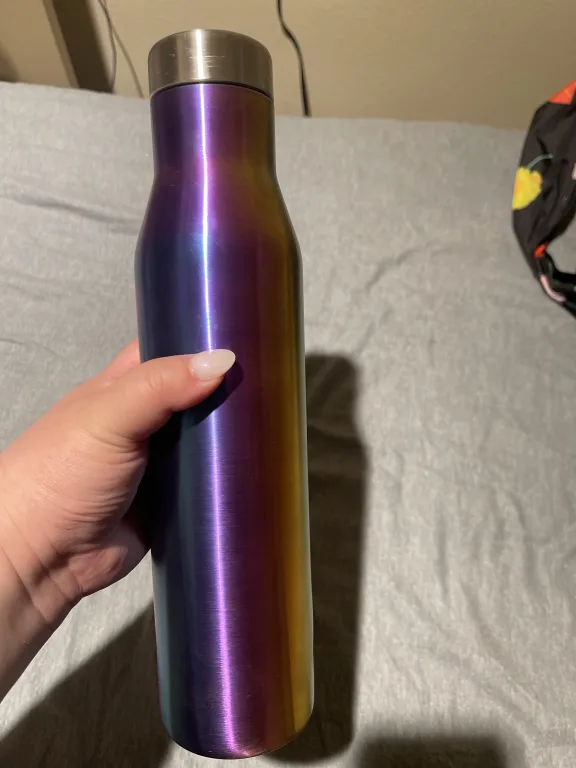
Insulated Stainless Steel Water & Wine Bottle

$34.99

5
Rated 5 out of 5
Goldilocks bottle!
@Lisa
I love that it's not too wide, fits in my smaller hand perfectly. I always wanted a bottle without a handle for my bag but couldn't completely gave up the convenience, this bottle is so perfect for my need.

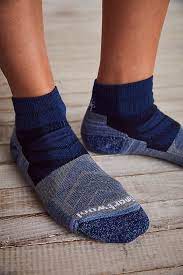
Hike Light Cushion Ankle Socks

$22

4.9
Rated 4.9 out of 5
Comfortable, Breathable Hike and Daily Sock
@Tyler
The socks feel soft on my feet and the cushion level is just right for hikes, runs, and daily wear. They didn't slip or slide and stayed in place. The socks felt supportive and secure on my feet and in my shoes as well. These are now a go to for daily wear and hiking.

Chocorua Trail Waterproof Hiking Boots

$150

4.6
Rated 4.6 out of 5
I Really Love These Boots
@LB
This is my second pair of Chocorua Trail Hiking Boots. I loved the first pair so much that I wore the treads off them. I do a lot of dog walking, and I was looking for shoes that provide great traction and are waterproof. My first pair lasted about three years with near constant use. I love these boots and came back for another pair.

Fun in the Sun

Metal Aviator Sunglasses

$78

4.8
Rated 4.8 out of 5
Celebrity Style Movie Star Look
@Monica
Beautifully crafted and tasteful, these shades are Fabulous. Great on most, if not, all faces. Both pairs I bought (my birthday gift to myself) SCREAM elegance and class. Lightweight but sturdy. I am so happy! Bravo Coach.

Inflatable Stand-Up Paddleboard Package

$499.99

4.8
Rated 4.8 out of 5
Great board for youth beginners
@SC
Absolutely fell in love with this board. Even my 10yr old could handle this with ease. She quickly gained confidence and let her friend hitch a ride. Maneuvered great with an incoming tide.

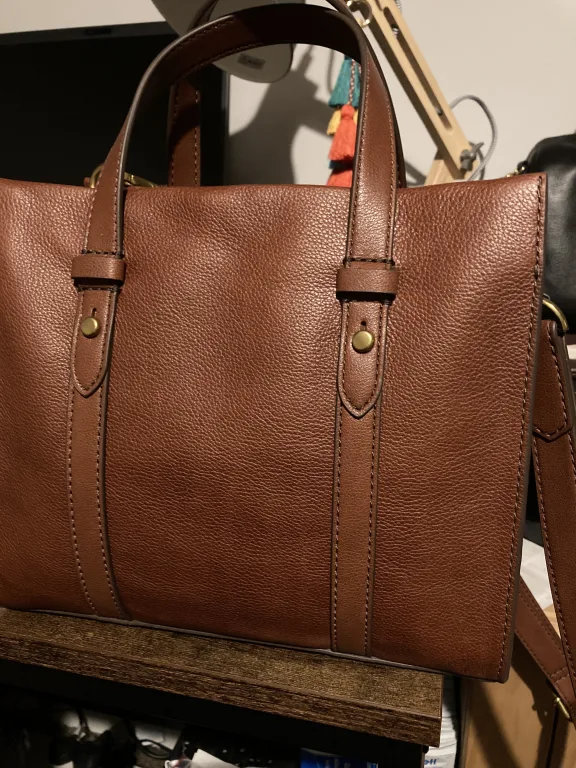
Kingston Satchel

$140

4.2
Rated 4.2 out of 5
Lovely shape
@T
Great size, enough room for my stuff. Love the shape. Leather is lovely.

CLIF PET Plant Based Jerky

$8.99

4.9
Rated 4.9 out of 5
Kuma loves this jerky!
@Matthew
Always on the lookout for new minimal ingredient treats for Kuma and these fit the bill perfectly! He perks right up as soon as he hears me open the bag.

Jumbo Square Trampoline

$2,499

4.9
Rated 4.9 out of 5
SO much fun for all of my kiddos!
@Molly
We have five kids 10 and under and decided on the jumbo square. I'm so glad we got the big one! The kids can all have their own spots to jump on and easily sit on the side while others jump. My daughter is a competitive dancer and loves practicing her moves on the trampoline safely.

Poppy Red Blythe Dress

$198

4.6
Rated 4.6 out of 5
The Most Perfect Dress
@Miko
It is so beautiful on - very flattering and I felt comfortable. Received MANY compliments throughout the evening! I can't wait to have another event to wear it to!! That high ruffled neck & bow is the BEST part.


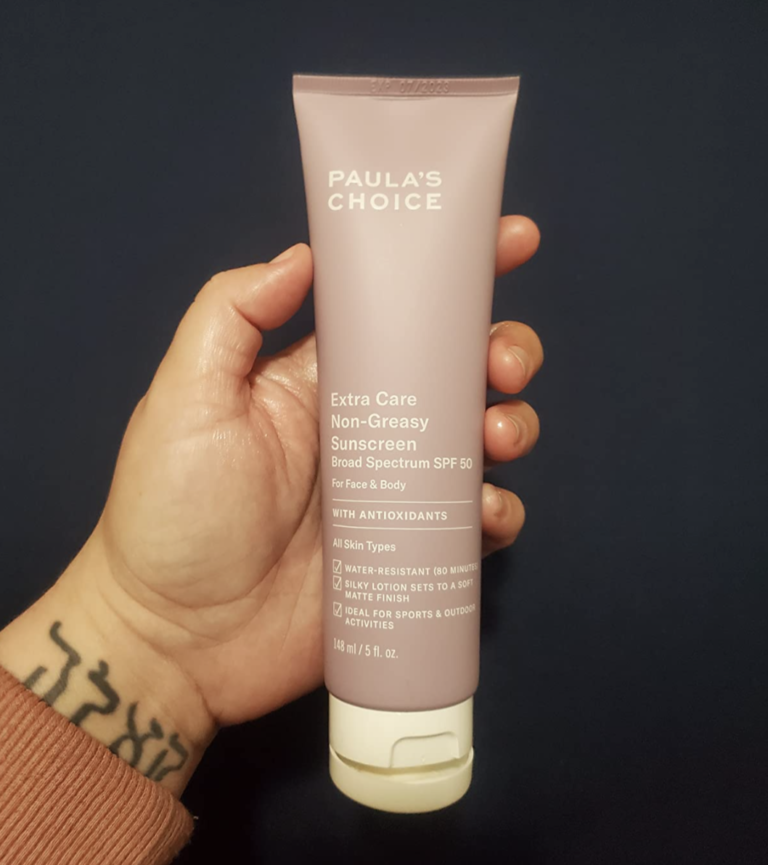
Extra Care Non-Greasy Sunscreen SPF 50

$19

3.8
Rated 3.8 out of 5
First sunscreen to not make me breakout!
@ Mackenzie
I apply it under my makeup in the morning and haven't gotten sunburn on my face or had any new breakouts since. It makes my face feel so glowy I don't even put makeup on most days when I leave the house! I play an outdoor college sport and this is AMAZING!

St. Louis Classics

$295

5
Rated 5 out of 5
BEST EVER!
@Daphne
I'd been wearing the same sunglasses for 3 years. I searched on-line and stopped cold when I saw the St. Louis Classics. Thought about them for a day or two then ordered them. I love them!! Have had compliments everytime I wear them...from young people; I'm 74:). Never stop feeling amazing!

Hit the Road

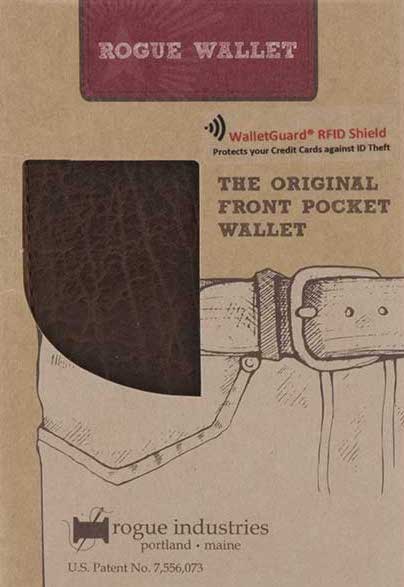
Bison Wallet with RFID Protection

$60

4.9
Rated 4.9 out of 5
I would buy this product again
@Bruce
I purchased this wallet for my husband. Since he started using it, he has commented many times how great if fits in the front pocket of his jeans.

Luci Solar Bike Light Set

$54.95

4.7
Rated 4.7 out of 5
Best Light Ever!!!!
@Kevin
Fantastic craftsmanship and ergonomically amazing! It's a 10 out of ten. No more driving in the dark for me!

Kentucky Bike Tour

$3,649+

5
Rated 5 out of 5
Kentucky did not disappoint.
@Joyce
What a beautiful experience. The lay of the land, the pristine farms, the breathtaking beauty of the equine. Rolling hills, challenging climbs. There was something for everyone all spearheaded by a team of young, dedicated, hard working leaders.

Portugal’s Algarve & Alentejo Bike Tour

$5,349+

5
Rated 5 out of 5
Amazing trip from start to end
@Jackie
I have dreamed of seeing Portugal so was thrilled when it became a Backroads trip. The leaders were just amazing. Great energy, so thoughtful. The quality of people that we shared our ride with was also amazing- just great people to spend time with. One of the best trips of my life!

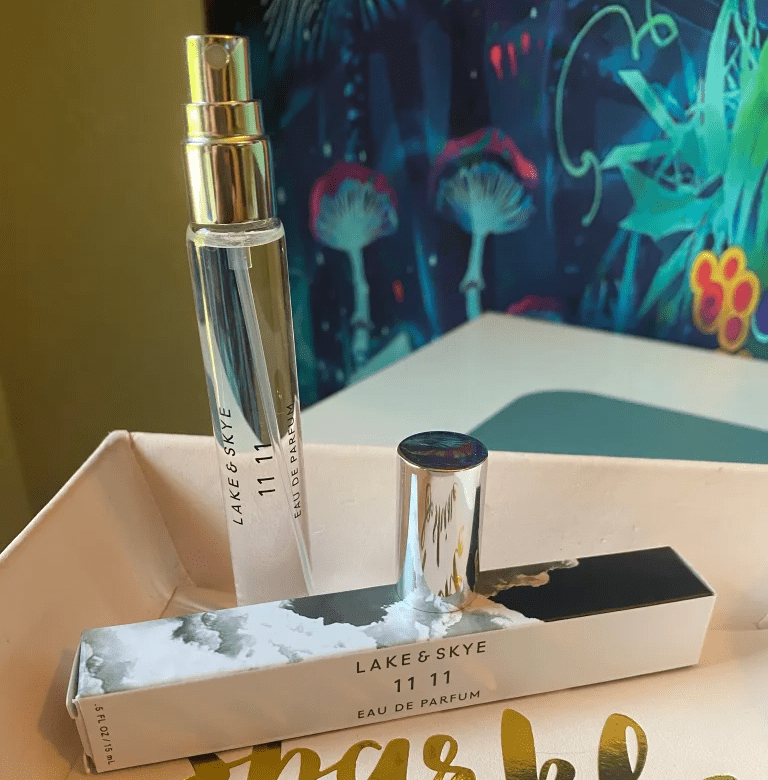
11 11 Purse Spray

$36

4.2
Rated 4.2 out of 5
Sheer, clean & uplifting
@M
This perfume is the perfect size to take on the go with you. It will fit even in your back pocket to be of no notice! This blend is organic, sugar cane alcohol and paraben, sulfate and phthalate.

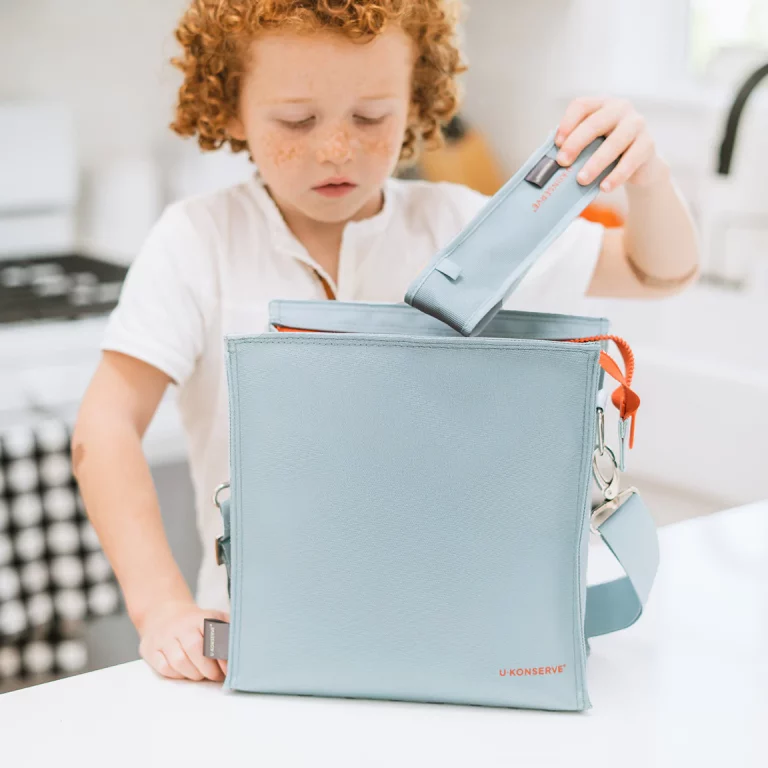
Keep It Cold Recycled Bundle

$39.99

5
Rated 5 out of 5
GREAT LUNCHBAG
@Nancy
Great for packing our lunch for trips in the car! Keeps things cool and is pretty spacious. I purchased the Seafoam color which is very appealing!

Self-Care Summer

Daily Vitamin Infusion

$67

4.8
Rated 4.8 out of 5
I love this oil
@Jodie
I love this oil. I have dry skin and as I get older-here I come 57- it gets drier. This oil feel so wonderful and goes on beautifully. Treat yourself!

HY-ÖL

$37

4.9
Rated 4.9 out of 5
Spectacular
@Juliana
My skin had been the worst it's ever been this last two months and just a week after using Babor cleansers and enzyme twice a week my skin is more beautiful than ever. So worth every penny!!

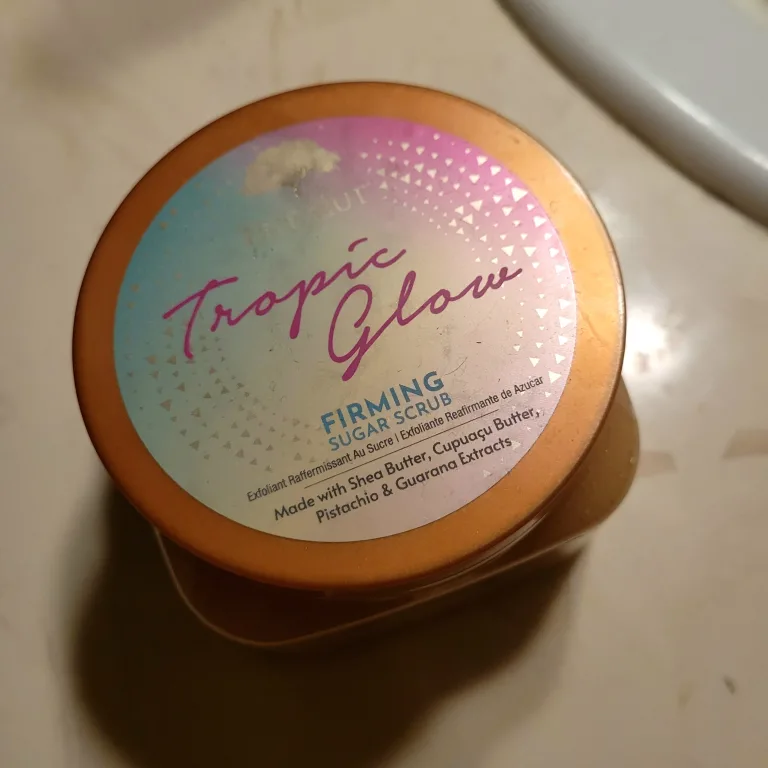
Tropic Glow Firming Shea Sugar Scrub

$10.49

4.8
Rated 4.8 out of 5
Self Care I Forgot I Needed
@B
I love the way my skins feels after I use this. It makes me feel extra clean and polished. My skin is much softer and smooth. This scrub helps me to relax and enjoy my evening more after a long hard day.

Softsculpt® Transforming Skin Enhancer

$30

4.8
Rated 4.8 out of 5
I didn't think it was this good!!
@Blondie
I was amazed with this product. I'd seen Mario doing a demo on a models skin but NEVER expected I could also get the same results. The skin perfector is also amazing. Both compliment each other so I'd say you should buy both.

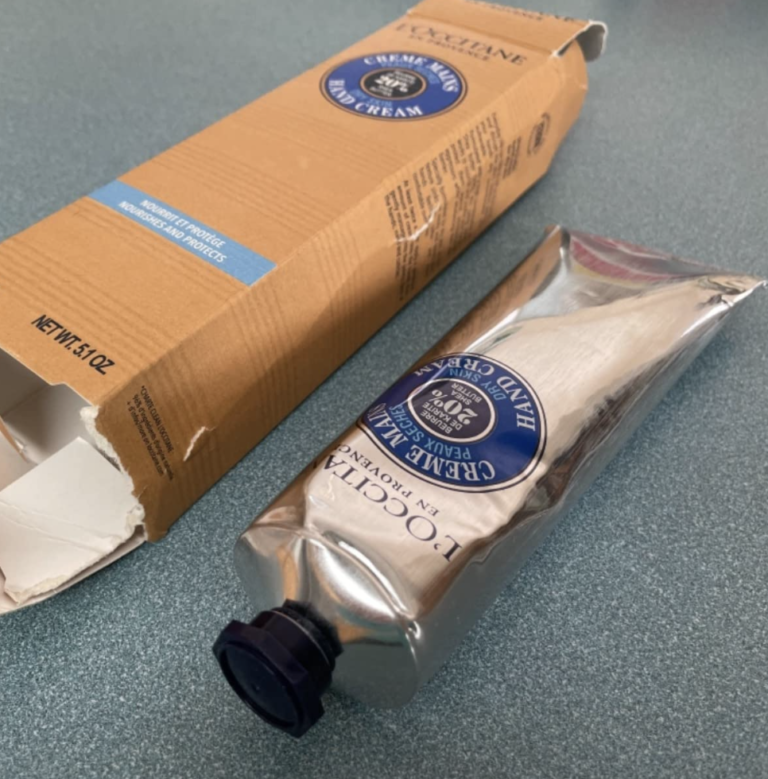
Shea Butter Hand Cream

$30

4.8
Rated 4.8 out of 5
Best cream anywhere
@Elaine
I have been using this Shea butter cream for years. It is simply the best cream on the market. I use it on my hands frequently and also on my feet, especially my heels, when it is sandal season.

Optic White® Overnight Teeth Whitening Pen

$25

4.2
Rated 4.2 out of 5
Love this Whitening Pen
@E
It's my favorite whitening product i've ever used! I love the pen format, it's really easy to use. I loved the results, I felt like my smile was whiter and I feel more confident about that.

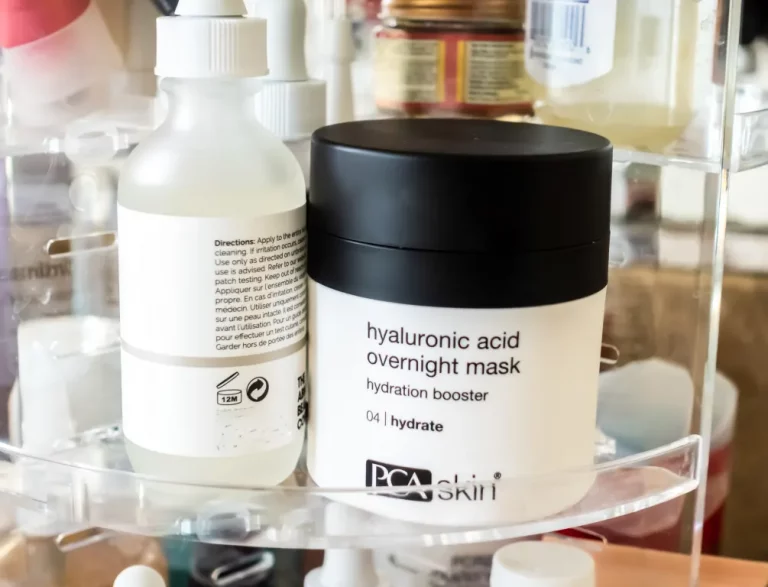
Hyaluronic Acid Overnight Mask

$69

4.7
Rated 4.7 out of 5
Simply Awesome!
@Rick
I'm a guy that has been getting into taking good care of my skin. This PCA Skin Hyaluronic Acid Overnight Mask was the icing on top. It really is super hydrating and makes my skin clean feeling, supple and soft to the touch.

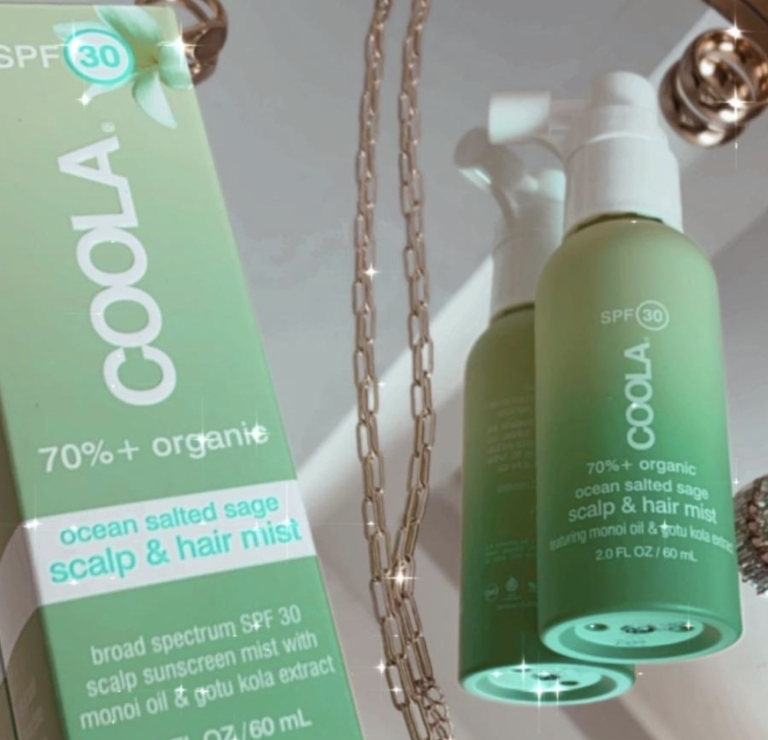
Scalp & Hair Mist Organic Sunscreen SPF 30

$26

4.3
Rated 4.3 out of 5
Wow!
@Crystal
I was honestly so worried because of the price & skeptical but needed something for our Universal Orlando trip. None of us got sunburnt! Absolutely worth it. And it smells really good, too!

Summer of Sports

Astroman Sun Hoodie

$89

4.8
Rated 4.8 out of 5
Thin and comfortable sun protection!
@Katie
I took this item with me to hike in the Appalachian Mountains-- definitely a stylish, comfortable, thin, and overall ideal part of my hiking attire. Would definitely recommend!

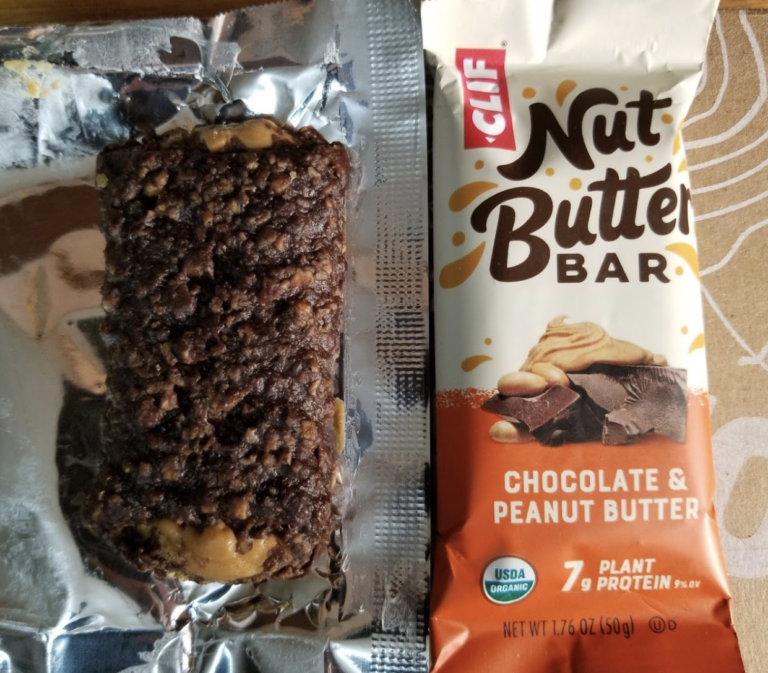
Nut Butter Bar

$7.99

4.8
Rated 4.8 out of 5
Immensely Enjoy Your Organic, Non-Soy Nut Butter Bars
@Dude
These are the only Clif products I purchase, because they are the only organic, non-soy products you sell. I greatly enjoy all flavors of your nut butter bars!

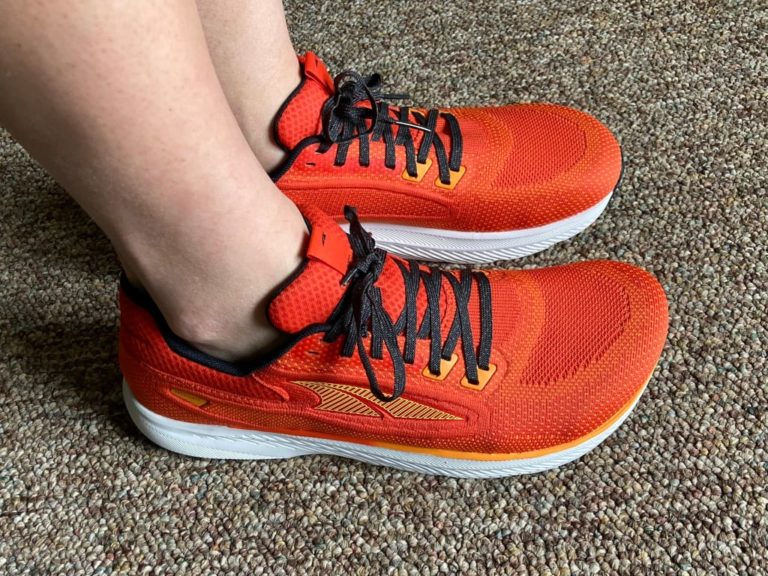
Escalante 3

$140

3.3
Rated 3.3 out of 5
My new go-to running shoe
@Josiah
When the shoes arrived, the best way I can describe the initial step-in feel would be like reconnecting with an old friend, only somehow finding us being closer friends than I'd remembered leaving off. If you're a zero-drop running shoe aficionado who appreciates a just-right amount of ground feel without sacrificing cushion/comfort, look no further.

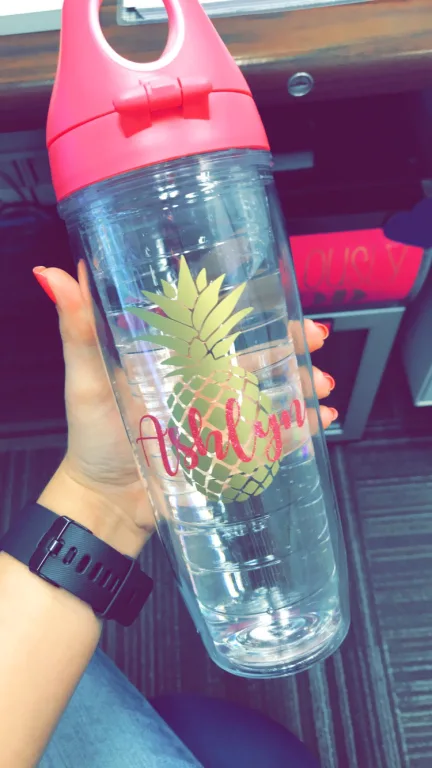
Clear & Colorful Water Bottle

$19.99

4.7
Rated 4.7 out of 5
Love it! Easy to customize
@Ashlyn
I love my Tervis! I really like the measurements in ounces on the side so I know how much I have drank. I also love the lid because it's easy to hold the bottle with your thumb and it stays tight (so no leaking).

Fruit Smoothie Energy Gel Box of 24

$39.99

4.9
Rated 4.9 out of 5
My favorite go-to
@Eva
Favorite pre-race non-caffeinated gel! Super great flavor too!!

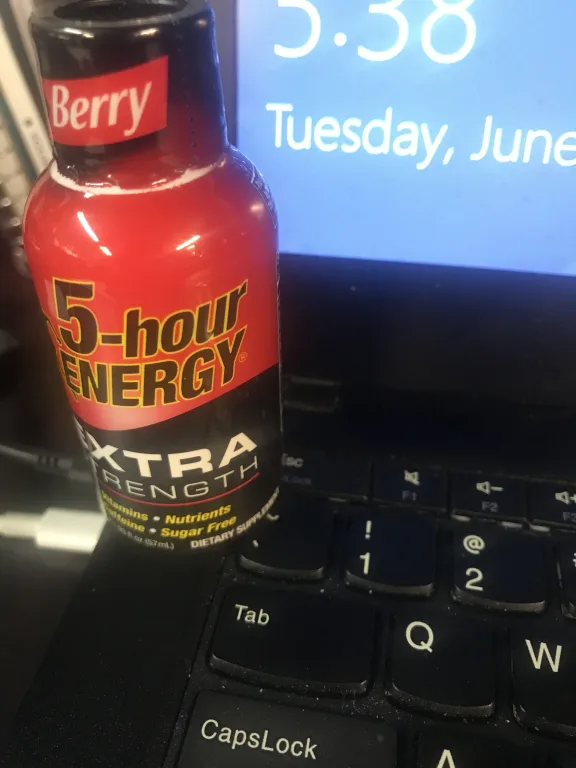
Berry Flavor Extra Strength

$58.96

5
Rated 5 out of 5
I use 5 hour daily!
@Joe
Instead of coffee, I drink 5 Hour. Unlike coffee, 5 Hour is quick and easy. Tastes great at any temperature. Lasts loooong, much longer than coffee and no crash.

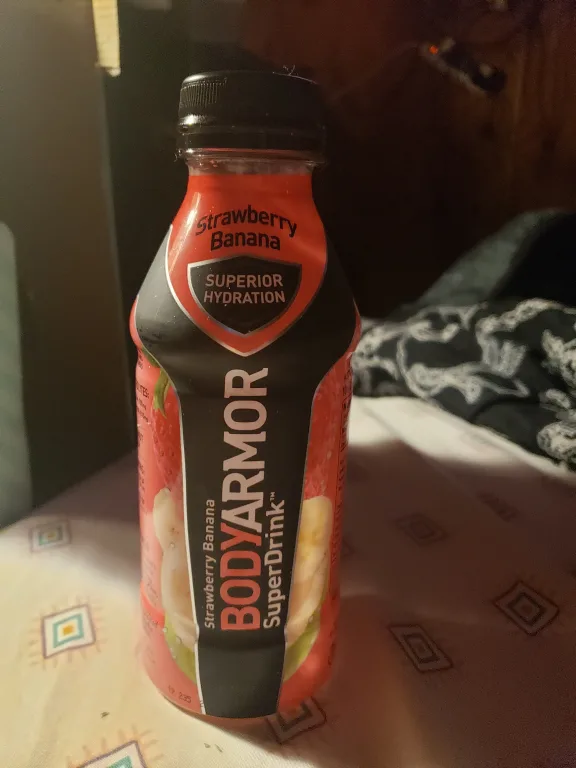
BODYARMOR Sports Drink

$12+

4.7
Rated 4.7 out of 5
I love BODYARMOR
@Cindy
My granddaughter is 5 she is also a huge fan. We love the variety of flavors and that they actually taste like the flavors listed. My granddaughter is drinking strawberry banana as I write this. Thank you for a product that is truly better for us than some juices.

Ultra High Rise Elation Tight

$89

4.8
Rated 4.8 out of 5
Like butter!
@Yami
I own plenty of leggings from Athleta, but this by far is my favorite! They fit like a glove! So smooth And comfortable, the small petite always fits me very well. I need at least 5 more pairs!!

14X SPORT

$189.99

4.9
Rated 4.9 out of 5
Best kids balance bike ever
@Kathleen
My son is 5, had no Interest. We tried bike with training wheels and no luck. Purchased the 14x. Best purchase ever! We purchased it with the kit. Amazing that you can take the pedals off and put them back on in seconds. Amazing quality! If your kid is hesitant this is the route to go. I would buy it again in a heart beat!!!!

2-IN-1 ROCKING BIKE

$229.98

4.9
Rated 4.9 out of 5
Great product. Fast delivery.
@Adria
Easy ordering and fast delivery. My 2 year old niece has been rocking away on her Strider for a year now and almost ready to remove the rocker base. This toy is used daily, she rides it watching TV shows, rides itbwith her dollies, and loves to show it off to everyone who comes to the house.

Try Some DIY

20-Lumen Solar Down Lights

$19.98

5
Rated 5 out of 5
Really dresses up the landscaping
@BAF
Solar power is so much easier and less expensive than low voltage wired lighting. It's also very easy to reposition the lights to achieve the look you want.

High Performance Epoxy Resin Kits

$37.99+

4.7
Rated 4.7 out of 5
Excellent Product, Nice and Clear, Turns Great!
@Misfit
My first time using and I poured a small mold, put in pressure pot, and turned a dish on the lathe. Results were great. Would recommend. Came with lots of extras - cups, sticks, etc. Cool extras.

Saffron Crocus

$9.99

4.2
Rated 4.2 out of 5
Gorgeous saffron in weeks
@Pat
We're in zone 5, so we are using pots on the porch, and they all bloomed as expected roughly five weeks after planting. Such fun harvesting the beautiful saffron.

Staris E-Series

$9,499+

4.3
Rated 4.3 out of 5
A back yard all star!
@J
We have been waiting for a compact mower that can fit through a standard 36" gate. This 32" is a power house and gets the job done on flat lawns!

Quest E-Series

$3,899+

4.7
Rated 4.7 out of 5
Beauty and Beast
@G
Exmark was the correct choice. I currently have 4.2 heavily treed acres, which is why I have the 42" Quest. My Quest is built like a tank, and the cut is amazing. Friends come down my 300 yard drive, and think I have a professional lawn service. She's a beauty, but she's a beast.

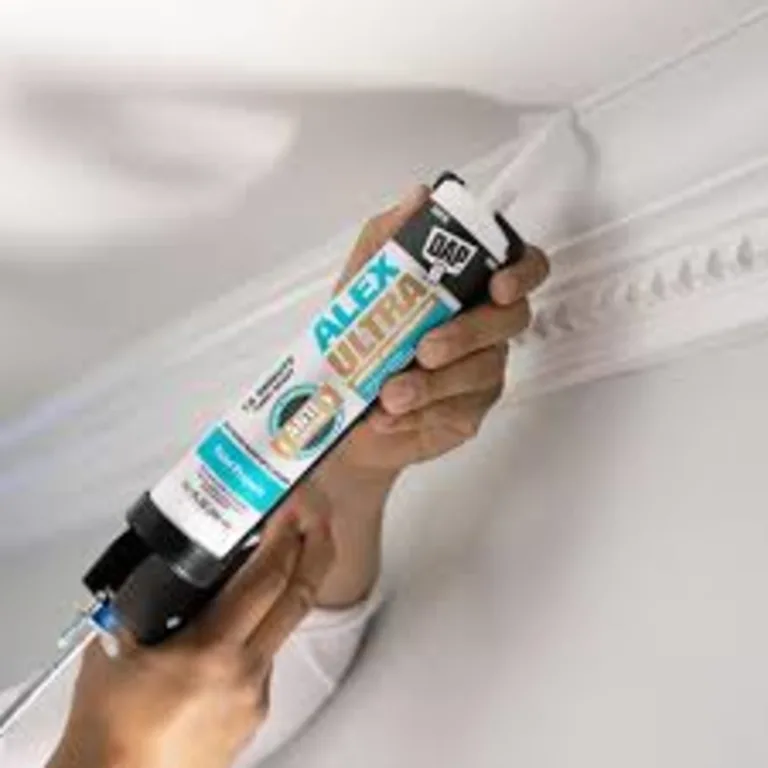
ALEX® ULTRA Advanced Latex Sealant

$55.68

4.9
Rated 4.9 out of 5
Got The Job Done!!
@Tee
It went on smoothly and within 15 minutes of applying I was able to start painting. I loved that it was mildew and mold resistant. Its also waterproof so that gave me peace of mind. Also after applying I noticed there wasn't really that heavy odor in the air. It got the job done perfectly!!!
How consumers browse and buy clothing and footwear products, according to a survey of nearly 12,000 shoppers

Survey at a Glance:

The State of Apparel & Footwear Shopping in 2022 study is based on survey responses from 11,862 beauty clothing and footwear shoppers across the United States. Here’s a look at our key findings.

Online Apparel and Footwear Shopping Continues to Grow
  • 89% spend more than $101 online on apparel and footwear each year, with 67% of all clothing spend and 74% of all footwear spend occurring online.
  • Just over half (51%) indicate they spend more money on apparel products online than they did pre-COVID.
  • The most common places for consumers to start the apparel purchase journey online include retailer sites (35%), brand sites (33%), and Amazon.
Consumers Weigh Many Factors When Purchasing Apparel and Footwear
  • The top factors apparel shoppers pay attention to are fit/sizing (89%), comfort (84%), and overall quality of the product (76%).
  • Apparel and footwear shoppers also seek out specific information when deciding whether or not to make a purchase., including price (84%), ratings and reviews (78%) and imagery provided by people who have previously purchased the product (56%).
Ratings and Reviews are Essential to Apparel Shoppers
  • 99% of consumers read ratings and reviews when shopping for clothing online;  86% always or regularly do so.
  • 98% read reviews when shopping for footwear at least occasionally; 85% do so regularly or always. 
  • Apparel and footwear shoppers pay particular attention to opinions on specific details relevant to the product (72%), average star rating (70%), review volume (65%) and review recency (56%). 
  • 42% of apparel and footwear shoppers say that ideally, they’d be able to find over 101 reviews for a product. However, the largest portion of shoppers (65%) only read between one and 25.
Clothing and Footwear Shoppers Alike Seek Out User-Generated Visual Content
  • 96% of consumers seek out photos and videos from other consumers when shopping for clothing online at least occasionally. 75% always or regularly do so.  
  • 95% of online footwear shoppers seek out user-generated photos and videos at least occasionally. 69% do so always or regularly.
Consumers Turn to Q&A to Eliminate Their Purchase Blocking Questions
  • 97% of consumers read Q&A at least sometimes when shopping for apparel online. 64% do so regularly or always. 
  • Nearly all (97%) online footwear shoppers consult the Q&A section of product pages at least occasionally. 63% regularly or always do so.
Chapter 1

Introduction

Modern Apparel Shoppers Have Endless Choices

There was a time when just about all clothing and footwear purchases for the family were made within the confines of a brick-and-mortar store. And any given apparel category was dominated by a handful of major players. Shopping for athletic footwear? Have your pick of Nike, Adidas, or Reebok. Browsing for jeans? Levi’s, Wrangler, and Calvin Klein dominated the market. 

As with other types of products, consumers have increasingly embraced the convenience of browsing and buying clothing and footwear without leaving home – a trend that’s only picked up since the onset of the pandemic. 

What’s more, new, direct-to-consumer apparel and footwear brands seem to pop up overnight. Barriers to entry have never been lower, which certainly creates opportunities for emerging brands. But it also creates fierce competition, as shoppers have more options than ever before – and many won’t hesitate to jump ship for the next big thing. Our latest research found that a mere 25% of apparel and footwear shoppers consider themselves to be brand loyal.

Only 25% of apparel and footwear shoppers consider themselves to be brand loyal.

Apparel Shoppers Do Their Research

Whether they’re shopping for clothing and footwear online, in-store, or some combination of the two, consumers are weighing many factors and doing plenty of research before making a purchase decision. More and more, a key part of this research is seeking out feedback from others who have already purchased the product in question.

It’s Time to Shift Your Strategy to Meet Shoppers’ Expectations

One thing is clear: apparel brands and retailers must work harder than ever to attract, convert and retain customers. It all starts with understanding how these consumers are navigating the purchase journey 

Chapter 2

Who We Surveyed

This report is based on a survey completed by 11,862 US consumers during the month of June 2022. Here’s a closer look at who we surveyed.

Generations

Gen Z
(1997-present)
8%
Millennials
(1981-1996)
55%
Gen X
(1965-1980)
29%
Baby Boomers
(1946-1964)
8%

Household Income

$0-$25,000
10%
$26,000-$50,000
20%
$51,000-$75,000
20%
$76,00-$100,000
18%
$101,000-$250,000
23%
$251,000+
4%
Prefer not to say
5%
Chapter 3

A Snapshot of Clothing and Footwear Spending

Before we take a deep dive into how consumers are shopping for apparel and footwear products, let’s first take a look at how much they’re spending on these products – both overall and online.

Yearly Overall Apparel and Footwear Spending

Many shoppers have sizable apparel and footwear budgets. The largest portion of shoppers (31%) spend $2,001 or more overall on apparel and footwear products. Nearly a quarter (24%) spend between $501 and $1,000 and 22% spend between $1,001 and $2,000. 

It’s no surprise that those with higher incomes tend to have higher annual clothing and apparel budgets. 

Overall Yearly Apparel and Footwear Spending
Roughly how much money do you spend OVERALL (i.e. online and in-store) on apparel (clothing and footwear) products per year?
$0
0%
$1-100
4%
$101-500
19%
$501-1000
24%
$1001-2000
22%
$2001+
31%
Household Income $0-$25,000
$0
1%
$1-100
20%
$101-500
41%
$501-1000
19%
$1001-2000
10%
$2001+
9%
Household Income $26,000-$50,000
$0
0%
$1-100
5%
$101-500
28%
$501-1000
28%
$1001-2000
20%
$2001+
19%
Household Income $51,000-$75,000
$0
0%
$1-100
2%
$101-500
20%
$501-1000
26%
$1001-2000
24%
$2001+
28%
Household Income $76,000-$100,000
$0
0%
$1-100
1%
$101-500
14%
$501-1000
27%
$1001-2000
24%
$2001+
34%
Household Income $101,000-$250,000
$0
0%
$1-100
1%
$101-500
9%
$501-1000
18%
$1001-2000
26%
$2001+
46%
Household Income $250,000+
$0
0%
$1-100
0%
$101-500
3%
$501-1000
11%
$1001-2000
16%
$2001+
70%

An Overview of Online and Apparel Footwear and Spending

Online apparel and footwear spending tends to be less than overall spending, which proves that brick-and-mortar continues to be a viable option for many shoppers. 

The largest portion of shoppers – 29% – spend between $101 and $500 online on apparel and footwear each year. A quarter (25%) spend between $501 and $1,000. 

Online apparel spend is correlated with household income. Those with higher incomes tend to spend more online each year on clothing and footwear.

Overall Yearly Apparel and Footwear Spending
Roughly how much money do you spend ONLINE on apparel (clothing and footwear) products per year?
$0
1%
$1-100
10%
$101-500
29%
$501-1000
25%
$1001-2000
19%
$2001+
16%
Household Income $0-$25,000
$0
3%
$1-100
32%
$101-500
40%
$501-1000
14%
$1001-2000
7%
$2001+
4%
Household Income $26,000-$50,000
$0
1%
$1-100
14%
$101-500
38%
$501-1000
26%
$1001-2000
13%
$2001+
8%
Household Income $51,000-$75,000
$0
1%
$1-100
8%
$101-500
31%
$501-1000
28%
$1001-2000
18%
$2001+
14%
Household Income $76,000-$100,000
$0
1%
$1-100
5%
$101-500
26%
$501-1000
30%
$1001-2000
21%
$2001+
17%
Household Income $101,000-$250,000
$0
0%
$1-100
2%
$101-500
18%
$501-1000
27%
$1001-2000
28%
$2001+
25%
Household Income $250,000+
$0
0%
$1-100
1%
$101-500
9%
$501-1000
18%
$1001-2000
25%
$2001+
47%

Significant majority of apparel and footwear purchases occur online

We also asked consumers to break down their overall spending by estimating the dollar amount spent on both clothing and footwear each year. Based on their responses, 67% of all clothing spend and 74% of all footwear spend now occurs online.

Average Overall Annual Spend (Online & In-Store)
Estimated OVERALL spend on CLOTHING and FOOTWEAR products per year. *
$2,086
$991
*Average (mean) of all write-in responses to question: Please enter a rough estimate of how much you spend OVERALL on CLOTHING and SHOES products per year.
Average Annual Online Spend
Estimated ONLINE spend on CLOTHING and FOOTWEAR products per year.
$1,399
$735
*Average (mean) of all write-in responses to question: Please enter a rough estimate of how much you spend ONLINE on CLOTHING and SHOES products per year.
67% of all clothing spend and 74% of all footwear spend now occurs online.
Chapter 4

The Impact of COVID on Apparel and Footwear Spending

The COVID-19 pandemic has had a lasting impact on just about all aspects of daily life. This includes the size of shoppers’ apparel and footwear budgets – and where they choose to spend these dollars. The biggest takeaway is that the pandemic has led to an uptick in online spend despite overall spending being roughly in line with pre-pandemic levels.

COVID Has Impacted Overall Shopping Habits of Half of Consumers

Just over half (54%) of shoppers say their overall clothing and footwear shopping habits have been impacted by Covid. While 29% say they spend less money on apparel and apparel than pre-COVID, a quarter actually spend more. 

Interestingly, Boomers and Gen X’ers are more likely to have tightened their overall apparel budgets, while Gen Z shoppers are the group most likely to have increased their spending. 

The Impact of COVID on Overall Apparel Spending Habits
How has COVID impacted your OVERALL apparel (clothing and footwear) spending habits?
Overall
Spend less
29%
Spend more
25%
Spending unchanged
46%
Gen Z
Spend less
27%
Spent more
36%
Spending unchanged
37%
Millennials
Spend less
27%
Spent more
28%
Spending unchanged
45%
Gen X
Spend less
30%
Spent more
21%
Spending unchanged
49%
Boomers
Spend less
39%
Spend more
12%
Spending unchanged
49%

Many Consumers Have Increased Online Apparel Spending Post-COVID

The pandemic has also impacted where consumers spend their apparel budgets. 

Just over half (51%) of consumers say they spend more money on apparel products online than they did pre-pandemic. This number is even higher among Gen Z (62%) and Millennial (54%) shoppers.

The Impact of COVID on Online Apparel Spending Habits
How has COVID impacted your ONLINE apparel (clothing and footwear) purchasing habits?
Overall
Spend less
51%
Spend more
15%
Spending unchanged
34%
Gen Z
Spend less
62%
Spent more
14%
Spending unchanged
24%
Millennials
Spend less
54%
Spent more
14%
Spending unchanged
32%
Gen X
Spend less
47%
Spent more
16%
Spending unchanged
37%
Boomers
Spend less
34%
Spend more
23%
Spending unchanged
43%
Chapter 5

The Factors that Matter Most to Apparel and Footwear Shoppers

Consumers weigh many different factors when making a purchase decision. But what specifically do apparel and footwear shoppers pay attention to? And what information do they seek out to fuel smart purchase decisions? 

Shoppers’ Relationship to Apparel

One way we gauged what’s important to apparel shoppers is by asking them to describe themselves in relation to clothing and footwear. Typically, these purchases are deeply personal – with motivations dictated by individual preferences.

Interestingly, just a quarter (25%) of clothing and footwear buyers consider themselves brand loyal. This presents an opportunity to brands and retailers, as it’s clear that shoppers can be swayed. However, it’s also a reminder that businesses must work harder than ever to retain their existing customers.

How Shoppers Describe Themselves in Relation to Shopping for Clothing and Footwear
Which of the following describes you in relation to shopping for clothes and footwear?
I mainly care about the comfort of the clothing I buy
74%
I’m always looking for the latest fashion, trends and newest releases
66%
I mainly care about the look of the clothing and footwear I buy
64%
I prioritize apparel and footwear items that are low cost
31%
I actively seek out sustainably developed clothing and footwear
30%
I’m brand loyal
25%

Apparel and Footwear Shoppers Weigh Many Factors

Size and fit is the top factor considered by apparel and footwear shoppers, with 89% indicating it’s something they pay attention to. This isn’t surprising, as shoppers want to ensure the items they purchase will actually fit the way they expect.

Comfort is the next most important factor; 84% of shoppers pay attention to comfort when considering a clothing or footwear purchase.

Top Factors For Apparel and Footwear Shoppers
When considering a clothing and footwear purchase, which of the following do you pay attention to?
Fit/sizing
89%
Comfort
84%
Overall quality of the product
76%
What the product looks like on a person in real life
69%
Durability (i.e. how long the product lasted)

58%
Material
57%

Price and Feedback from Previous Customers are Essential for Apparel Shoppers

When considering an apparel or footwear purchase, there are certain things shoppers specifically seek out. Not surprisingly, price tops the list.

However, feedback from those who have already purchased the product is close behind. When considering a purchase, over three-quarters (78%) look for ratings and reviews and 56% look for imagery provided by people who have purchased the product in question.

That makes user-generated content more valuable than other factors including shipping, brand, and even recommendations from family and friends.

What Apparel and Footwear Shoppers Look For
Which of the following do you look for when deciding whether or not to purchase an apparel (clothing or footwear) product?
Price of the product
84%
Ratings and reviews
78%
Imagery provided by people who have previously purchased the product
56%
Favorable returns or exchanges policy
51%
Imagery provided by the brand or retailer
50%
Fast shipping
50%
Brand of the product
48%
Retailer/store purchased from
38%
Recommendation from family/friends
34%
Chapter 6

How Consumers are Shopping for Apparel Online

Many consumers have ramped up their online apparel shopping. But what types of apparel products are they purchasing online? And where are they typically browsing and buying these items?

Consumers Shop for Many Apparel Products Online

It seems consumers are purchasing just about all types of apparel and footwear online. Casual clothing and footwear tops the list, with 96% indicating they purchase their items online.

Clothing and Footwear Products Consumers Purchase Online
Which of the following types of apparel and footwear do you buy online?
Casual clothing and footwear
96%
Athleticwear and footwear
84%
Sleepwear and intimates
73%
Children’s clothing and footwear
49%
Formal clothing and footwear
49%
Business clothing and footwear
46%

In addition, there are certain apparel categories that shoppers indicate they’re more likely to purchase online than in a brick-and-mortar store. Casual clothing and footwear is at the top of the list, with 71%.

Clothing and Footwear Consumers are More Likely to Purchase Online
Which of the following types of apparel and footwear – if any – are you MORE LIKELY TO BUY ONLINE THAN IN-STORE?
Casual clothing and footwear
71%
Athleticwear and footwear
61%
Sleepwear and intimates
53%
Children’s clothing and footwear
34%
Formal clothing and footwear
27%
Business clothing and footwear
25%

Where Online Apparel Shoppers Start the Purchase Journey

Online shoppers now have plentiful options across just about all product categories. So where are online shoppers most often starting the search for apparel and footwear products?

Retailer and brand websites are nearly tied for first place. While 35% of shoppers typically start shopping for apparel and footwear products on a retailer’s website, a third (33%) start on a brand’s website. Amazon comes in at third place; just over a quarter (27%) of shoppers typically start their search for apparel and footwear products here. 

There are some notable differences based on generation. For example, Gen Z’ers and Millennials are particularly fond of brand websites, while Gen X’ers and Boomers gravitate to retailer sites. In addition, Amazon is significantly more popular among older consumers.

Where Consumers Begin Shopping Online for Apparel and Footwear
When shopping online, where do you MOST OFTEN BEGIN shopping for apparel and footwear products?
Overall
A retailer’s website selling lots of different brands
35%
A brand’s website selling its own clothes and footwear
33%
Amazon
27%
A social media platform
3%
None of the above
2%
Gen Z
A retailer’s website selling lots of different brands
25%
A brand’s website selling its own clothes and footwear
48%
Amazon
19%
A social media platform
3%
None of the above
2%
Millennials
A retailer’s website selling lots of different brands
34%
A brand’s website selling its own clothes and footwear
36%
Amazon
26%
A social media platform
3%
None of the above
1%
Gen X
A retailer’s website selling lots of different brands
37%
A brand’s website selling its own clothes and footwear
28%
Amazon
30%
A social media platform
3%
None of the above
2%
Boomers
A retailer’s website selling lots of different brands
42%
A brand’s website selling its own clothes and footwear
18%
Amazon
32%
A social media platform
2%
None of the above
6%

Where Online Shoppers End the Purchase Journey

We know where online apparel shoppers are starting the purchase journey. But where are they ultimately making a purchase? 

Retailer websites are the most popular, with 65% of shoppers indicating they frequently make purchases for apparel and footwear products on such a site. Over half (57%) frequently make apparel purchases on a brand’s website, and 55% often purchase on Amazon. About one in ten (11%) frequently purchase via a social media platform.

Where Online Shoppers Purchase Apparel and Footwear Products
When shopping online, where would you say you FREQUENTLY MAKE PURCHASES for apparel and footwear products?
Retailer’s website
65%
Brand’s website
57%
Amazon
55%
Social Media Platform
11%
Chapter 7

The Role of Ratings & Reviews in Apparel and Footwear Shoppers’ Purchase Decisions

Apparel and Footwear Shoppers Frequently Consult Reviews

Nearly all (99%) of consumers read ratings and reviews when shopping for clothing online, with 86% indicating they always or regularly do so.

Younger generations consult reviews more often than older ones. Nine in ten (91%) of Gen Z’ers and 98% of Millennials always or regularly read reviews when shopping for clothing online – compared to 82% of Gen X shoppers and 72% of Boomers.

How Often Clothing Shoppers Consult Reviews
How often do you read ratings and reviews when shopping for CLOTHING online?
Overall
Always
57%
Regularly
29%
Sometimes
10%
Occasionally
3%
Never
1%
Gen Z
Always
68%
Regularly
23%
Sometimes
7%
Occasionally
1%
Never
1%
Millennials
Always
62%
Regularly
27%
Sometimes
8%
Occasionally
2%
Never
1%
Gen X
Always
49%
Regularly
33%
Sometimes
12%
Occasionally
4%
Never
2%
Boomers
Always
39%
Regularly
33%
Sometimes
16%
Occasionally
8%
Never
4%

Online shoppers also turn to reviews when browsing for footwear. Nearly all (98%) do so at least occasionally, and 85% do so regularly or always. 

Again, younger consumers tend to consult reviews more frequently than older ones. 

How Often Footwear Shoppers Read Reviews
How often do you read ratings and reviews when shopping for FOOTWEAR online?
Overall
Always
59%
Regularly
26%
Sometimes
10%
Occasionally
3%
Never
2%
Gen Z
Always
69%
Regularly
20%
Sometimes
7%
Occasionally
3%
Never
1%
Millennials
Always
63%
Regularly
25%
Sometimes
9%
Occasionally
2%
Never
1%
Gen X
Always
53%
Regularly
30%
Sometimes
12%
Occasionally
3%
Never
2%
Boomers
Always
43%
Regularly
29%
Sometimes
14%
Occasionally
8%
Never
6%

Apparel and Footwear Shoppers Consider Myriad Review Elements

When browsing reviews for apparel and footwear products online, consumers factor in many elements. The top one is consumer opinions on specific extra details relevant to the product.

The Review Elements Online Apparel and Footwear Shoppers Consider
When it comes to ratings and reviews, which of the following do you consider when buying an apparel (clothing or footwear) item online?
Consumer opinion on specific extra details relevant to the product
72%
Average star rating
70%
Volume of reviews
65%
Recency of reviews
56%

Apparel and Footwear Shoppers Want a Large Volume of Reviews – But Actually Read Far Fewer

65% of shoppers consider the quantity of reviews available for a given product. But how many reviews do apparel and footwear shoppers want to be able to find? And how many do they actually read?

One in five (20%) of shoppers say that the ideal number of reviews for an apparel or footwear product is between one and 25, while another 20% indicate the magic number falls between 51 and 100. However, nearly half (42%) say that ideally, they’d be able to find over 101 reviews for a product.

Of note, younger shoppers have significantly higher expectations for ideal review quantity. While 51% of Gen Z shoppers and 45% of Millennials ideally want to find over 101 reviews for any given apparel or footwear product, 37% of Gen Xer’s and 21% of Boomers have this expectation.

The Ideal Number of Reviews for Apparel and Footwear Products
What is the IDEAL number of customer reviews a clothing or footwear item should have in your opinion?
Overall
0
2%
1-25
20%
26-50
17%
51-100
20%
101-500
19%
501-1,000
11%
1,001-5,000
8%
5,001-10,000
2%
10,000+
1%
Gen Z
0
1%
1-25
11%
26-50
15%
51-100
22%
101-500
24%
501-1,000
14%
1,001-5,000
9%
5,001-10,000
3%
10,000+
1%
Millennials
0
1%
1-25
16%
26-50
17%
51-100
21%
101-500
19%
501-1,000
13%
1,001-5,000
10%
5,001-10,000
2%
10,000+
1%
Gen X
0
2%
1-25
23%
26-50
17%
51-100
21%
101-500
18%
501-1,000
10%
1,001-5,000
6%
5,001-10,000
2%
10,000+
1%
Boomers
0
6%
1-25
42%
26-50
14%
51-100
17%
101-500
11%
501-1,000
5%
1,001-5,000
4%
5,001-10,000
1%
10,000+
0%

Ideally, consumers of all ages want to be able to find a high volume of reviews for apparel and footwear products they’re considering. However, they’ll often settle for less.

The largest portion of consumers – 35% say that an apparel or footwear product must have between 1 and 25 reviews at a minimum for them to feel comfortable purchasing it. One in five (21%) say the sweet spot is between 26 and 100 reviews. Nearly a quarter (23%) say the minimum number of reviews a product needs to have is 101 or more. 

Younger shoppers require a higher minimum number of reviews than older ones. For example, 24% of Gen Z’ers say that a product needs 101+ reviews for them to feel confident purchasing it, compared to 10% of Boomers.

The Minimum Number of Reviews for Apparel and Footwear Products Consumers Will Settle For
What is the minimum number of reviews a clothing or footwear item needs to have for you to feel comfortable purchasing it?
Overall
0
4%
1-25
35%
26-50
21%
51-100
17%
101-500
13%
501-1,000
6%
1,001-5,000
3%
5,001-10,000
1%
10,000+
0%
Gen Z
0
2%
1-25
29%
26-50
25%
51-100
20%
101-500
12%
501-1,000
7%
1,001-5,000
4%
5,001-10,000
1%
10,000+
0%
Millennials
0
4%
1-25
32%
26-50
21%
51-100
18%
101-500
14%
501-1,000
7%
1,001-5,000
3%
5,001-10,000
1%
10,000+
0%
Gen X
0
5%
1-25
38%
26-50
21%
51-100
16%
101-500
12%
501-1,000
5%
1,001-5,000
3%
5,001-10,000
0%
10,000+
0%
Boomers
0
8%
1-25
54%
26-50
16%
51-100
12%
101-500
6%
501-1,000
3%
1,001-5,000
1%
5,001-10,000
0%
10,000+
0%

While many consumers want to be able to find a large quantity of reviews for a given apparel or footwear product, they typically actually read far fewer. The largest quantity (66%) of shoppers read between one and 25 reviews before purchasing an apparel or footwear product, while 20% read between 26 and 50.

Younger shoppers tend to read more reviews than older ones – but not by much.

Why the difference between the ideal number of reviews and the number consumers actually read? Likely, consumers want to be able to find a large volume of reviews because that means they’re more likely to find content that speaks to their unique needs and use cases. They can sort and filter content – and then read just the content that’s relevant to them. 

Apparel brands and retailers must work to generate a high volume of reviews for all products – and then provide sorting, filtering, and search capabilities so shoppers can quickly surface relevant content that will boost their confidence and likelihood of purchase.
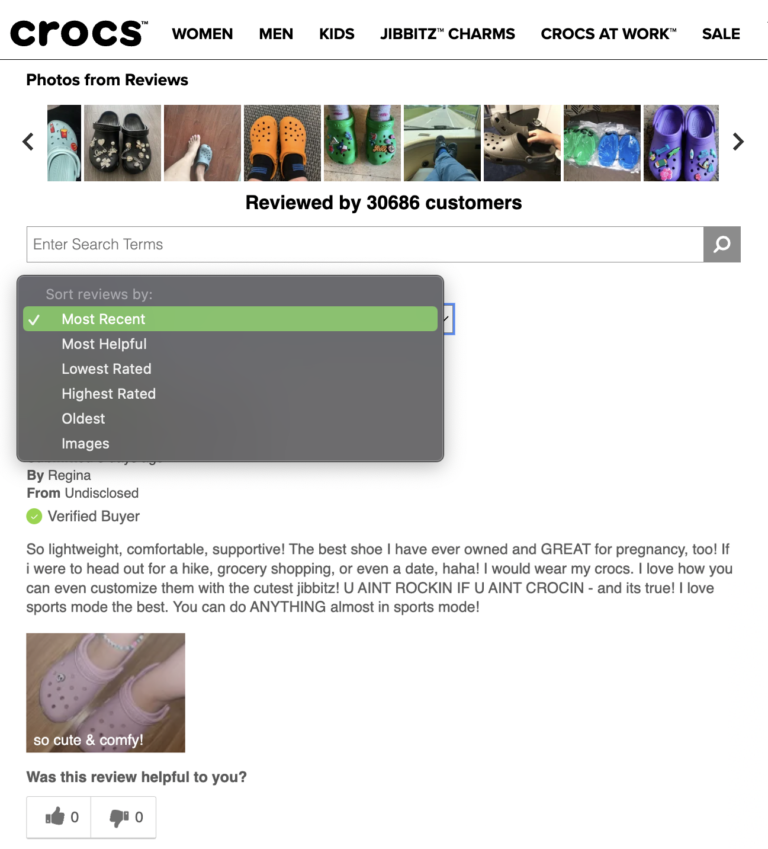
How Many Reviews Apparel and Footwear Shoppers Read
Approximately how many customer reviews do you typically ACTUALLY READ before purchasing a clothing or footwear item?
Overall
0
2%
1-25
66%
26-50
20%
51-100
7%
101-500
3%
501-1,000
1%
1,001-5,000
1%
5,000+
0%
Gen Z
1-25
66%
26-50
20%
51-100
7%
101-500
4%
501-1,000
2%
1,001-5,000
1%
5,000+
0%
Millennials
0
1%
1-25
65%
26-50
21%
51-100
7%
101-500
3%
501-1,000
2%
1,001-5,000
1%
5,000+
0%
Gen X
0
2%
1-25
67%
26-50
20%
51-100
7%
101-500
3%
501-1,000
1%
1,001-5,000
0%
5,000+
0%
Boomers
0
7%
1-25
72%
26-50
15%
51-100
4%
101-500
1%
501-1,000
1%
1,001-5,000
0%
5,000+
0%

Sizing Information in Reviews Can Fuel Better Purchase Decisions

As mentioned earlier in this report, size and fit is the top factor considered by apparel and footwear shoppers. Providing plenty of information on how a given product fits and feels is essential. 

One way apparel and footwear brands and retailers can do this is by asking customers to include measurement information (such as height and weight) when submitting reviews.

Then, they can display this information in the review – and shoppers can use it to find reviews from others with similar body types. Some brands and retailers even allow shorts to filter to see reviews written by those with specific heights or weights. 
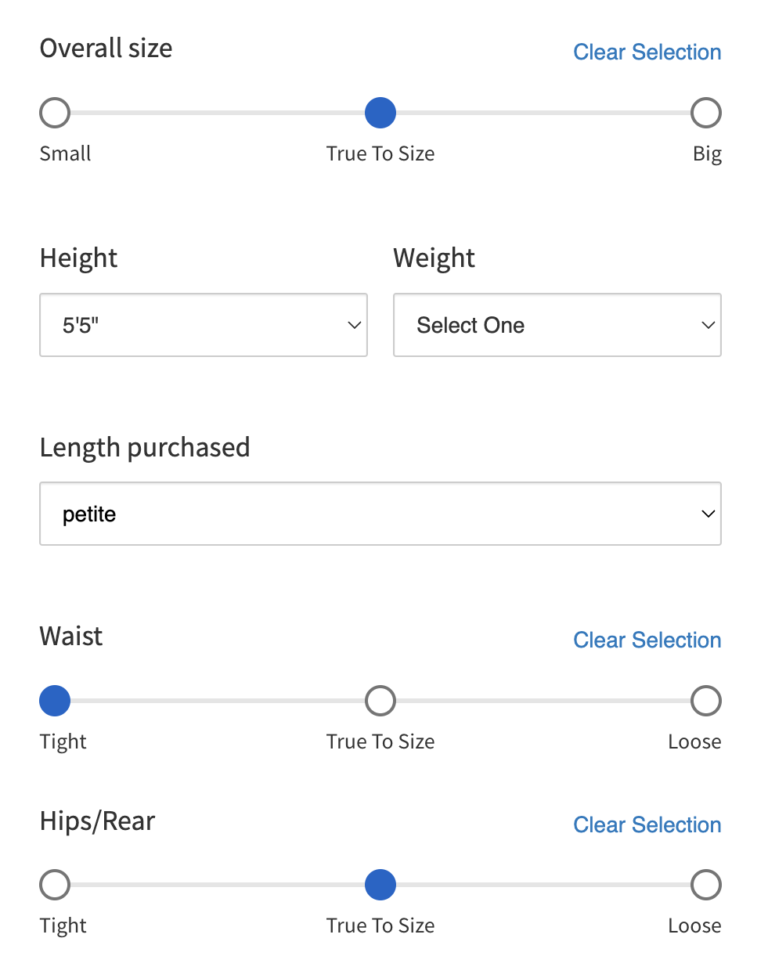
The vast majority (94%) of online apparel and clothing shoppers say they would find it helpful if there was measurement information about the individuals providing reviews, photos, and videos. This number is slightly higher – 96% – among Millennial and Gen Z shoppers. 

Apparel and Footwear Shoppers Value Sizing Information in Reviews
When it comes to sizing, do you or would you find measurement information (height, weight etc.) about the individuals providing the reviews and imagery/video when buying an apparel (clothing or footwear) item online helpful?
Overall
94%
Gen Z
96%
Millennials
96%
Gen X
92%
Boomers
84%

Including Information About Ownership Length in Reviews Can Help Shoppers Assess Quality and Durability

Earlier in this report, we explored how apparel and footwear shoppers weigh many factors when considering a purchase. Two of those factors are quality and durability. Just over three-quarters (76%) say that overall quality is an important factor, while 58% consider a product’s durability.

The true test of both quality and durability is how a product holds up over time. Knowing how long a consumer owned a product prior to writing a review can help future shoppers assess durability and long-term quality.

Most consumers (89%) would find it helpful to know the length of time an individual owned a product before submitting a review. Of note, insight into a reviewer’s ownership duration is especially valuable for younger shoppers.

Many Consumers Value Being Able to Determine How Long Reviewers Have Owned a Product
When it comes to durability and quality of apparel and footwear items, do you or would you find the length of time the individual providing the reviews had owned it helpful when reading them?
Overall
89%
Gen Z
89%
Millennials
90%
Gen X
88%
Boomers
82%
Chapter 8

The Value of Visual UGC for Apparel and Footwear Shoppers

Apparel Shoppers Depend on User-Generated Imagery

The vast majority – 96% – of consumers seek out photos and videos from other consumers when shopping for clothing online at least occasionally. Three-quarters do so always or regularly.

Gen Z and Millennial shoppers are the groups most likely to say they always seek out user-generated visual content when shopping for clothing online. 61% of Gen Z’ers and 52% of Millennials always do so, compared to 32% of Gen X’ers and 19% of Boomers.

Online Apparel Shoppers Frequently Seek out User-Generated Visual Content
How often do you seek out images and videos submitted by people who previously bought the product while shopping for CLOTHING online?
Overall
Always
45%
Regularly
30%
Sometimes
15%
Occasionally
6%
Never
4%
Gen Z
Always
61%
Regularly
24%
Sometimes
11%
Occasionally
3%
Never
1%
Millennials
Always
52%
Regularly
30%
Sometimes
12%
Occasionally
4%
Never
2%
Gen X
Always
34%
Regularly
33%
Sometimes
21%
Occasionally
7%
Never
5%
Boomers
Always
19%
Regularly
27%
Sometimes
23%
Occasionally
15%
Never
16%

Footwear Shoppers Also Value User-Generated Imagery

Those shopping for footwear online also turn to user-generated visual content to make informed purchase decisions. 95% of online footwear shoppers seek out user-generated photos and videos at least occasionally. 69% do so always or regularly.

Again, younger shoppers are more likely to indicate they always seek out user-generated photos and videos when shopping for footwear online. 57% of Gen Z’ers and 48% of Millennials say this is the case, compared to 31% of Gen X’ers and a mere 18% of Boomers. 

Online Footwear Shoppers Also Turn to User-Generated Photos and Videos
How often do you seek out images and videos submitted by people who previously bought the product while shopping for FOOTWEAR online?
Overall
Always
41%
Regularly
28%
Sometimes
18%
Occasionally
8%
Never
5%
Gen Z
Always
57%
Regularly
24%
Sometimes
12%
Occasionally
5%
Never
2%
Millennials
Always
48%
Regularly
28%
Sometimes
25%
Occasionally
6%
Never
3%
Gen X
Always
31%
Regularly
31%
Sometimes
22%
Occasionally
9%
Never
7%
Boomers
Always
18%
Regularly
25%
Sometimes
23%
Occasionally
16%
Never
18%
Chapter 9

Use of Q&A When Shopping for Apparel and Footwear

Consumers shopping online for clothing and footwear may have questions that aren’t covered in the product details page. And, unlike in-store shoppers, they’re not able to flag down a store associate to ask. 

How do online shoppers bridge the gap to get answers to their outstanding questions? Oftentimes, by consulting the questions and answers (Q&A) portion of the product page.

Most Online Apparel Shoppers Consult Q&A

The vast majority of consumers – 97% – read Q&A at least occasionally when shopping for apparel online. 64% do so much more frequently – either always or regularly.

In line with other survey results, younger shoppers are more likely to always consult Q&A than their older counterparts. 34% of Gen Z shoppers and 33% of Millennials always read Q&A when shopping online for apparel, compared to a quarter of Gen X’ers and 21% of Boomers. 

How Frequently Clothing Shoppers Read Q&A
How often do you read Q&A (questions submitted by other shoppers and answered by the brand and/or other shoppers) when shopping for CLOTHING items online?
Overall
Always
30%
Regularly
34%
Sometimes
25%
Occasionally
8%
Never
3%
Gen Z
Always
34%
Regularly
30%
Sometimes
25%
Occasionally
9%
Never
2%
Millennials
Always
33%
Regularly
33%
Sometimes
24%
Occasionally
7%
Never
3%
Gen X
Always
25%
Regularly
37%
Sometimes
26%
Occasionally
9%
Never
3%
Boomers
Always
21%
Regularly
34%
Sometimes
26%
Occasionally
12%
Never
7%

Consumers Read Q&A on Footwear Product Pages

Nearly all (97%) of consumers shopping for footwear online consult the Q&A section of product pages at least occasionally. 63% regularly or always do so.

Not surprisingly, younger consumers consult Q&A more frequently than older shoppers. 

How Frequently Footwear Shoppers Read Q&A
How often do you read Q&A (questions submitted by other shoppers and answered by the brand and/or other shoppers) when shopping for FOOTWEAR items online?
Overall
Always
30%
Regularly
33%
Sometimes
25%
Occasionally
9%
Never
3%
Gen Z
Always
35%
Regularly
29%
Sometimes
23%
Occasionally
11%
Never
2%
Millennials
Always
33%
Regularly
32%
Sometimes
24%
Occasionally
8%
Never
3%
Gen X
Always
26%
Regularly
36%
Sometimes
25%
Occasionally
9%
Never
4%
Boomers
Always
21%
Regularly
34%
Sometimes
25%
Occasionally
12%
Never
8%
Chapter 10

The Prevalence of Apparel Returns – and the Key Reasons Behind Them

Returns have always been a thorn in the side of brands and retailers. But the rise in ecommerce has further amplified the problem – especially for apparel and footwear brands and retailers.

Most Online Shoppers Make Apparel and Footwear Returns

Of those who have made a clothing or footwear purchase in the last 90 days, over half (54%) have made a return. Interestly, Millennials are the age group most likely to make apparel returns, and Boomers are the least likely. 

Apparel and Footwear Returns are Very Common Across All Age Groups
Have you returned apparel (clothing or footwear) you purchased online in the past 90 days?
Overall
54%
Gen Z
55%
Millennials
58%
Gen X
51%
Boomers
40%

Another interesting observation is that the higher a shopper’s income, the more likely it is that they’ve made an apparel or footwear return in the last 90 days. A likely explanation is that those with higher incomes spend more – and thus have more merchandise to return.

Higher Income Shoppers are More Likely to Return Apparel and Footwear
Have you returned apparel (clothing or footwear) you purchased online in the past 90 days?
$0-$25,000
38%
$26,000-$50,000
44%
$51,000-$75,000
50%
$76,00-$100,000
58%
$101,000-$250,000
65%
$251,000+
73%
Prefer not to say
57%

Apparel Shoppers Return Merchandise for Many Reasons

Apparel returns are prevalent. But why are shoppers returning the clothing and footwear they purchase online?

Most of the top reasons are related to a product failing to meet the shopper’s expectations. Over a third (39%) have returned a product because they didn’t like the sizing, and 29% have done so because the item didn’t look the way they thought it would. 

Top Reasons Apparel Shoppers Return Merchandise
If you have made a return in the last 90 days, what were the reasons?
I didn’t like the sizing
39%
Item didn’t look like I thought it would
29%
Item didn’t match the description
14%
I bought different sizes of the same item and returned those I didn’t like
14%
Item damaged or defective
11%

Though returns will never be completely eliminated, apparel brands and retailers can drastically reduce them by providing accurate product descriptions and sizing information, as well as reviews and photos from existing customers that speak to size and fit and help shoppers get a more realistic picture of what to expect from a product (check out our complementary report Returns in Retail for more).

Chapter 11

Key Takeaways for Apparel Brands and Retailers

The way consumers shop for apparel and footwear is evolving. Apparel brands and retailers must adapt their strategies to more effectively attract, convert, and retain modern apparel customers – whether they’re shopping online, in-store, or both. 

Based on our research, here are six key takeaways for apparel brands and retailers. 

One
Online Apparel Shopping is Growing – But Brick-and-Mortar is Still Relevant

Many consumers are spending a growing portion of the clothing and apparel budgets online – a trend that has ramped up since the start of the pandemic. Over half (51%) of consumers spend more money on apparel products online now than they did before the pandemic. Gen Z and Millennial shoppers are even more likely to have ramped up their online apparel spending.

That said, apparel brick-and-mortar continues to thrive, especially for specific apparel categories including formal clothing and footwear and business clothing and footwear, among others. 

In order to compete and win, apparel brands and retailers must focus on delivering engaging, seamless experiences – regardless of whether their customers shop online, in-store, or a combination of the two. 

Two
Reviews are the Second Most Important Thing Apparel Shoppers Look for – Only Behind Price

There are certain things apparel and footwear shoppers look for when making a purchase decision. Ratings and reviews are #2 on the list, behind price. In fact, nearly all consumers read ratings and reviews when shopping for clothing and footwear products.

65% of consumers pay attention to the quantity of reviews available for a given apparel or footwear product, so brands and retailers must make it a priority to generate a high volume of reviews for all products in their catalogs. Nearly half (42%) want to be able to find 101 or more reviews for a given product. 

What’s more, our analysis found that the more reviews an apparel product has, the larger the impact on conversion. While there’s a 65.5% lift in conversion among those exposed to between one and 100 reviews, there’s a 179.7% lift when apparel shoppers are exposed to 5,000 or more reviews. 

However, it’s important to remember that while consumers ideally want to find a high volume of reviews, they’re actually reading far fewer. Be sure to include filtering, sorting and search capabilities in your review display so shoppers can quickly surface the content that speaks to what matters most to them.

Three
Most Apparel and Footwear Shoppers Depend on User-Generated Visual Content to Make Better Purchase Decisions

Brand-provided imagery is important. But increasingly, apparel and footwear shoppers specifically want to see photos and videos from other consumers who have already purchased a specific product. 96% of consumers seek out user-generated imagery when shopping for clothing online at least occasionally. That number is just slightly lower – 95% – when consumers are shopping for footwear.

If you’re not already, start collecting visual content from your shoppers – both natively and through social media. Then, showcase this content on your product pages and throughout your website. This imagery will help shoppers better access size and fit and get a better idea of what a product looks like in “real life.” And this is a sure way to increase conversion. A previous analysis found that there’s a 106.3% lift in conversion when visitors interact with user-generated visual content on a product page. 

Four
Q&A Can Boost Shoppers’ Confidence – and Their Likelihood of Making a Purchase

It’s not uncommon for online apparel and footwear shoppers to have questions that aren’t addressed in the product description. Many turn to the Q&A portion of product pages to get answers. Our survey found that 97% of consumers read Q&A at least occasionally when shopping for both clothing and footwear online. 

Be sure to include a Q&A section on your apparel and footwear product pages. Being able to browse existing questions and post their own will boost shoppers’ confidence – and purchase probability. Our recent analysis found that there’s a 194.2% lift in conversion among visitors who interact with Q&A content. 
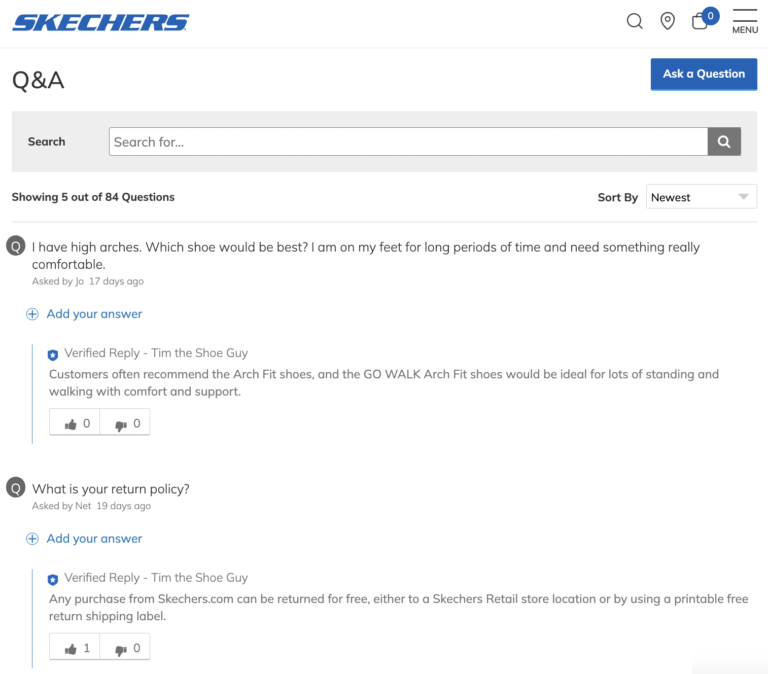
Five
Many of the Top Reasons for Apparel and Footwear Returns Can Be Greatly Reduced with UGC

Apparel and footwear brands and retailers are all too familiar with product returns. While consumers return apparel products purchased online for many reasons, a few that rise to the top include issues with sizing (39%), an item not looking as they expected (29%), and an item not matching the description (14%).

One way to decrease these issues is to revisit your product descriptions on a regular basis to ensure they’re as clear and accurate as possible. Another way to reduce returns is to collect and display plenty of user-generated content. Reviews and visual content allow shoppers to get a feel for what a product is like in real life, which will provide more realistic expectations. What’s more, when brands display a customer’s sizing information alongside their review or visual content, it can help future shoppers get a better idea of what size would work best for them.
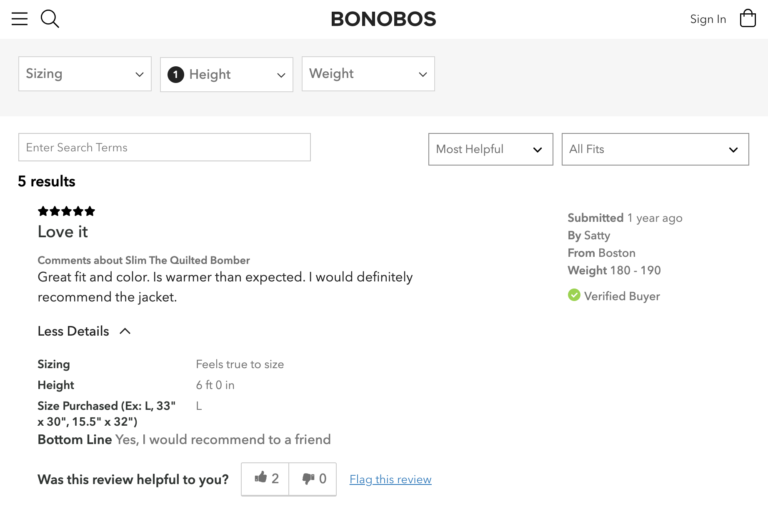
Six
Continuous Measurement and Optimization is Essential

One thing is for sure: modern apparel and footwear shoppers depend on user-generated content. As such, apparel brands and retailers must focus on generating and displaying plenty of this content.

But don’t put your UGC program on autopilot. Instead, measure the performance of your UGC collection and display strategies on a regular basis. By doing so, you can uncover opportunities to optimize your program – and generate an even higher return.
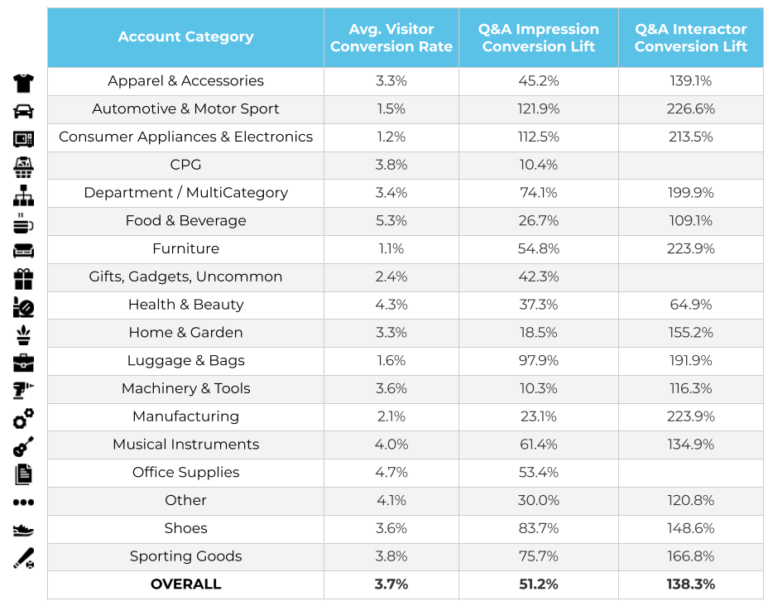
A Q&A Impression Lifts Conversion by 51%, While a Q&A Interaction Lift Conversion 138%

Key Findings:

  • Across verticals, the conversion lift for visitors who encountered Q&A content was 51.2%, showing that the mere presence of Q&A can positively impact conversion. 

  • When visitors interact with Q&A content, however, the impact is much higher. Interacting with Q&A leads to a 138.3% conversion lift, on average, across verticals.

  • The verticals with the highest Q&A visitor conversion lift were Consumer Appliances & Electronics; Automotive & Motor Sport; and Luggage & Bags. 

  • The verticals with the highest Q&A interactor conversion lift include Automotive & Motor Sport; Furniture; and Manufacturing.

Methodology: Analysis of consumer UGC interaction across 25.4MM+ online product pages on 3,600+ brand and retailer sites in the previous 12 month period prior to June 28, 2022.

All three forms of UGC — ratings and reviews, Q&A, and user-generated imagery — have a positive impact on conversion. However, Q&A has always reigned supreme as having the largest impact on conversion.

In 2021, there was a 194.2% lift in conversion among visitors who interacted with Q&A content, up significantly from the 157.1% conversion lift reported in 2020. Perhaps more than any other type of UGC, Q&A content bridges the gap from the in-store to online shopping experience, enabling shoppers to find answers to the questions they would have asked a retail associate, but from the comfort of their own home.

Given the high conversion impact of Q&A content, we analyze the conversion impact across different verticals. In our analysis, we looked at both the conversion lift by visitor (those who saw review content on the product page they visited) and Q&A interactor (those who interacted with review content on the page they visited). We’ve also shared the average conversion rate for each vertical as a baseline.

The verticals with the highest Q&A visitor conversion lift were Automotive & Motor Sport (+121.9%), Consumer Appliances & Electronics (+112.5%), and Luggage & Bags (+97.9%). Interestingly, Automotive & Motor Sport (+226.6%) also enjoyed the highest conversion lift from visitors interacting with Q&A content. With a Q&A interactor conversion lift of 223.9%, the Furniture and Manufacturing verticals tied for second place.

Across verticals, the conversion lift for visitors who encountered Q&A content was 51.2%, showing that the mere presence of Q&A can positively impact conversion. When visitors interact with Q&A content, however, the impact is much higher. The average conversion lift for Q&A interactors was 138.3% across verticals.

Five Snackable Data-Backed Q&A Display Tips

  1. Make it easy to ask a question. Many brands and retailers allow users to submit a question up at the top of the product page, as well as down in the Q&A section itself. This is a smart move, as visitors who click to ask a question have a conversion lift as high as 139.3%. 

  2. Put your Q&A front and center. You want to highlight your product features, of course, but don’t bury your Q&A section. One in four consumers say they are less likely to purchase a product if there isn’t a Q&A section on the product page. This number is even higher — 33% — among Gen Z shoppers. 

  3. Answer quickly. When shoppers ask a question on a product page, they expect a fast response. 56% expect to get an answer within 24 hours, and 21% expect an answer in four hours or less. Dedicate a team member (or two, or three) to responding to Q&A as they come in.

  4. Crowdsource answers. Your existing customers are product experts, so enable them to answer questions too. Plus, our previous research found that 94% of shoppers value answers to answers that are posted by verified buyers who have already purchased the product in question – compared 45% for answers from the brand or retailer.

  5. Encourage voting. If a shopper finds a response to a previous customer’s question to be particularly helpful, they might opt to tap or click a “like” button. These ratings allow people to sort through the best of your Q&A – and those who click the helpful icon convert at a rate that’s 192.9% higher than average.
  6.  

More Benchmarks

Sorry, we couldn't find any posts. Please try a different search.
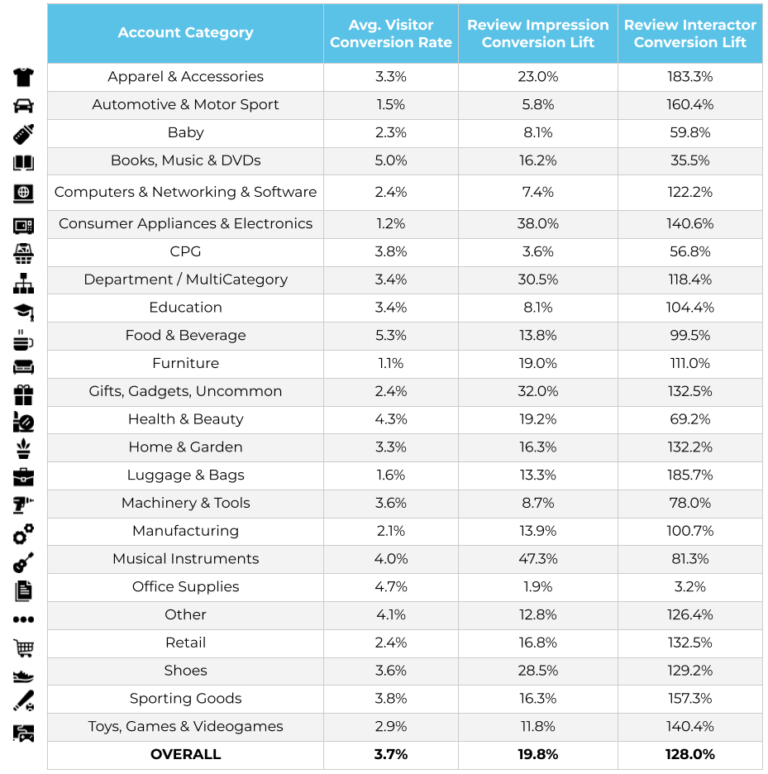
Simply Seeing Reviews Lifts Conversion by 20%, While Interacting With Reviews Lifts Conversion by 128%

Key Findings:

  • Across verticals, the conversion lift for visitors who are served review content was 19.8%, showing that the mere presence of reviews can positively impact conversion. 

  • When visitors interact with review content, however, the impact is much higher. Interacting with reviews leads to a 128.0% conversion lift, on average, across verticals.

  • The verticals with the highest review visitor conversion lift were Musical Instruments; Consumer Appliances & Electronics; and Gifts, Gadgets, & Uncommon Products. 

  • The verticals with the highest review interactor conversion lift include Luggage & Bags; Apparel & Accessories; and Automotive & Motor Sport.

Methodology: Analysis of consumer UGC interaction across 25.4MM+ online product pages on 3,600+ brand and retailer sites in the previous 12 month period prior to June 28, 2022.

Ratings and reviews have become the most important factor impacting purchase decisions, ranking above price, free shipping, brand and recommendations from family and friends. In fact, reviews influence a shopper’s decision to convert to such an extent that those who interact with ratings and reviews convert at a rate that’s 108.3% higher – according to our analysis throughout 2021. 

Given the high conversion impact of ratings and reviews, we sought out to analyze the conversion impact across different verticals. In our analysis, we looked at both the conversion lift by visitor (those who saw review content on the product page they visited) and review interactor (those who interacted with review content on the page they visited). We’ve also shared the average conversion rate for each vertical as a baseline.

The verticals with the highest visitor conversion lift were Musical Instruments (+47.3%), Consumer Appliances & Electronics (+38.0%), and Gifts, Gadgets, & Uncommon Products (+32.0%). Interestingly, these all differ from the product verticals that enjoyed the highest conversion lift from review interactors, which include Luggage & Bags (+185.7%), Apparel & Accessories (+183.3%), and Automotive & Motor Sport (+160.4%).

Across verticals, the conversion lift for visitors who encountered review content was 19.8%, showing that the mere presence of reviews can positively impact conversion. When visitors interact with review content, however, the impact is much higher. The average conversion lift for review interactors was 128.0% across verticals (higher than the previously mentioned number for 2021).

Five Snackable Data-Backed Review Display Tips

  1. Make your review display pop. Use your brand’s brightest, most clickable color to show off your review stars, and ensure your review display is easy to navigate and click. You want to invite engagement to enjoy that conversion lift. 

  2. Encourage review voting. Overwhelmingly, customers who interact with the Helpful voting feature on reviews have the highest conversion rate of all review interactors. There’s a 414.3% lift in conversion among visitors who click the thumbs up icon on a review, and a 292.9% lift in conversion among visitors who click the thumbs down icon.

  3. Enable review search. Make it easy for shoppers to find the keywords they’re searching for with review search. Visitors who interact with the review search feature experience a 260.7% lift in conversion.

  4. Use pagination in your review footer. Many visitors scroll to read through at least the first full page of review content. Allow them to sit and read for a while with buttons that let them toggle back and forth between reviews, or go back to where they started. Clicking the Previous button in the review footer has a 242.9% lift in conversion, while clicking the Back to Top button has a 178.6% lift in conversion.

  5. Make your review snippet clickable. We call the high-level review data at the top of a product page (star rating and review count) the review snippet. When visitors click on this, they’re taken to the full review display, where they can read individual reviews, as well as sort and filter content to find what’s most relevant to them. There’s a 164.3% conversion lift among consumers who click the review snippet.
  6.  

More Benchmarks

Sorry, we couldn't find any posts. Please try a different search.