If you’re like us, you’re savoring every last minute of summer. But we all know the holidays are just around the corner, and it’s time to start planning. There are emails to draft, product catalogs to update, and sales to promote. As marketers, there’s no shortage of things on your to-do list.  

However, considering 70% of shoppers won’t even buy products online before reading reviews, your holiday UGC strategy should undoubtedly be on that list.

UGC in the 2020 Holiday Season

And UGC will be even more important this Holiday season. The focus on ecommerce this year has been widely publicized. Our Holiday Survey conclusively backs this up: 64% of the 5,000+ consumers we surveyed say they will do more shopping online this year than last. And what’s more, 83% of those who expect to increase their overall holiday spend this year will do more of that shopping online than in previous years.

In this environment, ratings and reviews will be critical to converting browsers to buyers. In fact, our survey also reveals that 37% say ratings and reviews will be more important this year than last (61% say they will be of equal importance, only 2% say they will be less important).

You need to be ready for this. You will make more money online this year than ever before. There is no doubt of that. But in order to maximize your share, UGC will be absolutely critical.

How to ensure you’re ready for Holiday 2020

As someone who works with leading brands and retailers on their UGC strategies day-in day-out (and has worked through my fair share of holiday seasons), I wanted to share some helpful recommendations for optimizing your ratings and reviews program at this time of year.

There are four areas we’ll focus on to get you ready for your best holiday season yet:

Optimize Your Review Collection Methods

The holidays are a big sales season. That means you can expect to see a surge in reviews (especially if you follow these best practices!).

Now is a good time to audit your review collection processes and consider if there are any improvements you can make — before the holidays are in full-swing.

Review Your Review Form

Take a look at your review form. 

Is there some type of feedback you are looking to collect for specific products that you aren’t currently gathering? 

The holidays are the perfect time to edit your review form as your review volume will be increasing. Instead of just comments and an overall star rating, ask additional questions specific to your product or consumer to get more detailed feedback. 
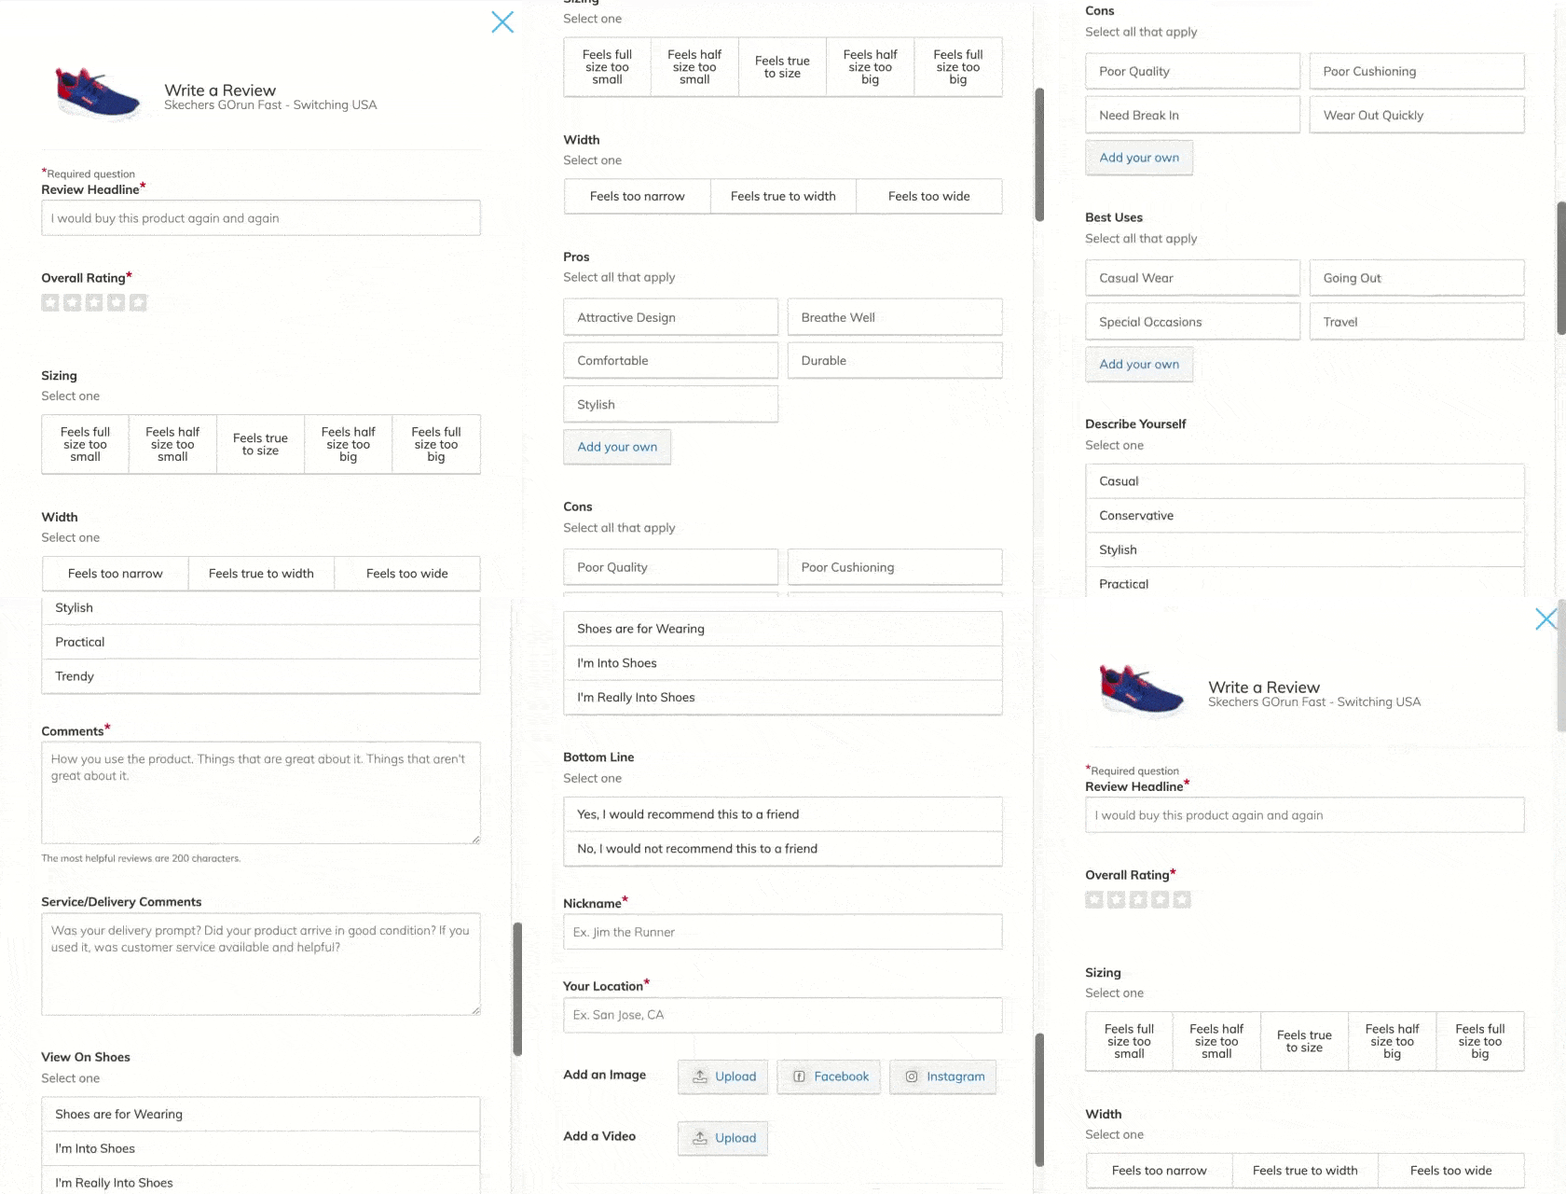
Are you currently collecting images and videos on your review form? 

If visual content strategy is going to be a focus for 2021, you might want to start! Our consumer survey found that 88% of users want to see more user photos and videos. When just one image is added, it can increase conversion as much as 69%. 
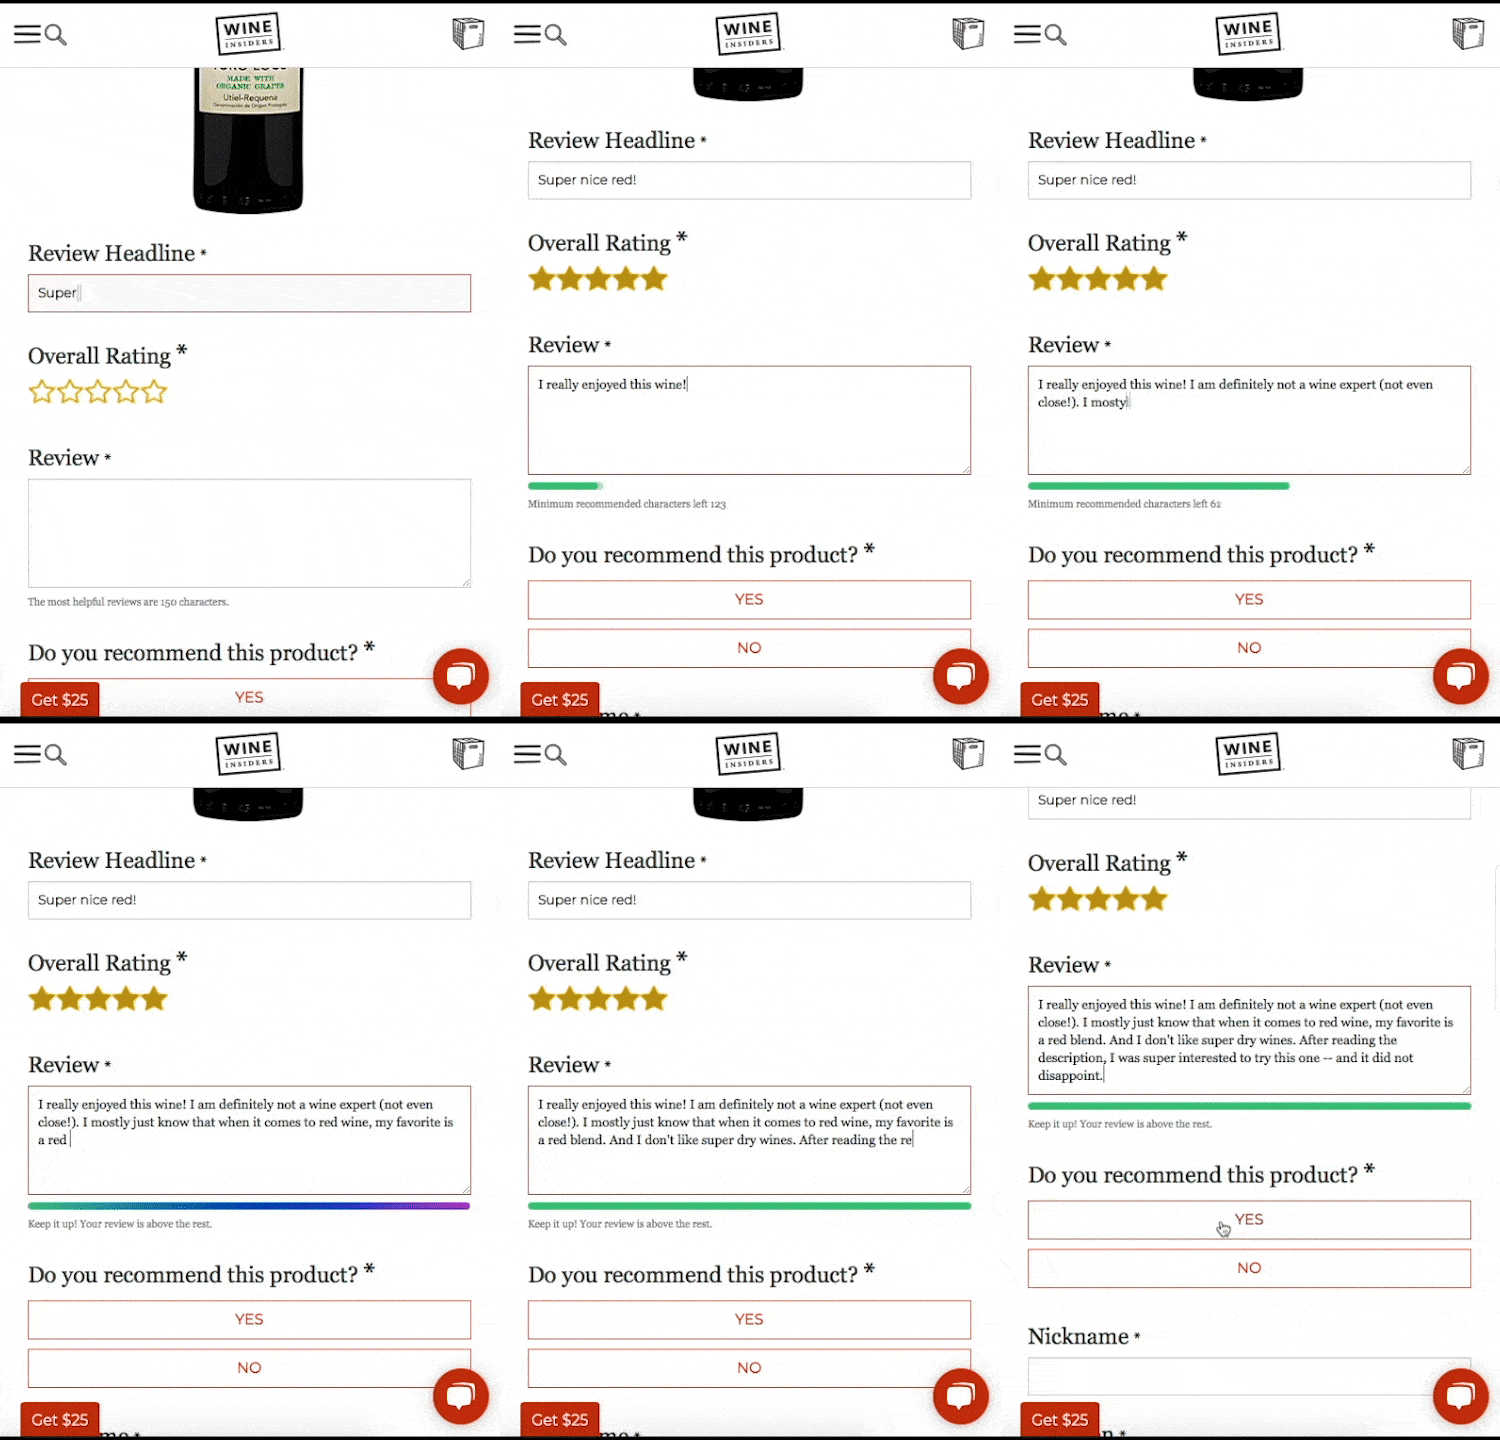
Would you like your reviews to be longer? 

Based on our own review interaction data (taken from an analysis of 1.5m+ product pages across 1,200+ brand and retail sites), longer reviews are more likely to receive “helpful” ratings by consumers. Consumers who engage with “helpful” reviews convert at higher rates than those who engage with any old review.

Consider Your Post-Purchase Email Strategy

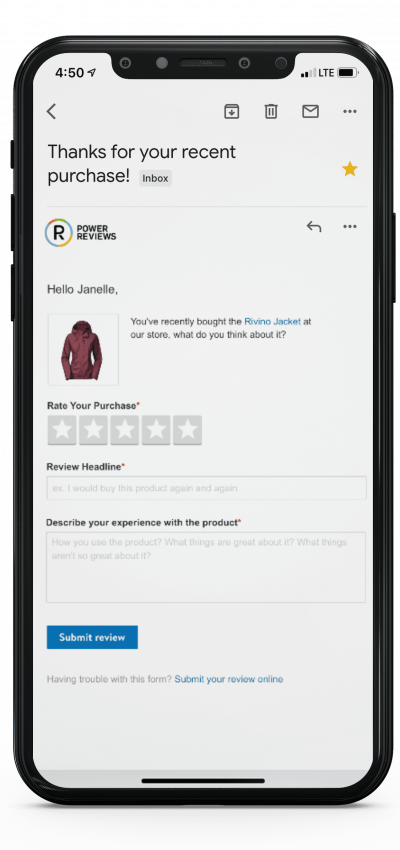
Your shoppers’ email inbox is the perfect place to gather new reviews. If you aren’t currently, follow up with customers soon after they receive their purchases, and ask them to write a review, with a link to your review channels.

People can get busy during the holidays. Make your shoppers’ lives easier by inviting them to submit their review right from the email itself (for PowerReviews customers, our In-Mail Submission enables customers to provide review content directly within review invitation emails).
inmail-review
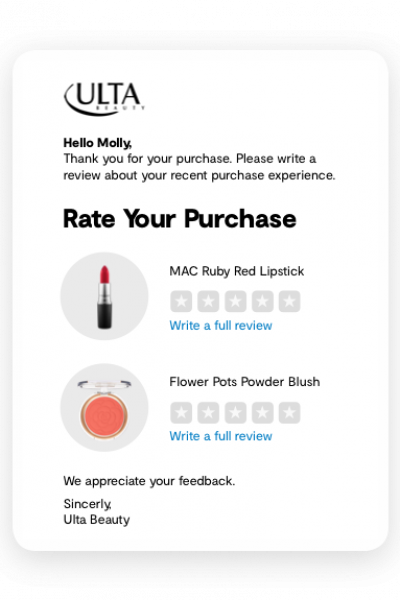
Ulta Post Purchase Email

What about customers who purchase multiple gifts from you?

You can make their lives easier, too. Invite them to write multiple, shorter reviews all at the same time. 

For example, our Review Your Purchases feature lets customers write multiple product reviews on one form through the post-purchase email. These reviews collect the star rating, headline, review comments, and an image or video for multiple products from a single email.

We’ve seen exceptional results from clients who implemented Review Your Purchases — one client saw a 54% increase in collection in just 30 days!

Share Reviews Across Channels

Once you’ve taken care of reviews on your own website, consider how you can grow your review coverage across other websites and social media.

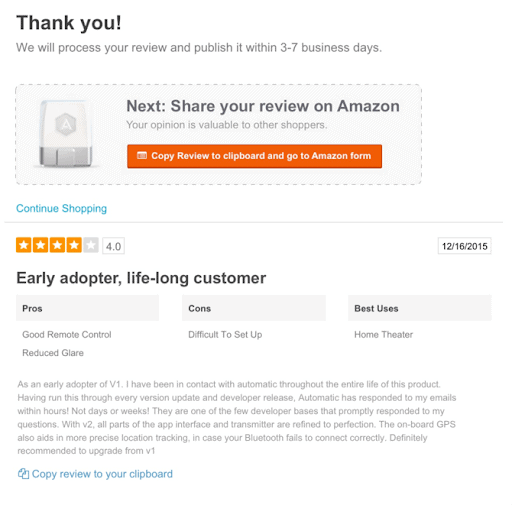
Do you sell your products on Amazon? 

How are you currently funneling your customers to write reviews? Ideally, you should provide them with an option to replicate their review content to your product pages on Amazon.com too (for example, our Share Button makes this whole process super easy. On average, 31% of customers click this button. That’s a lot of reviews!)
How about social media? 

60% of online shoppers discover new products through Instagram alone. It’s therefore super important that you enable your customers to share review content to this social platform and beyond (we do this through our “Share to Social” button, which quickly syndicates to Facebook, Twitter and Pinterest). This ultimately increases the reach of your UGC, driving organic traffic to your product pages, and boosting your conversion rates. We track clicks and coverage so you can measure impact.

Increase Review Content

With your review collection methods all in order, it’s time to drum up more reviews — and all the sales that come along with them! Engage your followers on social media and leverage your email list to collect more reviews. Here are a few creative ideas to get you started. 

Generate Reviews Through Social Media

Have you considered asking for reviews on Facebook, Instagram or Twitter? 

You may already have a community of engaged followers across your social channels, so why not ask these customers to write reviews for specific products?
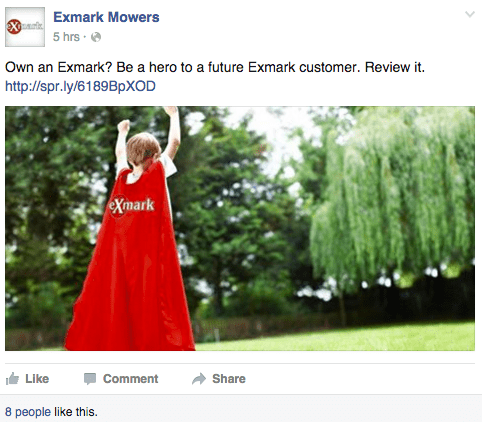
Taking that a step further, do you have customers who are already raving about your products on social? Lucky you! Rather than simply responding with a generic “Thank you, we’re glad you loved it,” why don’t you point the happy customer directly to your website to write a review? They are clearly impressed with your product, so this is the perfect opportunity to gather a positive review!

Ask for Reviews Through Other Emails

Do you plan to highlight specific holiday products within your newsletters or other marketing communications? 

If so, we recommend embedding your review form (or link) within these communications. This is especially impactful for non-eCommerce sites that are unable to send a post-purchase email. You could also highlight a product with low review volume to increase coverage prior to the holiday.

Screen Shot 2019-06-13 at 10.21.10 AM

Host a Review Contest

We have had many clients find success with creating and promoting a giveaway contest to collect reviews. In this example, Bumble and Bumble offered ten $100 gift cards for customers who wrote a review within a specific time period. All the customer had to do was sign into their account and submit a review on any product that they’ve used. 

Once the contest was over, Bumble & Bumble was able to use our reporting to identify customers who had written a review within that time period, and they picked the winner randomly with that data. This specific campaign increased review collection by 1400% month over month.

Get More Out of Your Holiday Reviews

You want to be prepared once the reviews start flowing in. Bring your customer service team up to speed on review moderation best practices. Identify key opportunities to feature top-rated products on your site banners and gift guides during the holidays. Finally, amplify the impact of your existing reviews content through email marketing and social channels.

Let’s start with moderation best practices.

Respond to Reviews

Always respond to reviews, positive or negative.

This simple task builds credibility with shoppers by demonstrating you care about what they have to say.

Remember, negative reviews aren’t all bad. Our research shows 44% of Centennials (ages 13-18) would not trust a product that had no negative reviews. In fact, 60% of Centennials read negative reviews first.
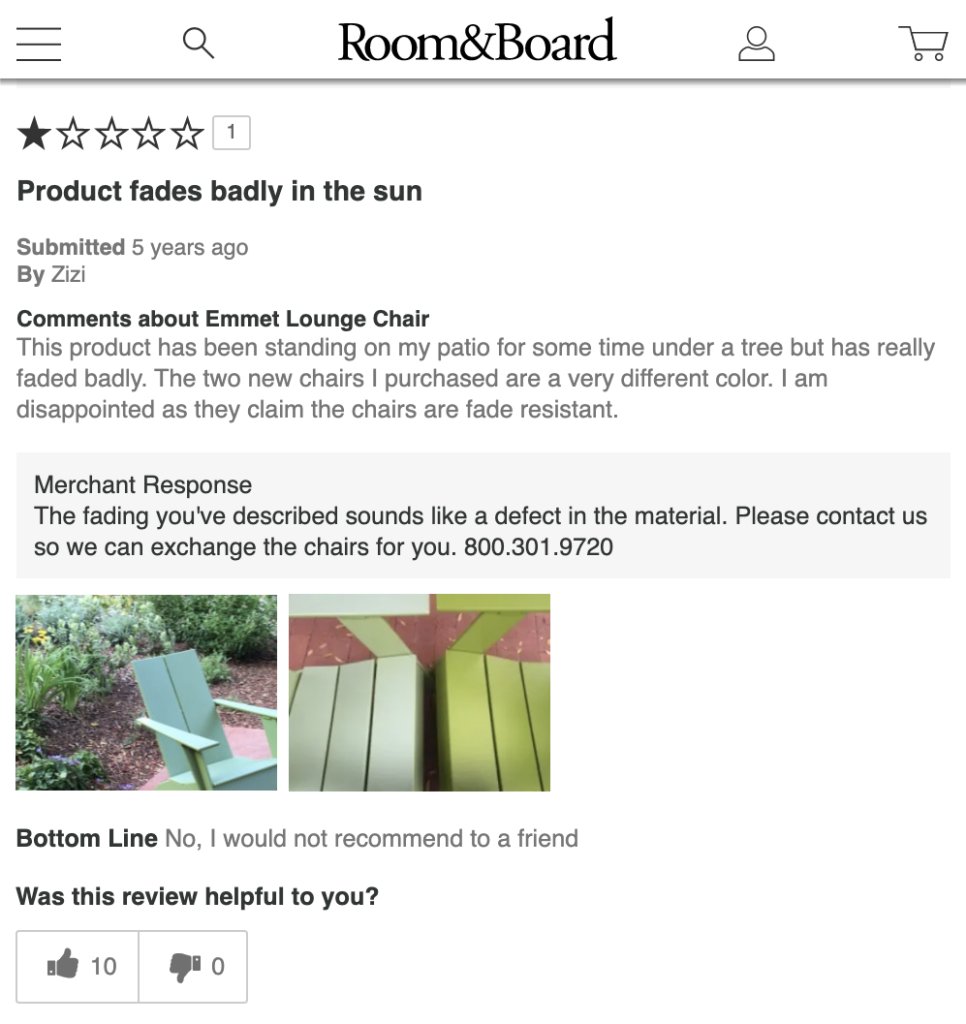
Customers know things can happen. Something broke during shipping, or the wrong item was sent. What’s more important to them is how you deal with it. Your review response is the place to share that information. Showing customers that you are there to support them and make it right is just as powerful as the experience with the product.
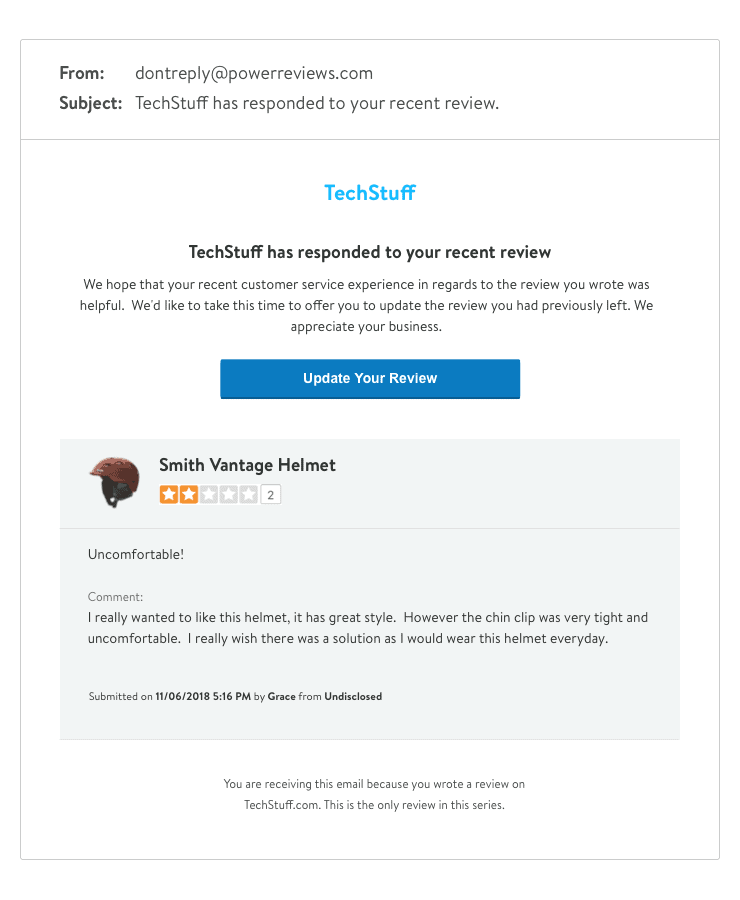
By responding to your reviews, you have the opportunity to turn a negative experience into a positive. Then, you can ask customers to update their review.

Leverage Your Review Content

By now you’ll have tons of positive reviews coming in, so put them to good use!

You can include star ratings and review quotes in your Instagram posts throughout the holidays. 
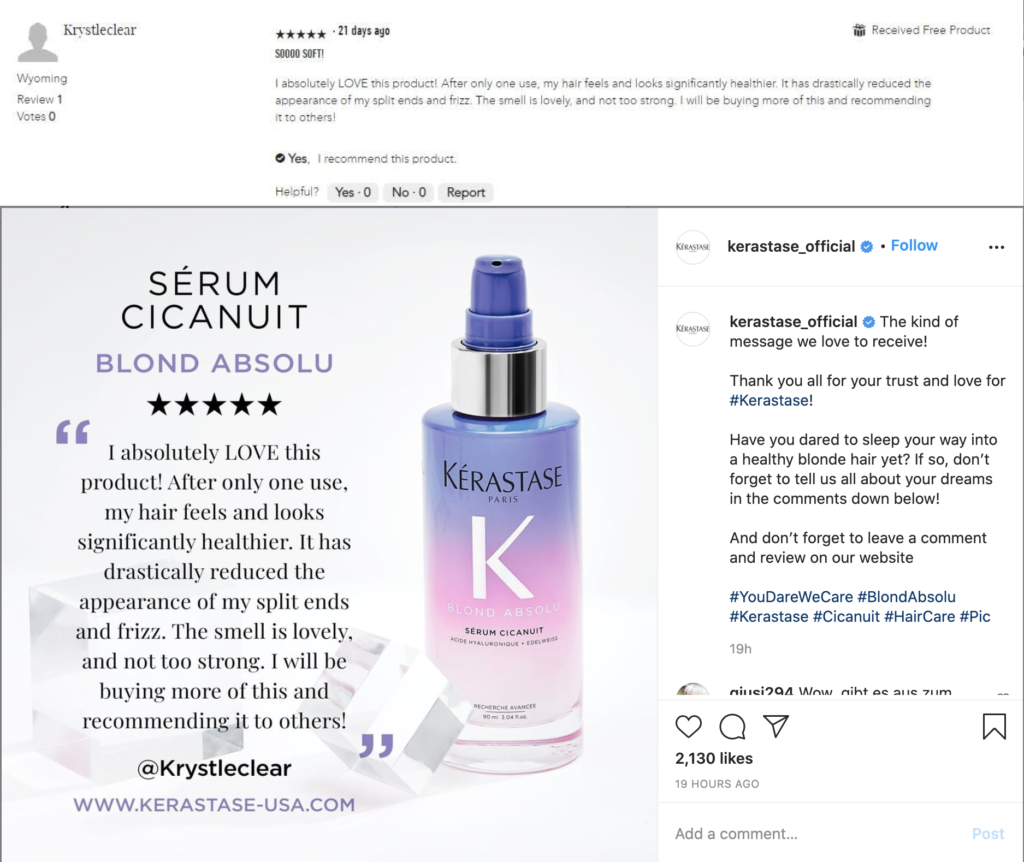
You can also highlight reviews in your marketing emails as customer testimonials.

Screen Shot 2020-06-18 at 2.41.43 PM

Gather Post-Holiday Insights

Now that you’ve made it through the holidays, I’m sure you are ready for a much needed vacation but don’t head to a tropical beach just yet. We’ve got some essential things for you to consider when planning for the New Year.

Your holiday reviews are chock full of useful customer feedback and sentiment. You want to gather this content so you can share it with your internal teams for product enhancements, marketing, and more. 

At a minimum, we recommend looking at:

Rated 4.5 out of 5
4 & 5 star reviews
These can supply your product managers and marketing team with sound bites to leverage in campaigns.
Rated 1.5 out of 5
1 & 2 star reviews
These can alert customer service and product development teams about common issues and complaints.

As you’re reading through your reviews, make notes of any trends in customer sentiment. Which products get the best (or the worst) reviews? Are any products having a harder time generating reviews, despite having similar sales numbers to other, more-reviewed products? If you made changes to a product during the holiday season, did it affect the reviews positively or negatively? 

Don’t forget your competition. Take time to review your competitors’ reviews, too. For similar products, how do your reviews match up against the competition? Is there anything you can learn from how your competitors respond to their reviews? 

When you’ve got thousands, hundreds — or heck, even dozens — of products, it can be tough to answer these questions without turning it into a full-time job. As you head into the next year, it might be time to consider looking into reviews analytics software. These platforms use AI to analyze reviews at scale, deliver competitive insights, and spin up smart, actionable reports for you to use when crafting your UGC success plan for 2021.
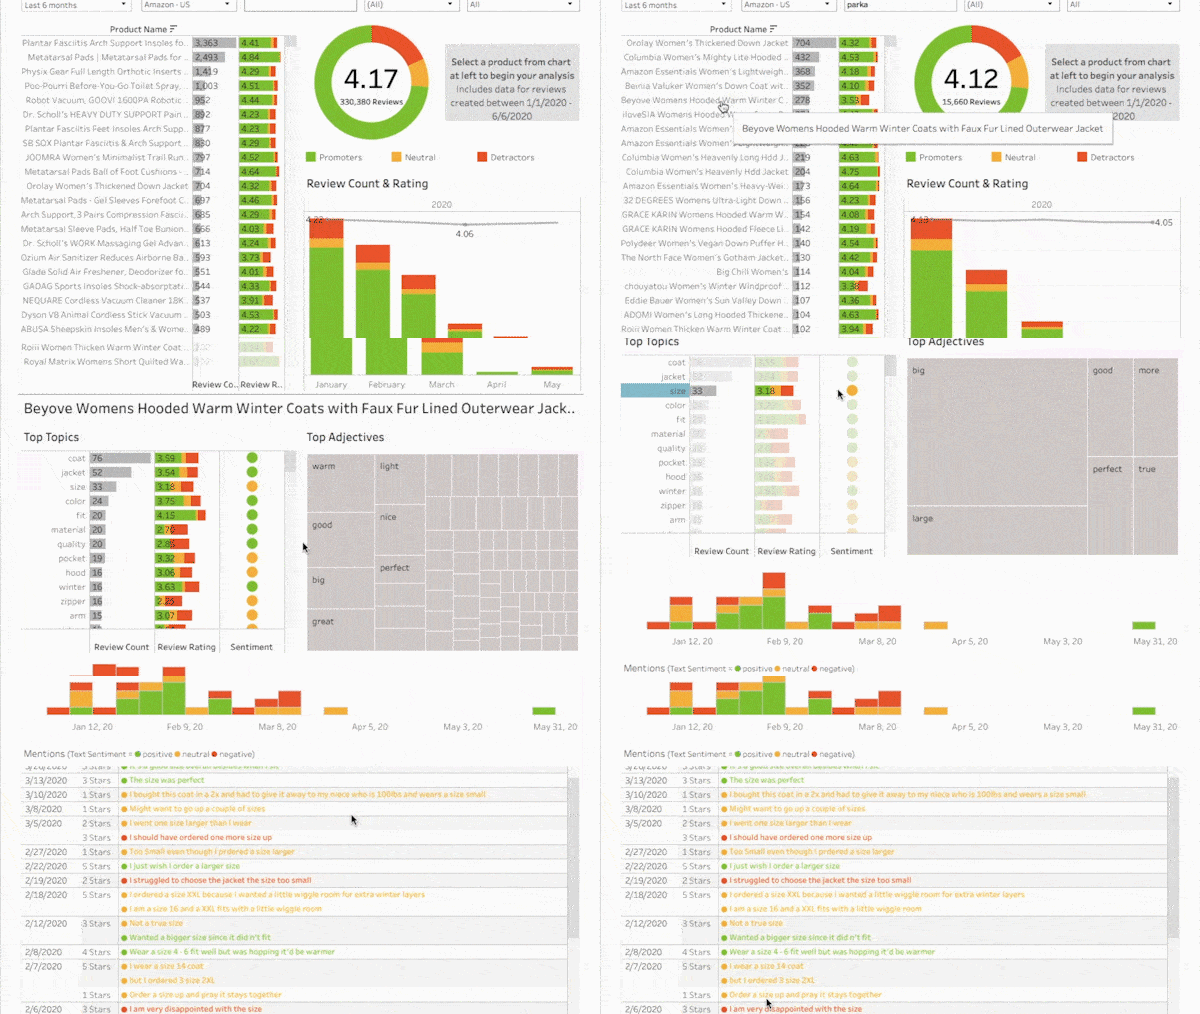
If you’re a PowerReviews customer, talk to your Customer Success Manager about your goals and objectives for UGC in 2021. We can be a partner throughout this process.

jakob-owens-o0OnkkvJHrg-unsplash
Wrapping Up

We hope that these UGC best practices were informative and will help you to prepare for the holidays. Start by reviewing your review collection methods now. Then work on generating reviews before and throughout the holiday sales season. Finally, gather actionable insights you can apply to next year’s goals.

Good luck this holiday season. We wish you happy holidays, and lots of positive reviews!
Kelli Seaquist

Kelli manages the Enterprise Customer Success team at PowerReviews. Over the past four years, she has worked with our largest brands and retailers to provide strategic recommendations for collecting, analyzing, and leveraging user-generated content. Her passion for ratings and reviews has truly helped her thrive at her number one hobby: online shopping. Seriously, she rarely has to return a purchase!

This is the sixth edition of our monthly snapshot (most recent versions here and here), originally established to assess the impact of the coronavirus pandemic on consumer behavior. This is our September version of the same report, analyzing consumer activity across more than 1.5MM online product pages from more than 1,200 retail/brand sites.

This time, we focused on a six-month period (starting February 24 2020 and ending August 23 2020). Each report, we specifically analyse review submission levels, review length and sentiment, overall conversions/sales volumes and review consumption (both absolute and among those who go onto purchase).

After some unprecedented and drastic extremes were evident over the course of March through May, we experienced continued stabilization for the third month running. We’ve been talking about a “new normal” for some time now in these reports, and we are only seeing continued confirmation of that trend.

Key ecommerce market trends

01

Ecommerce purchase volumes and site traffic now consistent for a full quarter

02

Review submission volumes now consistent with pre-pandemic levels

03

Reviews still converting more shoppers to buyers than before pandemic

Ecommerce purchase volumes and site traffic consistent for a full quarter

COVID has had a huge impact on consumer behavior, with unprecedented growth in ecommerce purchase volumes at the start of the pandemic. We consistently saw 3x increases in purchase volumes during April and May. However, for the last three months, we have seen continued stabilization.

Consumer behavior is clearly becoming more predictable, with purchase volumes consistently consistently at around 1.5x to 1.75x where they were at the start of the pandemic during this period.

Why? Most likely because the entire population has settled into a “new normal”. People are no longer buying in the bulk they were because they have confidence in supply chain and product availability. They know they will be able to source whatever items they need at short notice.

Traffic and purchase volumes stable for third month running

Review submission volumes now consistent with pre-pandemic levels

After reporting a giant 2.3x leap in review submission levels from April to May, we highlighted a slight drop over the past two months. This continued to the point where levels are now consistent with what we saw pre-pandemic.

This is most likely because consumers have now got to the point where they are no longer buying items they hadn’t tried before. Instead, they now have established product preferences so are less inclined to be motivated to submit reviews.

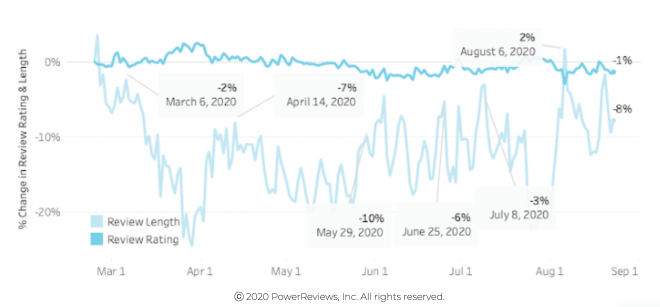
In terms of the actual content of reviews, there have not been any huge shifts over the past six months. Sentiment – in the form of average rating – remains flat, which makes sense given the products themselves are unlikely to have changed significantly in this period. Review length is down slightly on pre-pandemic levels but has rebounded notably in recent months. This may be because reviewers have become accustomed to the “new normal” and are approaching the task with renewed focus and mental capacity. 

In our June webinar, we focused on review length in detail and offered some tips how to improve review quality. Check out our blog for a summary of that webinar.

Review submission volumes now comparable to pre-COVID
Review length and sentiment flat throughout pandemic

Reviews still convert shoppers to buyers more than they were pre-COVID

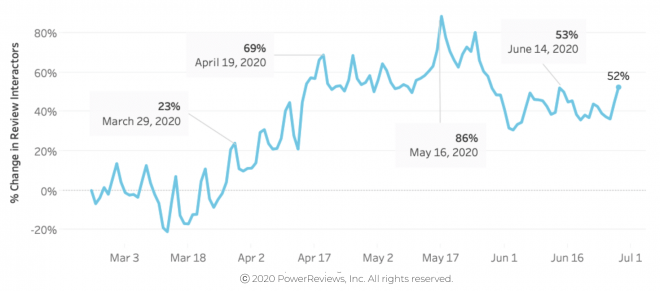
As with the other trends we highlight, the impact of review content on consumer behavior remains relatively consistent with what we saw in previous months. In other words, review content continues to be more influential on the path to purchase than it was before the pandemic. 

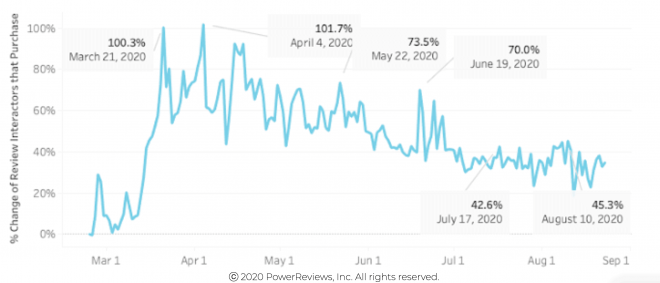
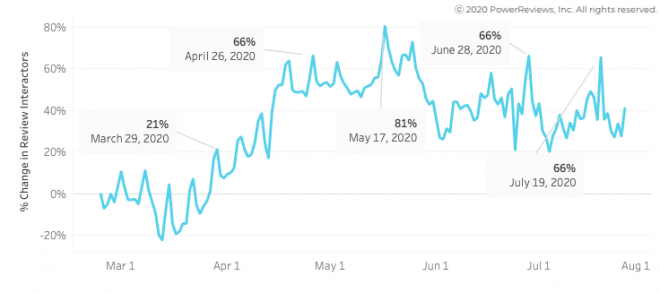
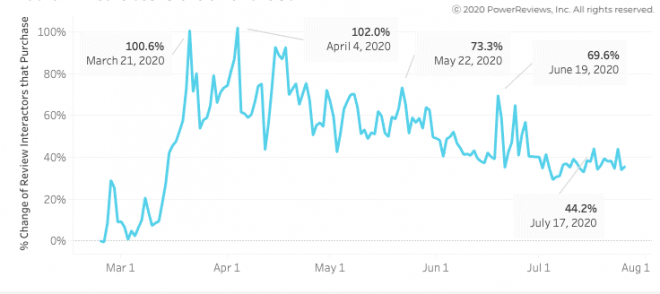
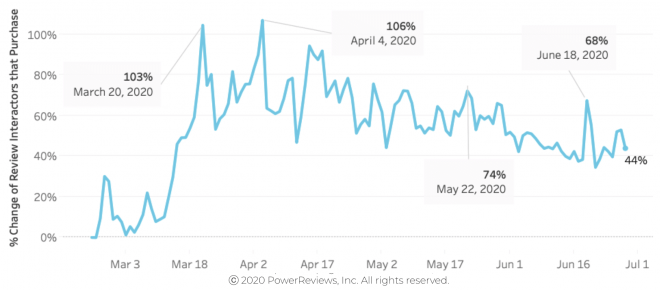
However, while the June and July high in total review interactors were identical (at 66% above the end of February levels), the proportion of review interactors who went onto purchase is actually down (the July peak was 63% below the equivalent figure for June). So consumers are interacting with review content at the same rate as they were last month but are then going onto purchase less than they were then. This is consistent with July’s decrease in orders overall and aligns with the idea that shoppers are becoming more comfortable browsing online, and are less “decisive” in their shopping habits.

But the bottom line remains: Shoppers are still heavily relying on review content to assess product quality and make purchase decisions.

Reviews still convert shoppers to buyers more than they were pre-COVID
Reviews still convert shoppers to buyers more

Summary

The story for the September snapshot is that it has proven to be the third month of continued stabilization. Trends are now very stable so we can confidently say we are now in a COVID-driven “new normal”.

We have been talking about this for the last two months, and it has completely borne out in this report.

As we pointed out last month, the wild and almost out of control growth patterns we saw at the start of the pandemic appear now to be a drastic reaction to drastic and unprecedented circumstances.

Given market conditions are unlikely to change any time soon, this “new normal” will soon simply become “the normal”.

You can literally win and lose on the speed of your site

By now, you are most likely crystal clear on the critical importance of a quick-loading webpage for your customers’ experience and your site’s conversion rate.

Consumers have high demand when it comes to site performance and load speed. In case you’re not sure what all the hype is about, here are some particularly compelling data points:

As you can see, consumers don’t have the patience for slow-loading sites. And with an endless aisle of options, they don’t need to.

Why PowerReviews wins

When it comes to displaying UGC on your site, it’s important to know if your reviews are slowing down your website and ultimately hurting conversion rates. 

We know how important this is to the success of your business. This is why our ratings and reviews code is 2.5 times lighter than our competitors, leading to way faster page load times.

How we do this

One of the most important aspects impacting site load speed metrics is Javascript size.

And it’s for this reason that PowerReviews has consistently made reducing Javascript size one of our primary goals.

The updates we have made over the past 18 months have reduced Javascript size throughout every touchpoint on our customers’ product pages.

Here’s a breakdown of content types and their size reduction:

Page Type Percent Size Reduction
Product Listing Page (Category Pages) 61%
Product Details Pages 20-26%
Write a Review & Review Your Purchases 40%

What changed?

In order to reduce the size of our Javascript, we added logic to the code to analyze configuration in real-time. Now, PowerReviews only loads the components of pages that are absolutely necessary. This basically means our Javascript is working smarter, not harder. Although this may seem obvious, driving these valuable efficiencies requires a lot of sophisticated technical background work.

We are also constantly iterating and improving. On top of this, PowerReviews has added sophisticated measurement capabilities to monitor the size of our Javascript code each time we make enhancements and updates. If we are increasing the size we are alerted during the development phase so we can proactively make any necessary adjustments prior to release.

This is how we will keep your page load speeds fast.

How do you compare to Bazaarvoice?

One thing we get asked a lot is: how do you compare on site speed to your main competitor?

We can state with complete confidence that the PowerReviews solution is significantly lighter than Bazaarvoice. For example, the most recent data shows that Bazaarvoice loads at least ten javascript files for a total of 385.31KB whereas PowerReviews loads only two javascript files amounting to 204.62KB.

When it comes specifically to PDPs (Product Detail Pages), BazaarVoice needs to render seven urls on all its customers’ PDPs before the Javascript appears. PowerReviews needs to render two. Big difference resulting in way quicker load speeds.

Bazaarvoice

javascript files
0 +
total file size
3 0 KB

PowerReviews

javascript files
0
total file size
200 KB

Another component that affects load time is DNS resolution. DNS resolution can add significant latency to requests. And for websites with open connections to many third parties, this latency can significantly reduce loading performance. Bazaarvoice’s network requests span over six different DNS names, but PowerReviews is limited to three.

All well and good. But what does this mean when applied to actual site speed? Well, the 2019 eCommerce Third Party Technology Index shows Bazaarvoice technology consistently in the “red zone” when validating code – which consistently negatively impacts site performance time and time again.

The experts agree

Site speed experts YOTTAA analyze this sort of stuff everyday. They are constantly evaluating and advising which third party applications most slow down ecommerce websites in order to drive overall optimization.

As Beth Moriarty, VP of Product & Corporate Marketing, YOTTAA, explains: “Because YOTTAA accelerates over 1,500 ecommerce sites, we have the unique visibility to analyze detailed information on the performance of almost 1,000 third parties. We also understand the importance of working with third parties that are always pushing themselves to be better — and faster.”

Content + Speed = More Sales

UGC is meant to help not hinder. So the absolute last thing your UGC provider should be doing is negatively impacting the performance of your site. What’s the point of even bothering with UGC if your customers don’t even see it?

Our streamlined Javascript code – optimized to strike the perfect balance between product page speed and content – is available as a standard part of our core solution. It has been developed to deliver the best possible customer experience to drive conversions and sales.

If you want to understand how we enable faster load times with optimal customization, speak to one of our experts.

Alison Krakowiak

In her role as Product Marketing Manager at PowerReviews, Alison leads new product launches by focusing on communicating the value of our technology to our clients and partners. Alison is excited to bring the voice of our PowerReviews clients into everything she creates.

If there’s one thing we feel we can speak authoritatively on (if we do so say ourselves), it’s best practices for showcasing User-Generated Content (UGC) in your product display pages.

Specifically: Exactly what information should you include and why?

To answer this question effectively, it’s worth explaining the point of UGC. Before making a purchase, consumers want validation for their decisions from a trusted source. And what could be a more trusted source than an independent third-party (i.e. customers) who have already experienced the product in question?

UGC weaves the Voice of the Customer throughout your site, for greater authenticity and customer-centricity. UGC adds functionality and utility to your website to support the buyer journey, and in doing so, it provides critical social proof that turns shoppers into buyers. In other words, the main benefit of UGC is that it maximizes conversions and drives sales.

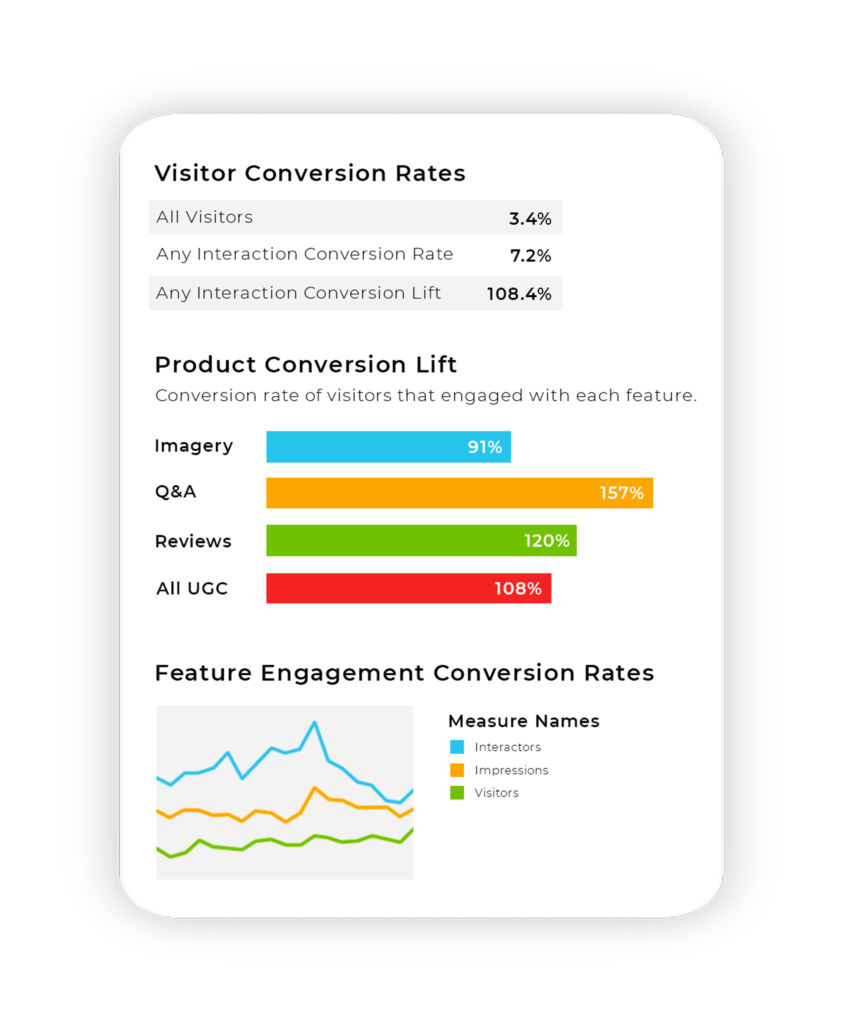
At PowerReviews, we analyze extensive volumes of web traffic to understand what types of UGC have the most impact on the buyer journey. More than three-quarters of online shopping traffic across all our clients consume at least some form of UGC (i.e. visual media, Q&A, reviews, ratings), and the results of those interactions are quite compelling. In fact, across all this web traffic, online shoppers that interact with some form of UGC are actually 103% more likely to make a purchase.

I work with a bunch of leading brands that leverage a range of UGC to drive conversions. Here are the UGC that have the biggest impact, along with some real-life examples.

UGC Type 1:
Questions & Answers (Q&A)
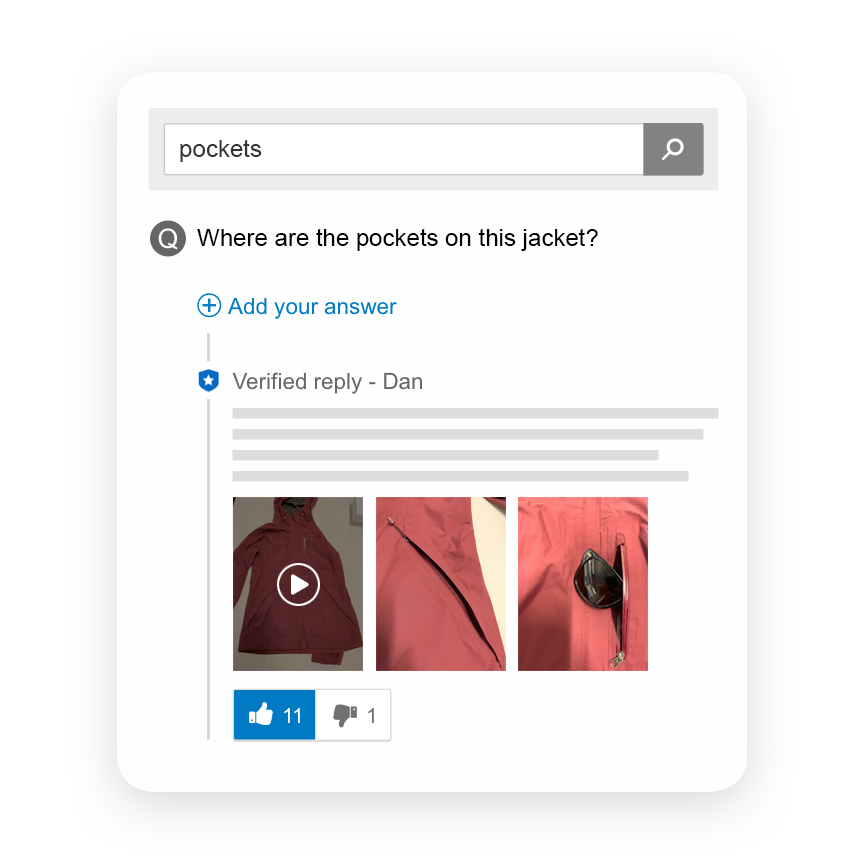
Q&A Display Example Featured Image
What is Q&A?

Q&A provides the opportunity for customers to provide specific questions about a product on your product pages. You can then answer these questions yourself or allow other customers to provide responses.

Why is Q&A valuable?

Q&A gives shoppers answers to the very specific questions they have before making a purchase. In doing so, it boosts confidence and removes hesitations to buy – absolutely critical when aiming to convert browsers to purchasers.

Q&A also enables you to bridge the content and contextual gaps often not covered in standard online product descriptions. Think questions about various use cases, product compatibility, warranty and how the product performs in given scenarios. You 1) can’t cover all these topics in your product descriptions and 2) can’t anticipate every question your customers may have. So crowdsourcing these questions in a mini and highly specific online forum is the next best thing.

Our research shows Q&A is the No. 1 most impactful type of UGC content. Consumers engage with this content convert at 153% the rate of overall site traffic.

Real-life best practice example of Q&A

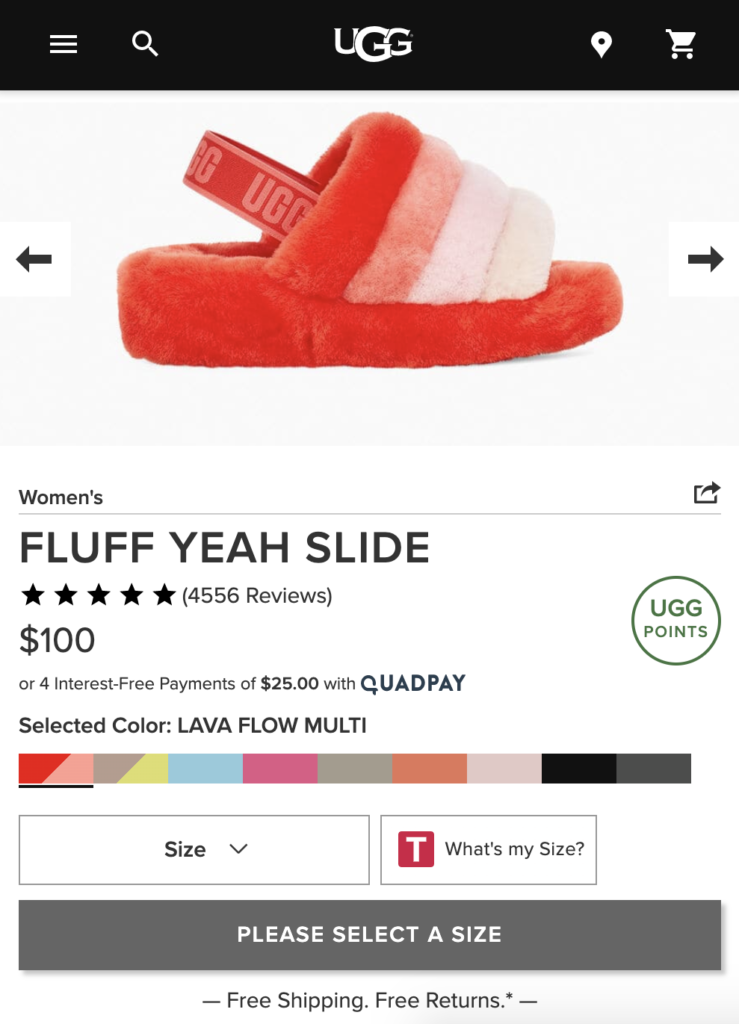
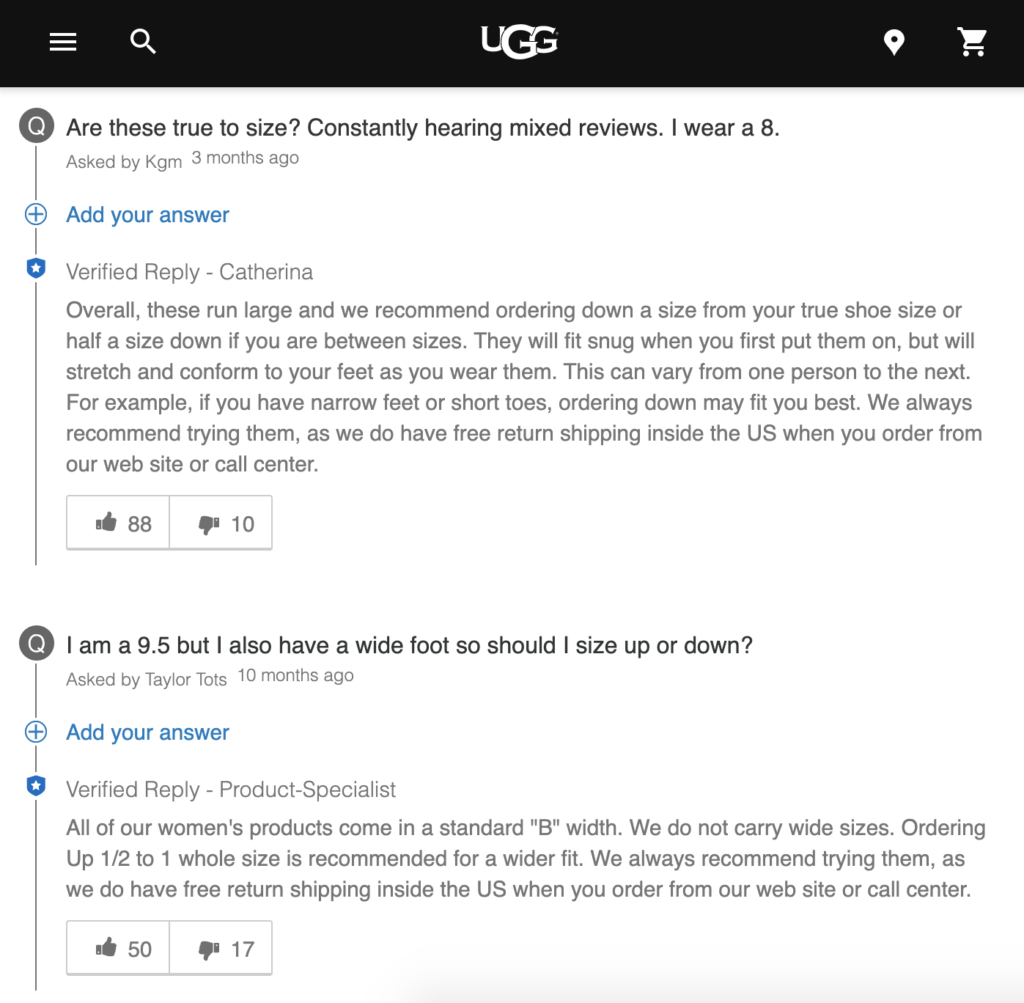
If you’re looking for a retailer with a solid Q&A foundation, check out global footwear mega brand UGG. The retailer has 34 questions in its Q&A for its 5-star rated Fluff Yeah Slide. Shoppers can ask a question, sort responses by various criteria – newest, oldest or most answers – and also search by keyword.

UGC Type 2:
Size/Fit Snippet
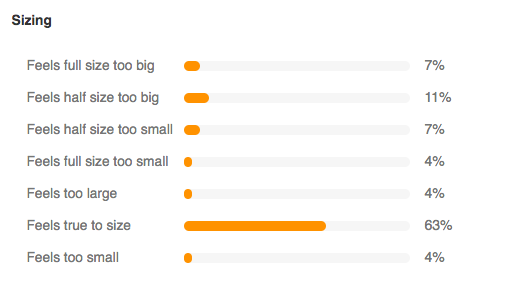
size and fit example of powerreviews
What is the size/fit snippet?

The ability to sort review content according to consumer sizing reactions. Is the item coming up smaller than anticipated, larger or just right? Receiving this information from people who have actually bought and tried the item provides authentic guidance you simply cannot replicate.

Why is the Size/Fit snippet valuable?

Consumers who interact with review content drive a 115% increase in visitor conversion rate per our research. The Size/Fit Snippet is a great way to facilitate this interaction. Why? It gives shoppers the ability to filter reviews to bring the most relevant review content front and center.

Studies show consumers will pay a premium for products that are personalized to their specific needs. Think of the Size/Fit Snippet in the same manner – consumers place a premium on user generated content that is personalized to their specifics.

If you’re an apparel or footwear brand in particular, the Size/Fit Snippet is a “must have”. Presenting reviews in this manner is a win-win for retailer and for the customer. It elevates consumer confidence whey they can’t touch or try on a product but want to ensure it will still look and feel great; as well, it acts as an excellent qualifier thereby significantly reducing the likelihood of return.

Real-life best practice example of size/fit snippet

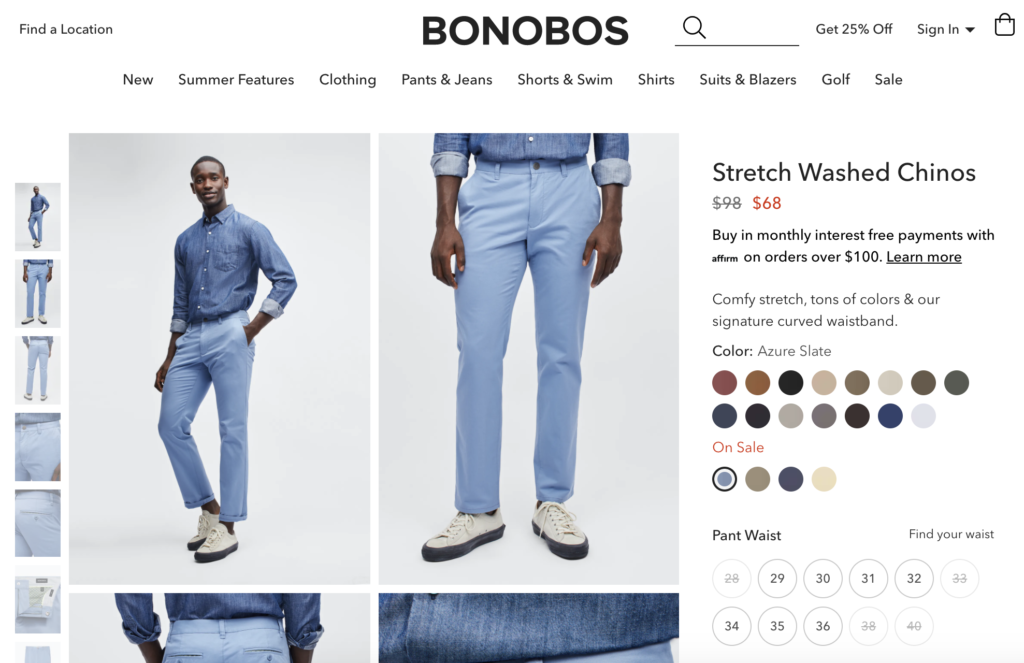
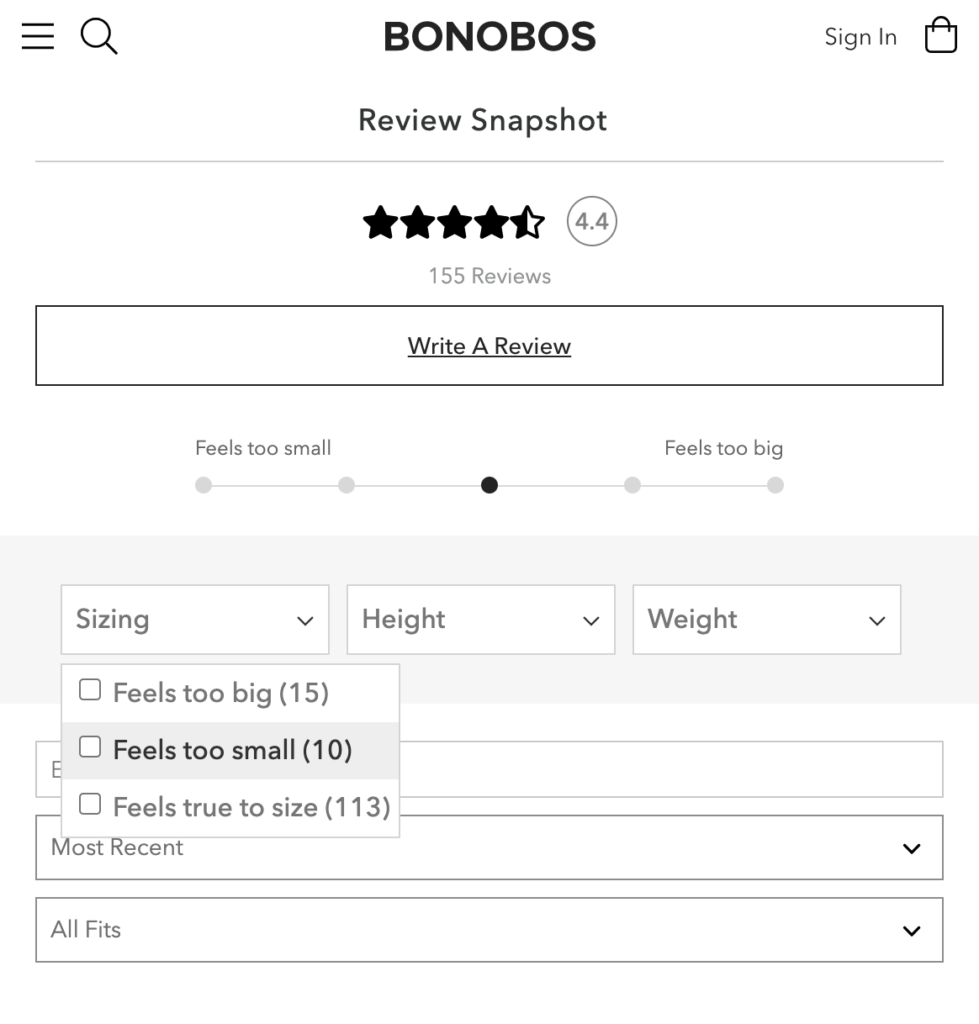
To see a great use of the Size/Fit Snippet in action, check out Bonobos. The men’s clothing designer and retailer’s claim to fame is that it offers “the most fits in pants – Skinny, Tailored, Slim, Standard, & Athletic – across sizes 28-54 so you’re bound to find the right fit.” To support this value proposition, the company offers copious size and fit information resources on its website.

On its Stretch Washed Chino product display page, 155 reviews can be sorted by Size (Too big, too small or true-to-size fit), Height (options from 5’4” to over 6’4”), and Weight (options from under 150 to over 300 pounds).

UGC Type 3:
Imagery
What is imagery?

In a UGC context, photos from actual customers of the product “out in the wild”. These show what it looks like in reality

Why is consumer imagery valuable?

Real-life customer photos trump corporate glossy product images taken in a controlled lighting environment. Why? They are far more authentic and reflective of the actual reality of buying the item in question.

 According to surveys, some 88% of shoppers polled want to see authentic product photos and videos. Our tracking data shows that engagement with this user-generated imagery results in an 81% increase in visitor conversion rates.

 They say a picture is worth a thousand words; most of us are very visually oriented and images can convey information in a much more nuanced and detailed way than text. (e.g.  how a duvet looks in the bedroom, or the specific grey color of a belt etc.). 

Real-life best practice example of consumer imagery

One brand leveraging user-generated imagery to its advantage is casual apparel and accessory retailer Aéropostale. Its product display page for its Real Denim High Rise Slim & Thick Curvy Jegging features an image carousel with images from reviews and social media channels showing real people in all shapes and sizes modelling and styling the jeans.

UGC Type 4:
Review Faceoff
What is the Review Faceoff?

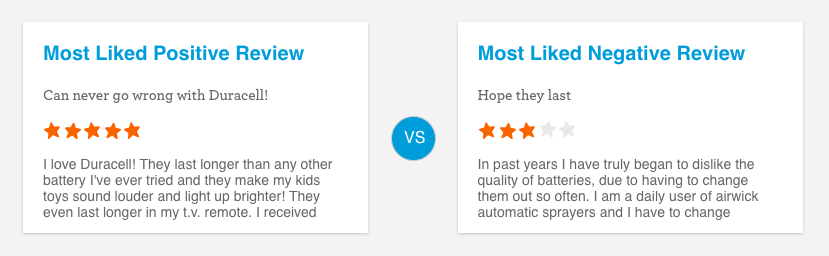
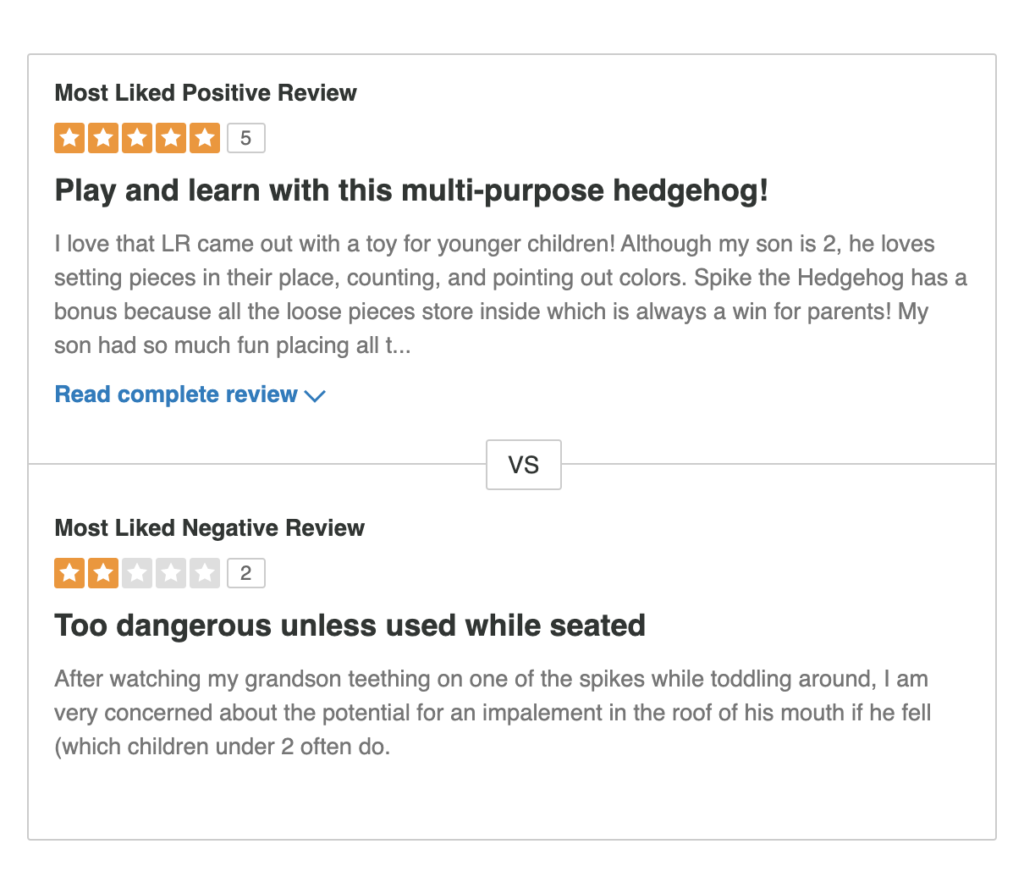
The Review Faceoff showcases the most liked positive and negative review for a specific product.

Why is the Review Faceoff valuable?

This review feature gives prospective buyers a read on the most valued product and pros/cons quickly and easily. This reduces effort while promoting authenticity.

While it may seem counterintuitive to showcase a negative review, our research shows 85% of shoppers seek out negative reviews prior to purchase. A full two-thirds of visitors filter for 1-star reviews and yet these visitors still convert at 108% the rate of general web traffic.

After all, no product is perfect and customers are realistic to know that; a jacket is super warm and waterproof, but maybe the zipper breaks easily. Customers want to know the full scoop – all the pics and pans, what people love and what people hate. They’ll want to see the worst and realize to see if they can live with it. And this also mitigates future disappointment down the road because it helps manage expectations

Real-life best practice example of Review Faceoff

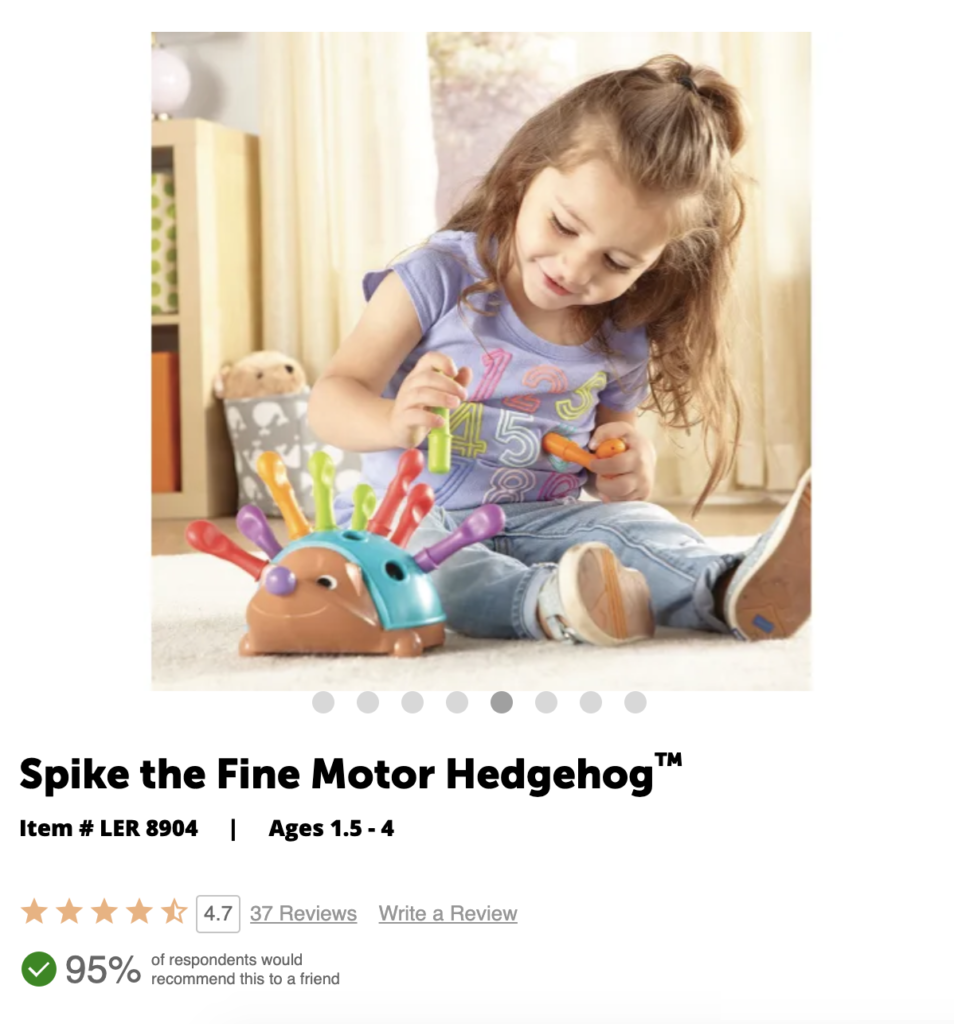
One example of a brand reaping the rewards of the Review Faceoff is Learning Resources. On its Review Snapshot on the Spike the Fine Motor Hedgehog, shoppers can clearly see the pros and cons of the product as cited by reviewers and view the Most Liked Positive Review and the Most Liked Negative Review.

UGC Type 5:
Sort and Filter/Search Bar
review search example of powerreviews
What is the Sort and Filter/Search Bar?

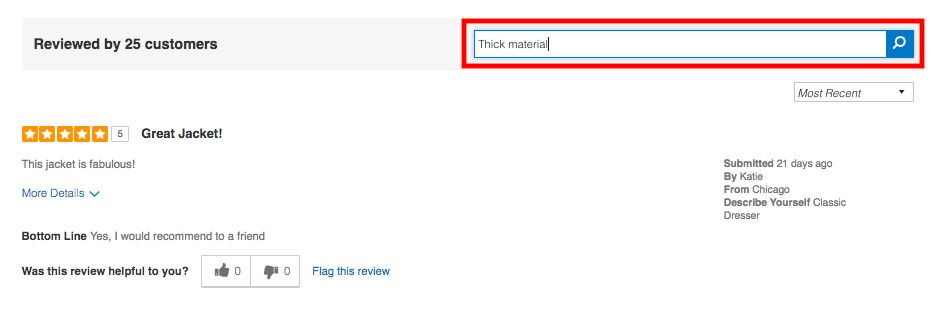
A bar at the top of your review content in your product page that provides the ability for customers to sort and filter your review content. This helps them personalize their own research process to get the information they need on the product before hitting the “buy” button.

Why is the Sort and Filter/Search Bar valuable?

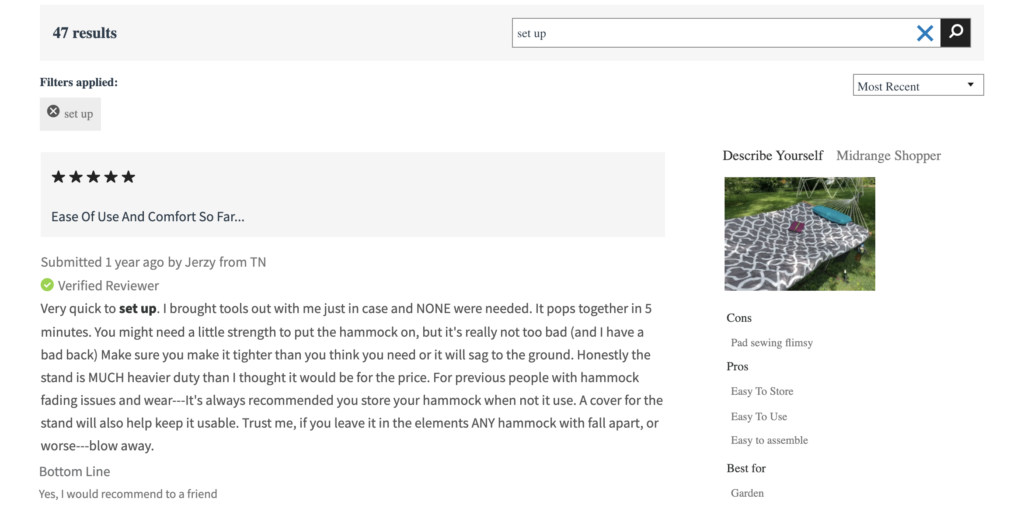
Consumers like options, so giving shoppers the ability to sort and filter and slice and dice UGC as they desire is a big win. By adding Sort and Filter/Search Bar functionality, you can offer the flexibility to sort by reviews with images, highest rated, lowest rated or most recent reviews, a certain size, or other keywords. They get the information they need to make informed purchase decisions.

Real-life best practice example of Sort and Filter/Search Bar

The Sort and Filter/Search Bar on home furnishing retailer Hayneedle’s product display page for its Algoma 11-ft. Cotton Rope Hammock with Metal Stand Deluxe Set, is a solid example. It’s also clearly a very helpful feature given the product has over 225 reviews!
Do You Have the Data to Drive UGC Decision Making?

While these types of UGC are tried and tested by our customer community and proven to help drive conversions, your results may vary. It’s important to consider what is important to your audience when devising your UGC strategy.

And as with any eCommerce tactic, it’s important to benchmark efforts to determine what is working. Small shifts can produce big results when it comes to UGC, but you need to be able to evaluate the effectiveness of your current efforts to understand what, if anything, needs to change.

Unfortunately, many brands have little to no insight into their UGC efforts and as a result, are unable to size or even define this impact. They have no way of knowing the nature or extent of consumer interactions with UGC. To address this issue, we recently released a new analytics product that provides very precise recommendations based on data (i.e. what interactions with UGC content lead to conversions/purchases).

This new offering enables brands to establish the impact of their UGC investments across their eCommerce environment, including analysis across all UGC on product pages; engagement data, such as viewing of, filtering of and clicking on specific elements on each product page; key related site analytics, such as time on page, and critically subsequent actions and outcomes – i.e. whether shopper bought the product or not.

As online shopper behaviors are shifting drastically, now is the time to make sure your product pages are capturing customers’ attention. What type of UGC content results in better outcomes? Understanding which types of UGC will drive the most impact will allow you to prioritize efforts to give your customers more of what they want and need and in turn maximize conversions.

Not sure your review display is giving you the highest conversion rate? If you are a PowerReviews customer,  reach out to your Customer Success Manager who will tell you have the right setup in place. If you are not a PowerReviews customer, we’d love to tell you more.

Adrienne Harmon

Adrienne, a Sr. Enterprise Customer Success Manager, has been with PowerReviews for 2 years and focuses on strategic initiatives to help drive PDP conversion utilizing user generated content for some of the globe's largest brands and retailers. When she's not mining through reviews, you can find her at the gym where she is staunchly passionate about health & fitness or online shopping for white sneakers. Seriously, she has 6 pairs.

This is the fifth edition of our monthly snapshot (most recent versions here and here), originally established to assess the impact of the coronavirus pandemic on consumer behavior. As always, we draw our analysis from consumer activity across more than 1.5MM online product pages from more than 1,200 retail/brand sites.

This time, we focus on a five-month period (starting February 24 2020 and ending July 26 2020). Each report, we specifically analyze review submission levels, review length and sentiment, overall conversions/sales volumes and review consumption (both absolute and among those who go onto purchase).

After seeing drastic extremes over the course of March through May, we experienced continued stabilization for the second month running. Again, the overriding theme seemed to be that the market had well and truly settled into a “new normal”.

Key ecommerce market trends

01

Ecommerce purchase volumes and site traffic consistent over the past month

02

Review submission volumes continue to trail off, but still at higher levels than pre-pandemic

03

Reviews still converting more shoppers to buyers than before pandemic

Ecommerce purchase volumes and site traffic consistent over the past month

Over the past four months, we have reported aggressive growth in ecommerce purchase volumes since we started measuring at the back end of February. We consistently saw 3x increases in purchase volumes during April and May. However, this started to tail off in June, a trend that continued in July.

If you analyze the last two months, a very slight but notable decrease is actually evident. It’s too early to tell how significant or long lasting this will prove to be. However, there certainly appears to be clear overall stability with less drastic fluctuations evident. July ecommerce purchase volumes still peaked at almost double where they were at the end of February.

Traffic too has stabilized, remaining consistent over the past two months. As we mentioned last month, customers are now far more comfortable shopping online but have become less decisive over the course of the COVID era – perhaps due to broader economic uncertainty, job insecurity, and associated pressures.

Both traffic and purchase volumes stabilize throughout June and July
Both traffic and purchase volumes stabilize

Review submission volumes continue to trail off, but still at higher levels than pre-pandemic

In the June snapshot, we reported a giant 2.3x leap in review submission levels from April to May before highlighting a slight drop last month. These levels were maintained through July 2020.

However, it’s important to note that review submission volumes are still around 20% higher than where they were pre-pandemic. This is despite an initial drop off throughout March, when review submission actually fell right at the time “Stay at Home” orders kicked in. Consumers probably had bigger concerns at that time than writing product reviews.

In terms of the actual content of reviews, there were not any huge shifts. Sentiment – in the form of average rating – remains flat, which makes sense given the products themselves are unlikely to have changed significantly in this period. Review length is down slightly on pre-pandemic levels but, given the average review length is 154 characters, a decrease of 10-20% is not particularly significant or meaningful. In our June webinar, we focused on review length in detail and offered some tips how to improve review quality. Check out our blog for a summary of that webinar.

Review submission volumes continue to decline but up on pre-COVID
Review submission volumes continue to decline
Review length and ratings stable throughout COVID era
Review length and ratings stable throughout

Reviews still converting more shoppers to buyers than before pandemic

As with the other trends we highlight, the impact of review content on consumer behavior remains relatively consistent with what we saw in previous months. In other words, review content continues to be more influential on the path to purchase than it was before the pandemic. 

However, while the June and July high in total review interactors were identical (at 66% above the end of February levels), the proportion of review interactors who went onto purchase is actually down (the July peak was 63% below the equivalent figure for June). So consumers are interacting with review content at the same rate as they were last month but are then going onto purchase less than they were then. This is consistent with July’s decrease in orders overall and aligns with the idea that shoppers are becoming more comfortable browsing online, and are less “decisive” in their shopping habits.

But the bottom line remains: Shoppers are still heavily relying on review content to assess product quality and make purchase decisions.

Reviews interaction levels stable from June to July
Reviews still convert shoppers to buyers at higher rate than before pandemic
Reviews still convert shoppers to buyers at higher rate

Summary

The story for the August snapshot is stabilization. There are slight declines in many of the metrics we capture but they are not significant. Last month’s assessment that consumers have settled into a “new normal” when it comes to ecommerce seems to have largely borne out.

However, the declines in activity are certainly worth watching. Will they continue into something more significant or will they creep back up to what we saw in May and June?

The crazy numbers we saw at the start of the pandemic appear now to be a drastic reaction to drastic and unprecedented circumstances. It seems to be a safe bet that the more stable trends of May, June, and July will continue into August and beyond given there’s no end to the pandemic in sight.

Generate Longer 5-Star Reviews by Maximizing the Value of our new Capability

We get asked a lot by customers: how can we generate longer reviews?

At the core of our company ethos is the concept of authenticity. While our competitors are releasing functionality that enables brands to selectively delete review content they don’t like, we are focused on building capabilities that drive high quality and real content that performs.

So we recently rolled out a feature focused specifically on this goal: the Review Meter.

What is the Review Meter?

An interactive character count positioned under the review commentary section that increases as your customer writes his or her review. Here’s an example of it in action:

As you can see, a little green bar grows as the customer types. Some explainer text beneath gently reminds customers to keep writing until they reach the minimum number of characters (this length can be customized to your own specification). Nothing stops the customer from submitting at that shorter length. But this provides some encouragement to provide just a little more detail – particularly if that customer has just been primed by you to talk about best uses or where they are using a product and why.

Once the customer hits that minimum character count, the meter lights up excitedly. The text also converts over to a “keep it up” message, further reinforcing positive behavior.

It’s very simple. But that small visual can go a long way in helping to encourage customers to talk just a little more about their experiences and/or why they like something.

Here’s what McKenna Rowe from DRINKS (featured in the image above) thinks.

Taste in wine creates a lot of debate and opinion. Our sample reviewer (in the above example) is explaining how he or she usually likes red blends, and is typically not particularly enamoured with dry wine. Others reading then gain a sense for this reviewer’s preferences, taste, palate etc. If this matches theirs (or even if it doesn’t but they know enough to understand), the impact is huge.

Review content is all about relating and connecting with the reader. The more likely your content is to do this, the more likely it is to have the desired result.

If you’re a PowerReviews customer, this is super easy to enable. Your Customer Success Manager would be delighted to talk you through it so please reach out if you’re interested.

Longer reviews have deeper impact

To understand the value of the Review Meter, you need to understand the very real and tangible impact of review length.

As we mentioned at the outset, we get asked this a lot by brands and retailers. How much of a focus should it be? What does the data say in terms of the value and impact of longer review content over shorter review content? And, most of all, what can they do to inspire their customers to leave more detailed reviews?

Read on to find out a detailed data-backed take on why curating longer consumer review content is worth your while.

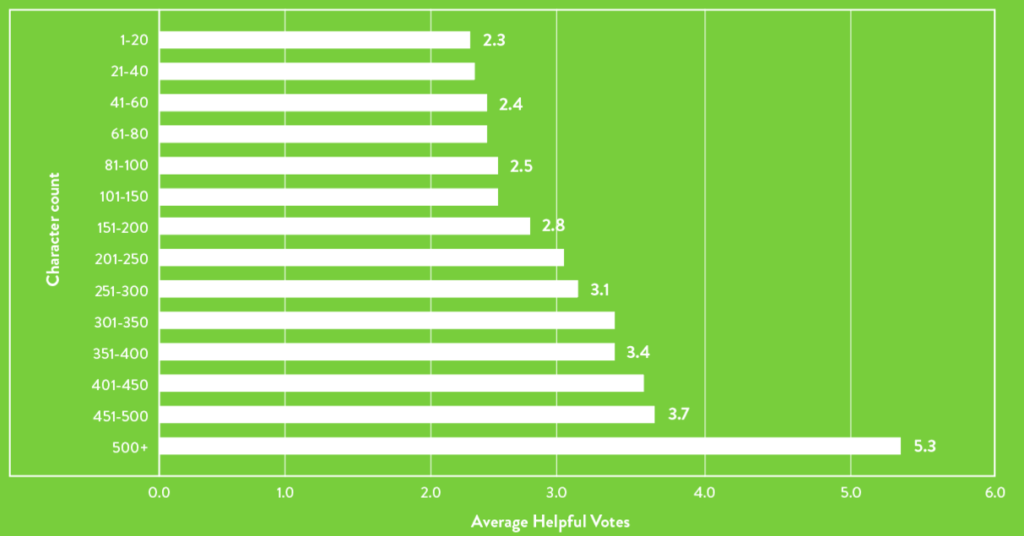
Based on our own PowerReviews review interaction data (taken from analysis of 1.5m+ product pages across 1,200+ brand and retail sites), we can see the distribution of “helpful” ratings according to review length. By this we mean the average number of “helpful” votes review content receives from shoppers. This acts as a good barometer of review consumption and engagement.

As you can see, helpfulness increases in line with review length growth. The trend is very clear. The longer the review, the more helpful it is. 500+ character reviews – in particular – evidently offer huge value to shoppers.

This makes complete sense: consumers like to consume longer review content because it includes more detail that is more likely to be relevant to them. Take a coat for example. A longer review might go into the fit, the material, the zipper, the color, the warmth, reasons for buying and so on and so on.

But what does a “helpful” review mean in terms of outcome? Quite a lot, it turns out.

Review Sort Conversion Lift
Conversion rate of visitors that engaged with each feature
Highest Rating
157.8%
Lowest Rating
105%
Images
167.3%
"Most Helpful" Reviews
192.1%
Most Recent Reviews
80.9%
Oldest Reviews
107.3%

Of all consumers sorting review content, those that sort by helpful rating convert at the highest rate. This actually amounts to 192% above overall average conversion rates. So longer reviews are more helpful and helpful reviews have a huge impact on whether that shopper then goes on to buy that item or not.

Something else to consider about longer reviews: they provide more information about the product for you to analyze (assuming you have the NLP and text analytics to do so…check out our UGC Analytics platform if you don’t). What do consumers like about your product? What do they hate? How can you improve it ? Now project this across your entire catalog. That’s a whole lot of high-value and actionable information for you to leverage to drive positive and meaningful change.

Why do longer reviews generate better results?

It’s not surprising that longer reviews generate better outcomes. As detailed above, the more information contained within a customer review, the more likely it is to clearly articulate a specific use case and answer whatever questions a customer has. It’s also more likely to enhance buyer confidence.

But this value has numerous levels. Think about it: unstructured product feedback is feedback in your customers’ own words. No BS. In this social media-influenced world where everyone is used to interacting and providing their opinions online in public forums, reviews offer an excellent outlet to provide feedback and recommendations for others.

Their verbatim nature mean you also really get to understand how an experience or product made a customer feel. The longer the review, the more customer emotion-type information you get. Reviews that highlight how products made a shopper feel something positive resonate and connect with customers. As a result, they can be extremely influential in the buying decision.

Longer reviews also make the product more likely to be found. Review content – like any other copy on a web page – contributes to SEO rankings, thereby increasing web traffic. More eyes on a product – particularly when the search is likely to be highly intent driven – means more sales.

The More Negative the Sentiment, the Longer the Review

We wanted to see if consumer sentiment affected review length. The answer is it does and significantly so.

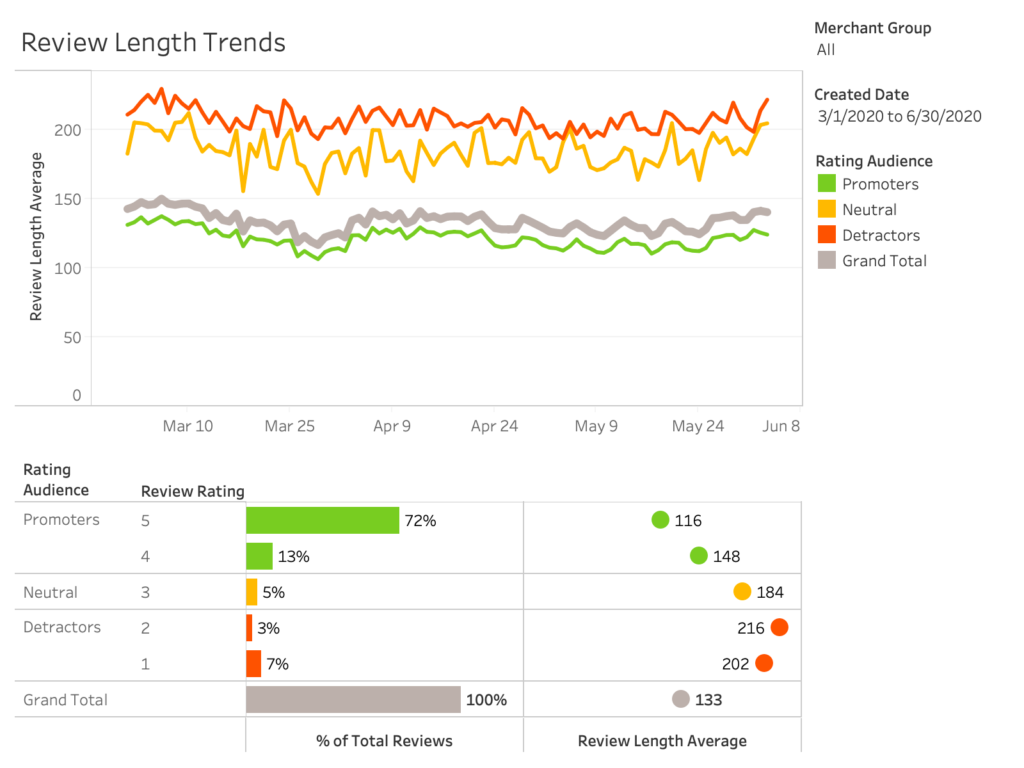
To do this, we looked at the accompanying rating provided by the reviewer alongside their review content. It’s clear that – even over an extended period – five and four star rated reviews (out of five) are consistently shorter than one and two star reviews.

To spell this out, negative reviews are longer than positive reviews. Intuitively, this makes sense. You’ve probably seen a lot of review comments out there that say simply “amazing, love my new spatula”, “this coat is wonderful” or similar.

Negative reviews – on the other hand – tend to have more detailed explanations of why the reviewer didn’t like the product (e.g. “Bought the oven online, was a seamless purchase and delivery process. I wouldn’t buy it again though because it doesn’t heat to the temperature it claims at any given time, I’ve verified with my own oven thermometer. When I baked a cake, it didn’t rise. It ruined my son’s birthday. Such a shame as this brand is usually super reliable and this is the third oven I bought for them. I’m shocked and disappointed” etc.).

Negative reviews actually average more than 200 characters pretty consistently. But positive reviews track more closely to what we described across all our data. Why? Most reviews are positive. In fact, the bottom chart here highlights that a whopping 85% of product reviews are 4 and 5 star rated.

This is an especially important point for you to consider. What this means:

  1. Longer reviews are more impactful and drive better sales numbers
  2. Positive reviews tend to be shorter in length but greater in volume
  3. You need longer positive reviews.

You need to focus on generating longer 5-star reviews

We offer extensive guidance on how to generate more review content. Check out this guide or this blog for more on that.

Here we want to explain: how do you convert willing reviewers into longer, helpful review content?

By this point, you have commitment from your customer to provide a review. They are already invested in the process. But you have to remember that your customers are most likely not experienced reviewers. They are also unlikely to be expert copywriters and they are probably not product experts. They may not even know where to start when it comes to providing information other shoppers look for.

Start with the Review Meter

Our Review Meter was designed with this goal specifically in mind. This is a very easy way to start increasing the length of your review content and generating more impactful reviews.

It’s very basic human psychology. Most people want to please others and/or achieve an objective. The way the review meter is set up, it hits on both these points. The bar only turns green when the review submission hits a desired length.

Given your customers have already voluntarily chosen to provide content, they already have a certain amount of commitment to the process. So play on this to ensure the review they submit is as valuable to you as possible.

Also Encourage Quality with an Optimized Review Submission Form

To fully optimize the power of the Review Meter, we recommend also optimizing your review submission form.

Why? Your customers may not know exactly what to write or what other customers find valuable. However, they know why they bought the product and their specific use case. So you need to harness their enthusiasm to share their experience to tease this information out of them.

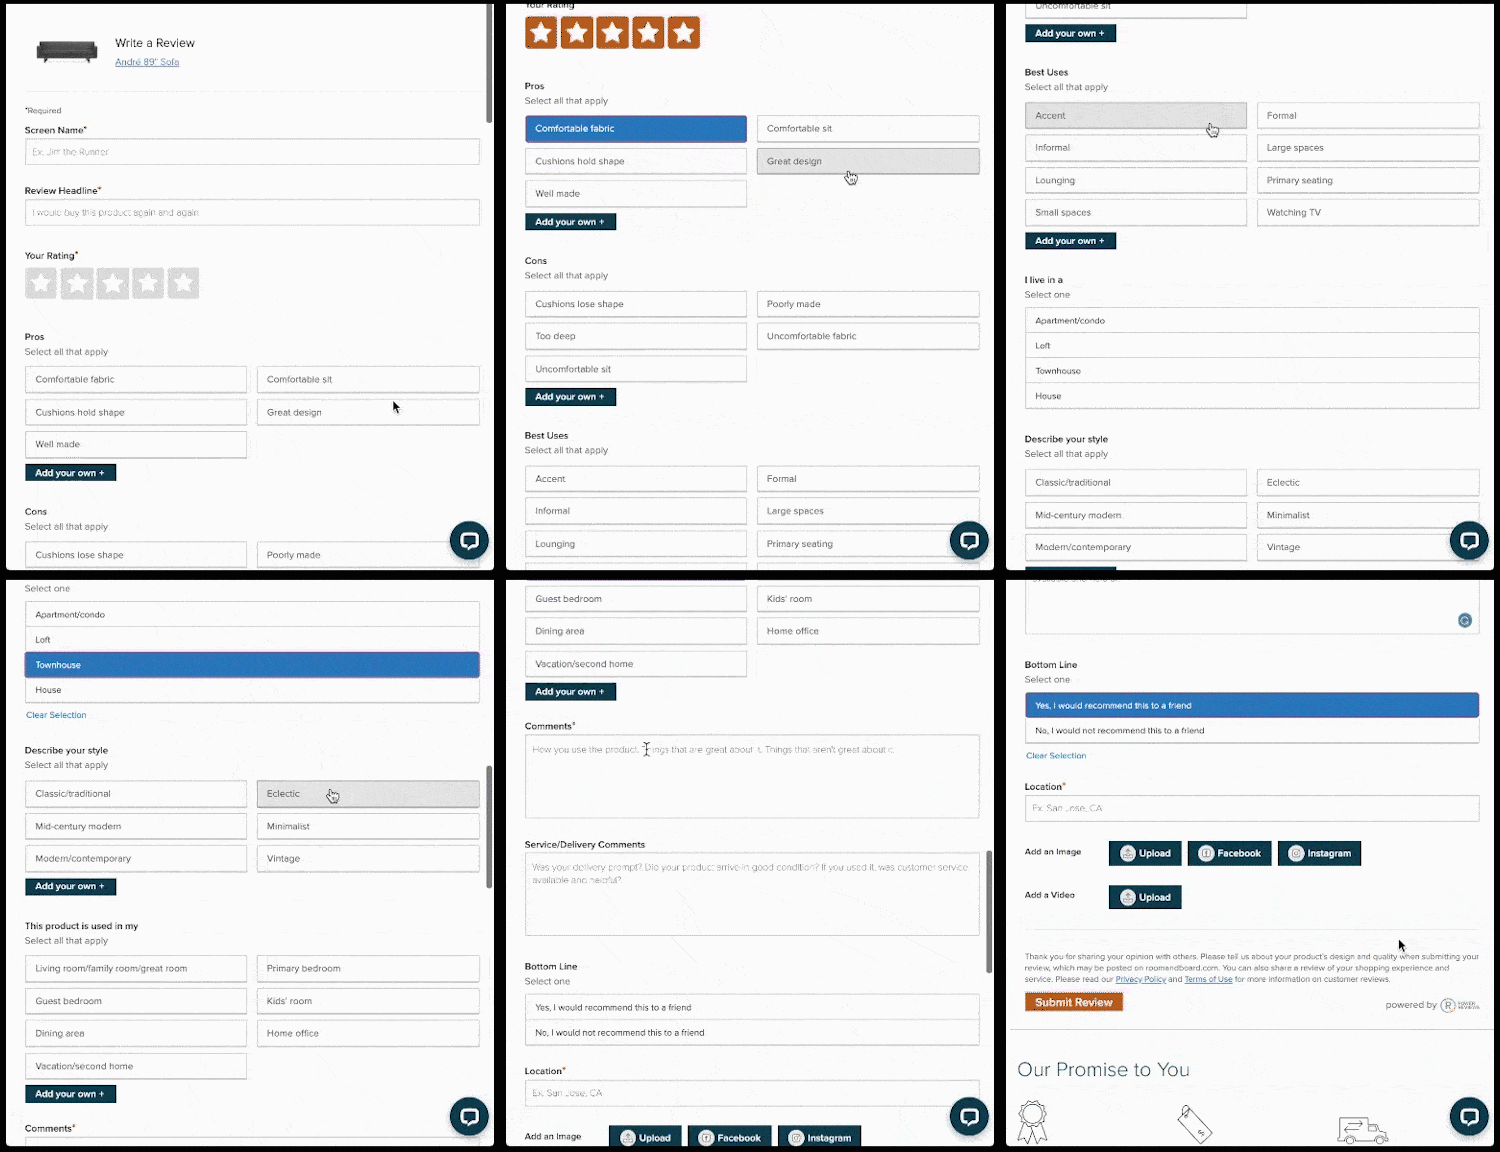
Our customer Room & Board offers a great example of how you can guide your customers through the review submission process (full form here for reference).

They do this by planting a number of ideas in the reviewer’s head before they get to the form.

Specifically, they ask customers to select from a series of multiple choice checkboxes. The review form is related to a furniture item, so Room & Board ask reviewers to choose their uses (options: accent, informal, lounging, small spaces, formal, large spaces, primary seating, watching tv) where they live (options: apartment, loft, townhouse, house) and so on.

This very smartly plants ideas in the reviewer’s head that they will take into their comment submission later in the form. So “love this couch” becomes “I needed a modern looking couch that is super comfortable (mainly for watching TV) to be the centerpiece in my one-bedroom New York City apartment. I love how flexible it is…it’s equally great for lounging and as a formal piece for hosting” etc.

The form in effect guides customers to provide helpful review content. The review meter in effect acts as “the convertor”, providing the motivation to create the sort of content that leads to sales. 

And of course the checklist approach also has other highly complementary purposes. Namely, they help populate Pro/Con lists, use cases and demographic information at the top of the review display that summarize information contained in the reviews. These can then be displayed in an easily scannable and filterable way for shoppers, providing super impactful social proof from “people like me”.

In Conclusion

If you don’t care about review length, you should. Longer reviews are proven to drive more sales.

Why? During the research phase of their purchase cycle, consumers want authentic validation. If they get this, they are far more likely to follow through and convert to a buyer.

The more relatable the review content, the more likely it is to resonate and have an impact. And the longer the content, the more likely it is to contain this relatable information.

The good news is that there are some simple actions you can take to encourage these longer reviews.

First and foremost, you should leverage our new Review Meter. We built this capability exactly because brands and retailers are struggling to generate quality and in-depth review content. This plays on the concept of gamification to encourage reviewers to continue by way of a live character content.

But you should also think about adjusting your review form to fully optimize the power of the Review Meter. By guiding customers through the submission process by asking for relatable tags before they reach the commentary box, you plant ideas in the reviewer’s head that they take with them to when they start to write in their own words.

This – in tandem with the Review Meter – will help you generate the more in-depth and detailed review content that drives sales.

If you’re a PowerReviews customer, you can activate the Review Meter today. If you’re not, request a demo to see it in action.

Andrew Smith

Andrew is an experienced ecommerce technology marketer. When he's not thinking about his day job, he's running around after two small children in Chicago's Lakeview neighborhood.

This is the fourth edition of our monthly snapshot (most recent versions here and here). This is our July version of the same report, analyzing consumer activity across more than 1.5MM online product pages from more than 1,200 retail/brand sites.

This time, we focused on a four-month period (starting February 24, 2020 and ending June 28, 2020). In each report, we specifically analyze review submission levels, review length and sentiment, overall conversions/sales volumes, and review consumption (both absolute and among those who go onto purchase).

We are seeing stabilization in most of the data we capture, as the market seemingly adapts to a new “normal”. But let’s dig deeper into the specifics of what this actually means.

Key ecommerce market trends

01

Both online order and traffic volumes flatten out to a (revised) “new normal”

02

Review submission levels fall slightly, but still significantly above pre-pandemic norms

03

Review content continues to be critical to converting browsers to buyers, with review consumption among those who purchase up on pre-pandemic levels.

Both online order and traffic volumes flatten out to a (revised) “new normal”?

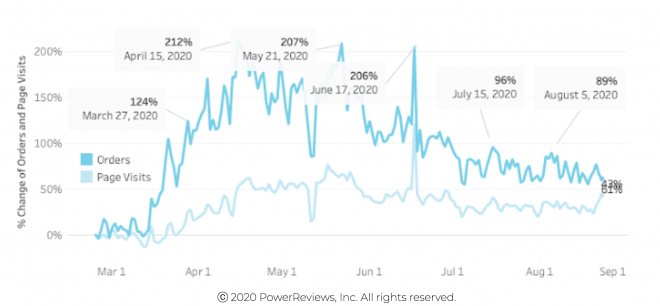
Over the past three months, we have reported aggressive growth in ecommerce purchase volumes since we started measuring at the back end of February. We speculated then that we had hit a potential “new normal” with highs of a 3x increase between that end of February date consistent across both April and May. We also pondered the impact of “Stay at Home” orders being lifted, as was the case in some states in June.

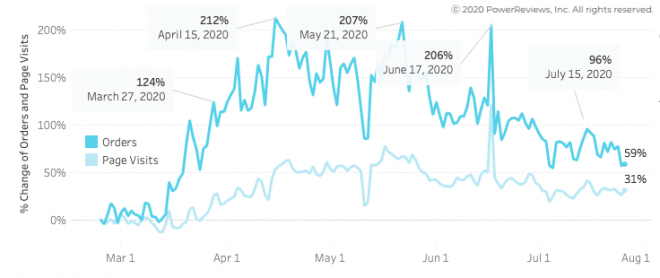
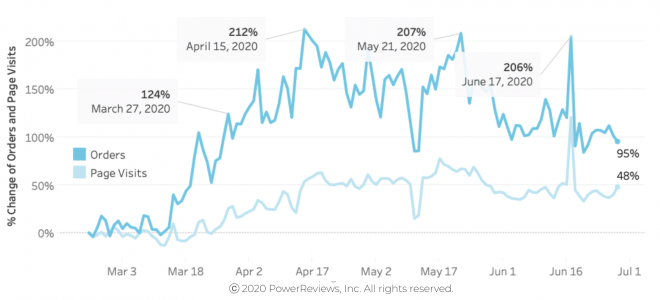
Throughout June, this certainly had an affect. We saw fluctuating demand during the month, with highs (of 206% above end of February levels) consistent with April and May. But, for the most part, we saw lower order volumes than we did in those two months. On our last date for capturing this data (June 28th), order volumes fell to around double (+95%) what they were pre-pandemic. They were approximately at this level throughout June, indicating that reopening was definitely having an impact. COVID-19 has clearly driven consumers online and so it’ll be very interesting to see if this sticks longer term.

Traffic has increased steadily over the past four months and hasn’t shown any sign of falling recently, which demonstrates a clear shift in consumer behavior. Customers are now far more comfortable shopping online but have become less decisive – perhaps due to broader economic uncertainty, job insecurity and associated pressures.

Both traffic and purchase volumes stabilize in June
A (revised) “new normal” in place across the board

Review submission levels fall slightly, but still significantly above pre-pandemic norms

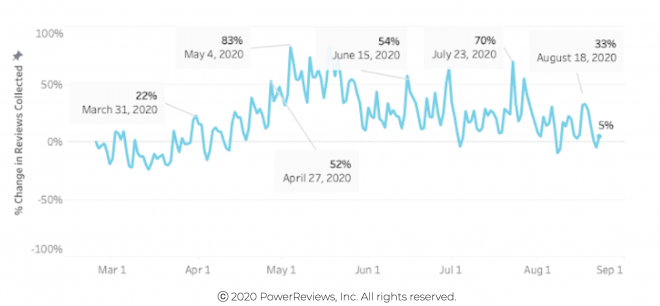
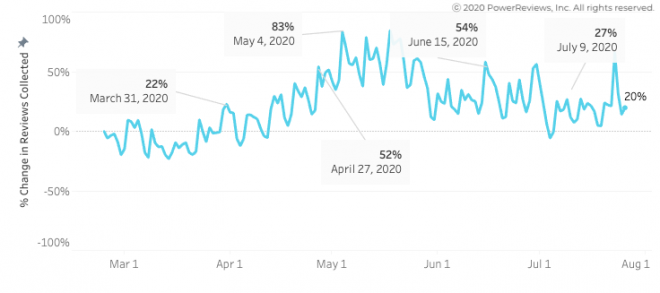
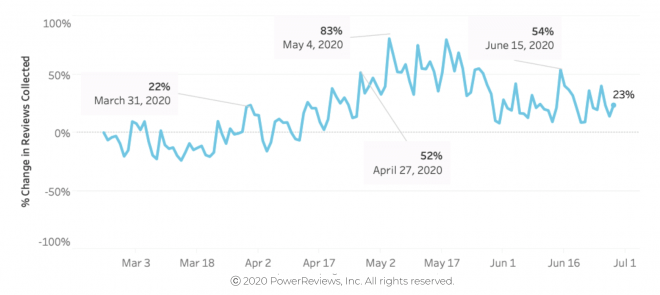
In last month’s snapshot, we reported a giant 2.3x leap in review submission levels from April to May. After this big increase, volumes dropped in June – peaking at 54% above pre-pandemic levels on June 15 (consistent with the high in April). This is to be expected to a certain extent given the drop off in purchase volumes reported above.

However, it’s important to note that review submission volumes are still way above what we saw pre-pandemic. This is despite an initial drop off throughout March, when review submission actually dropped right at the time “Stay at Home” orders kicked in.

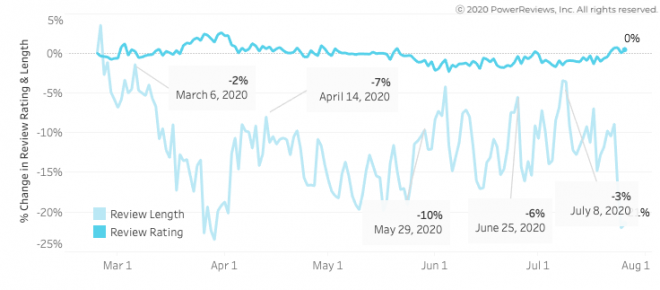
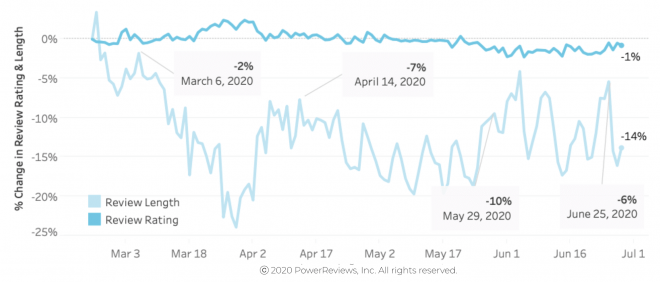
In terms of the actual content of reviews, there were not any huge shifts. Sentiment – in the form of average rating – remains flat, which makes sense given the products themselves are unlikely to have changed significantly in this period. Review length is down slightly on pre-pandemic levels but, given the average review length is 154 characters, a decrease of 10-20% is not particularly significant or meaningful. In last month’s webinar, we focused on review length in detail and offered some tips how to improve review quality. Check out our blog for a summary of that webinar.

Review submission volumes fall slightly in May but up on “normal”
Review length and ratings stable through June
Review length still down very slightly on pre-pandemic levels

Review content continues to be critical to driving purchase decisions

Review content continues to be more influential on the path to purchase than it was before the pandemic. The June high of our review interaction measure (the extent that consumers who convert engage with review content i.e. sorting, filtering, etc.) proved consistent with what we saw in May at 74% and 68% above pre-pandemic levels respectively. Overall review engagement is up around 1.5x on “normal” times. 

With that being said, this has dropped since February and March. There are most likely two reasons for this: 1. Purchase volumes have also fallen in this period and 2. The initial surge was likely due to consumers flooding online, buying products they previously had never bought before, and searching for validation before purchasing.

Bottom line: Shoppers are still heavily relying on review content to assess product quality and make purchase decisions.

Reviews continue to influence purchase at a higher rate than pre-pandemic
Consumers still relying on review content to make buying decisions
Review engagement stable at around 1.5x pre-pandemic
Consumer interactions with online reviews remains high

Summary

The re-opening of a number of states led to month-over-month decreases in most of the metrics we capture: purchase levels, review submissions, and review interaction volumes.

However, these are still way above comparative figures from when we started our research pre-pandemic at the end of February.

Specifically, purchase levels are double what they were pre-pandemic (purchase levels had tripled in May and April). Review interaction volumes have consistently increased, and are up between 50% to 65% during this time period. This is indicative of consumers seeking out greater social proof as they shop for products they are not as familiar with.

Review submission levels are also up from where they were pre-pandemic but have slightly fallen off lately. This is to be expected given the reduction in overall sales volumes.

Given the tightening of restrictions in many states that reopened earlier and the rapid change in consumer behavior more generally, we would expect increases across the board during July.

Introducing the Number 1 UGC-Dedicated Analytics Platform on the Planet

By now the value of User-Generated Content (or UGC for short) on website product pages is well known. Ratings, reviews and consumer imagery/video are all highly valued social proof points for shoppers as they progress through the customer journey on the path to purchase.

But despite the extensive positive impact the UGC they capture has on sales and traffic, and even the more qualitative benefits like shopper confidence, few brands and retailers analyze UGC on a deeper level. Either as insight to drive product portfolio improvements or enhance their customer experience.

Why?

They haven’t had access to an intelligence engine powerful enough to take all of the rich sentiment data (from the thousands of UGC they’ve collected across the web) and turn it into clear, actionable insights.

Well, we at PowerReviews can very confidently say: all that has changed now.

The High-Potential Analytics Power of UGC

UGC offers a ton of context-rich and actionable insight voluntarily provided by your customers. The sort of information organizations otherwise have to go to great lengths to capture through surveys or other methods. What makes UGC so powerful?

  1. You can easily map consumer feedback to specific products. Think about that for a second: most brands and retailers have extensive catalogs of hundreds or even thousands of products. Monitoring customer sentiment accurately across this sheer volume of items is literally impossible via any other methodology.
  2. Reviewers often provide demographic information (be this age, location, gender and – in some cases – use case). Being able to factor this insight in provides a highly valuable extra layer of context. No other type of customer feedback data captured digitally provides that level of specificity. With UGC, you can very precisely map product feedback and information about those who bought it to the actual product itself.
  3. Unlike other forms of customer feedback, UGC is almost always constructive and meaningful in its focus – whether it’s related to a specific product or your entire customer experience. Whether positive or negative, it typically includes extremely powerful, actionable and context-rich recommendations and suggestions for improvements.

UGC is a datasource with incredible potential but has up to now been completely underutilized. It’s time to unleash it.

What makes UGC Analytics a big deal?

We built UGC Analytics with input from today’s top brands and retailers. Over the past year, as we were building and improving upon this suite of analytics products, we asked for feedback from our customers — who also knew their review data was a goldmine of incredible insights just waiting to be discovered.

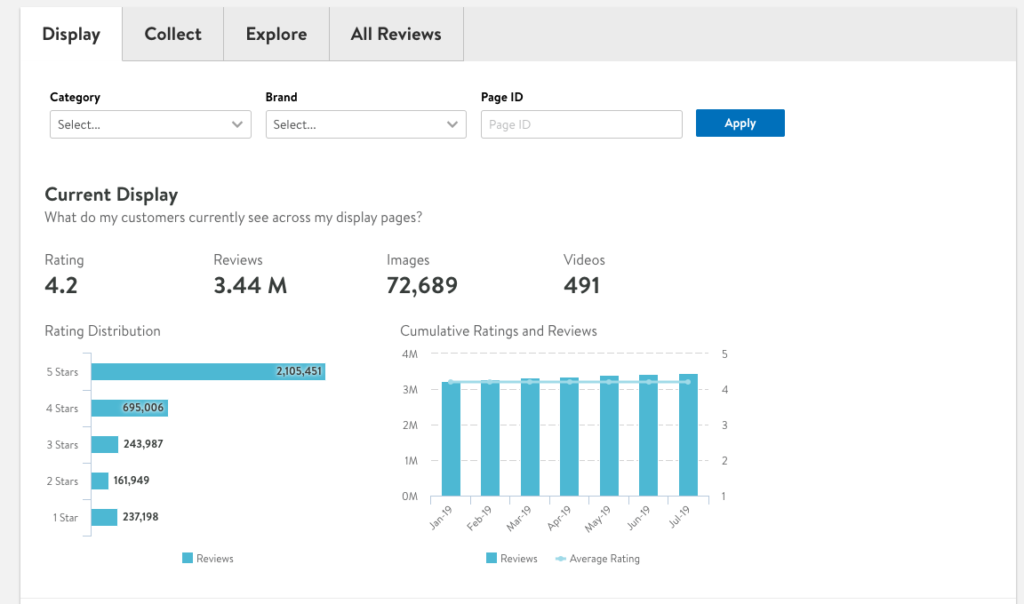
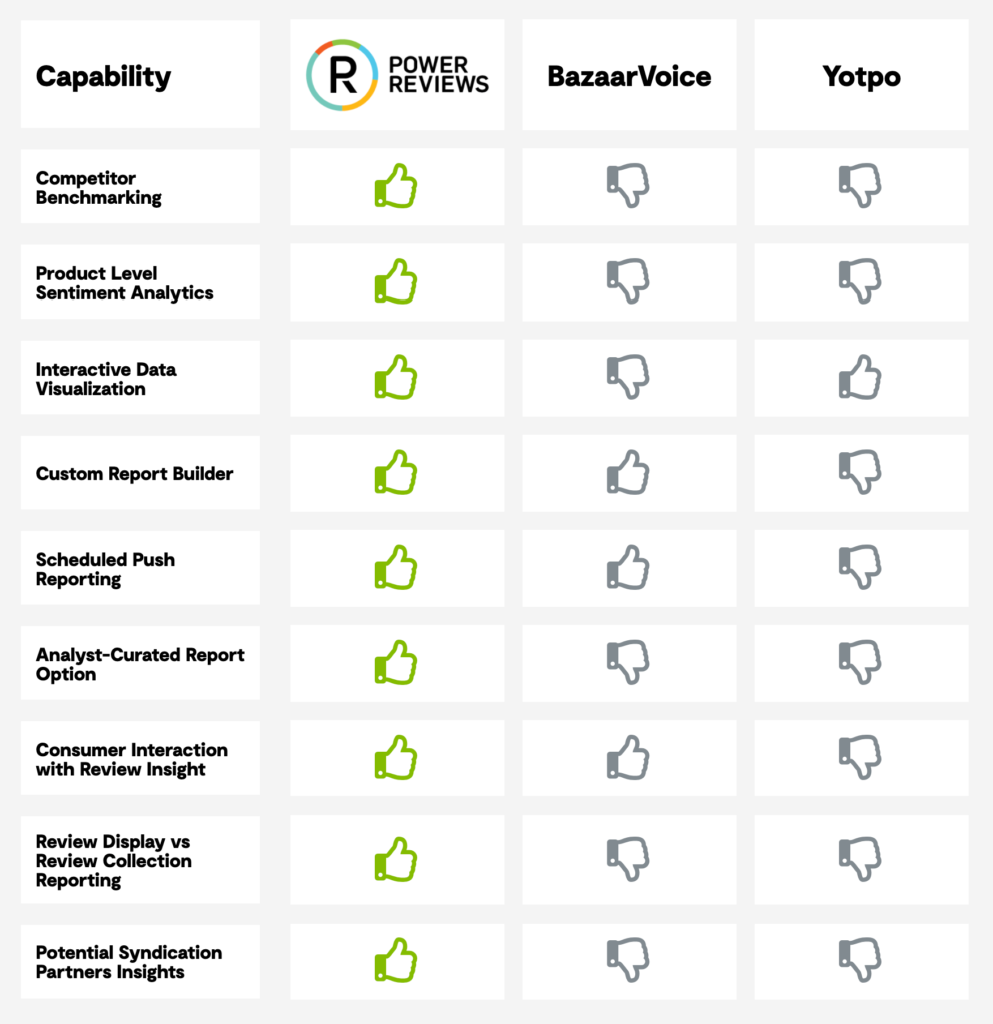
In fact, we did a thorough analysis of what other vendors in the space are able to offer. UGC Analytics is superior for a number of reasons. Check out our capability comparison chart for a deeper dive.

Here are a three things UGC Analytics does that no other UGC vendor does:

  • Benchmarking: Enables consumer sentiment comparison at the product, product category and brand level. Any product, any product category and any brand.
  • Product-Level Sentiment: Understand sentiment at the individual product level. Analysis of your entire product catalog in granular detail.
  • Potential Syndication Partners Insight: Provides exceptional guidance on who you should partner with to ensure you maximize the reach, value and impact of your UGC content.

Keep reading for more on that.

What does UGC Analytics allow you to do?

UGC Analytics is a reporting and text analytics suite powered by AI and Natural Language Processing that enables you to drive positive change across your business. These include:

Optimize your overall product catalog and drive individual product improvements

Brands and retailers typically have extensive product portfolios. Knowing exactly where and how to make adjustments – both to individual products and at a more holistic level – to drive meaningful business impact is a huge challenge.

More specifically: how do you know how each product resonates with shoppers? What exactly do they like about each of your products? What don’t they like? Is the information provided at point of sale both accurate and detailed enough to generate realistic expectations?

UGC Analytics enables you to mine all the insight-rich customer feedback captured via your UGC program for the most actionable and impactful improvement opportunities. Our pilot customers used it to build specific evidence for their merchants about modifications they needed to make, make adjustments to product descriptions on their site and considered dropping entire product lines.

Benchmark product and website performance against competitors

To become a market leader, you need to know what you’re up against. How exactly do you compare to your competition?

But most brands and retailers are unable to compare product and brand performance in the detail they need and with the precision required to make the desired impact.

This information – in the form of UGC – is all over the internet. It’s on your site, your competitors’ sites and a whole host of big box retailer and ecommerce marketplace sites. And trying to combine all of this data (which is usually structured differently depending on its source) gets overwhelming very quickly.

UGC Analytics enables you to analyze all this UGC data from your site, your competitor’s sites and any other third-party site this information exists on. It then enables you to compare consumer sentiment at the product, product category and brand level.

For example, say you make razors and Gillette is your main competitor. UGC Analytics enables you to see how your brand stacks up against the overall Gillette brand, as well as compare any of your models to any Gillette model. Extremely powerful stuff.

Understand, dissect and improve consumer path to purchase

As we mention above, User-Generated Content (ratings, reviews and visual media from customers) is proven to have a huge impact on the online shopping journey. Often, it’s the driving factor in converting browsers to buyers along the path to purchase.

But most are unable to size or even define this impact. They have no way of knowing the extent of consumer interactions with UGC content and the precise nature of it.

What type of UGC content results in better outcomes? Does consumer imagery or video make purchasing a product more likely? What about product Q&A content? How big an impact do different star ratings have on purchase decisions?

UGC Analytics enables you to answer all these questions and more. How? By capturing very precise insight about how consumers interact with this content, along with their subsequent actions (i.e. do they go on to purchase or not).

For example, across all our data, we have established that online shoppers that interact with some form of UGC are 103% more likely to convert. Q&A is the most impactful content (153% increase in conversion), followed by reviews (115% increase in conversion) and imagery (81% increase in conversion). UGC Analytics enables you to understand UGC’s tangible impact on your specific buyer journey.

Understand how your customers talk about your products so you can ensure your messaging and branding is on point

UGC Analytics analyzes every single piece of ratings and reviews content submitted about each of your products anywhere on the internet.

Due to its NLP-powered text analytics capabilities, it’s therefore able to take all this data and then surface very specific trends and insights to the forefront.

As a result, you can very quickly understand how your product and brand messaging is resonating with shoppers. Are there expectations of your products accurate? Or do your products end up disappointing more often than not? What exactly is it that doesn’t hit the mark?

UGC Analytics enables you to establish answers to all these questions and more. In doing so, it delivers highly actionable insights that drive informed and strategic improvements – whether for an individual product or on a broader basis.

How can you credibly say it’s “the best UGC-dedicated analytics platform on the planet”?

Put simply, because it is. We knew this was a huge gap in the UGC marketplace. As we talk about above, UGC is an incredible datasource that most brands and retailers are simply not leveraging as they could for maximum benefits. But there’s no other vendor in the space that is enabling them to fully realize this incredible potential.

UGC Analytics stacks up favorably to all other analytics platforms offered by our direct competitors. Here are the main reasons why:

Today is a proud day for us at PowerReviews. We are excited to offer brands and retailers the opportunity to maximize the huge potential impact of their UGC data to drive broad and meaningful business change.

For more information on UGC Analytics, check out the dedicated section on our website, or see it in action by requesting a demo.

Alison Krakowiak

In her role as Product Marketing Manager at PowerReviews, Alison leads new product launches by focusing on communicating the value of our technology to our clients and partners. Alison is excited to bring the voice of our PowerReviews clients into everything she creates.

As the COVID-19 pandemic has gripped the US, consumers shifted nearly all of their buying online. According to Adobe’s Digital Economy Index, U.S. ecommerce jumped 49% in April, compared to the baseline period in early March prior to shelter-in-place restrictions. 

User-generated content around ecommerce has also exploded. This includes consumer reviews, responses to those reviews by other consumers and brands, along with a marked increase in the posting of Questions and Answers and other content, to help inform consumers and support browser-to-purchaser conversion. 

Proactive management of the reviews process is an essential element of both ecommerce and – more broadly – brand reputation management. In today’s digital world, it only takes one consumer and one negative review to bring down a brand’s reputation and inject fear, uncertainty, and doubt in the collective digital consumer consciousness. 

In a recent webinar with my co-host Sri Rajagopalan, I had the opportunity to discuss the heightened need for proactive customer engagement with Jon Jessup, CEO of Reputation Studios. I have formulated a list of key takeaways and best practices for proactive reputation management. 

Brands’ Responses to Reviews are Nearly as Impactful as Consumer Reviews.

Many organizations understand the importance of landing great customer reviews to influence sales. But a best practice reviews management program necessitates monitoring and responding to reviews and the brand’s response can influence buyer behavior as well. 

In fact, a Consumer Review Survey conducted in December 2019 shows that 73% of consumers say they “always” or “regularly” read brands responses to reviews. And 71% said they are more likely to do business with brands that have responded to existing reviews. 

Customers Expect Timely Responses from Brands.

How long is too long to respond to a customer online? A timely response should come in a day, but theoretically a customer will accept a slower response if a review is posted over the weekend or on a holiday. There’s also a bit more leeway if a customer posts a 5-star review saying they loved the product. 

The response time window is dictated, in part, by the platform used for the review (i.e., Google reviews or Twitter). 

Additionally, the exact response time depends on the product, category and the type of review – positive or negative.

If a consumer has an adverse reaction to a product applied to the body or ingested, there are FDA requirements dictating the timeliness of the response and specific process to be followed. 

Negative Reviews Require More Urgency. 

There’s more urgency to respond to negative reviews 1) to satisfy the customer and 2) to protect the brand reputation.

Typically, a customer expects a response on a negative review in three to five business hours or less. But even this timeframe can be too long if a customer posts something negative on Twitter or via Facebook Messenger. 

If brands don’t respond to a negative review in a timely manner, the reviewer can become even more vocal, alerting other followers to the brand’s lack of response. However, brands that respond quickly and address a customer’s needs can reap rewards – as a detractor can become a strong brand advocate.

Q&A Forums Augment Product Details.

Q&A forums have become a common feature on most ecommerce sites. The Q&A section of a site can be exceptionally strategic in helping to fill the gaps in customer product knowledge. 

However, the content must be accurate, and this requires monitoring. A consumer who thinks he or she knows the answer may offer an answer, but the details may be wrong. The brand can – and should – comment on another person’s answer, and especially so if it is incorrect. 

In this respect, it’s vital to give this responsibility to individuals who actually know the right answers and who are well-versed in customer and consumer engagement. 

The need for timely response applies for Q&As as well. If a question posed remains unanswered, customers can question the brand’s lack of a response. 

According to one research study, 82% of consumers look for an immediate response from brands on marketing or sales questions. This near immediate need for response was deemed “important” or “very important.” And overall, nearly two-thirds of buyers expect a response within 10 minutes to any marketing, sales, or customer service inquiry.

Staying abreast of Q&A content can also help brands understand the customer experience and opportunities for improvement. 

Embrace automation. But not too much.

Automation can help brands manage an influx of customer reviews. But authenticity is key. So the role of technology should be to assist humans so they can respond to the customer quickly and efficiently. For example, populating reference and phone number information for reviews. 

The first step is to consolidate everything from all channels into a single response platform. You can then provide automated responses for the simplest reviews. More complex issues can be filtered and routed to the right people internally for response.

If, for example, a customer leaves a 1-star or 5-star review on Google, but with no explanation, an automated response asking for further details is acceptable. 

Similarly, if a customer leaves a 1-star or 5-star review of a product citing a particular feature, automation can filter those responses based on context and sentiment intent. They can then be forwarded to the right customer care agent to formulate a response in the brand’s “voice.” Rating-specific and channel-specific response templates can help customer care agents answer customers quickly and efficiently.

Having the Right Data and Analytics to Uncover Insights Pays Big Dividends

Brands typically capture a ton of data about their customers. But few leverage UGC insight in the same way they do survey or CRM data. The truth is it represents fantastic information to drive key product and organizational improvement.

How can companies use the data to make their products better? How can they use the data to better target customers?

Even analysis of your UGC program can have big impact. Which products need more reviews? How does interaction with your UGC drive purchase activity? And beyond that, you can analyze response volume and quality to ensure your reputation management processes are as effective as possible.

Liberate Customer Sentiment to Inform Your Business.

The best way to gain 5-star reviews is to have a 5-star product. The next best thing is to listen and respond to customer feedback to create a 5-star product and/or a 5-star experience. Too often, customer engagement is siloed and the Voice of the Customer isn’t flowed throughout the organization. This is a mistake, as insights from reviews can be invaluable in informing and guiding business improvements from product development to customer service to site content. 

Brands should collaborate often to review feedback from customer reviews to respond to trends. Some brands discuss customer sentiment monthly, which isn’t nearly enough. Consider meeting a few times a week to enable a more proactive means to understand and respond to any shifts in consumer sentiment and proactively manage the customer experience and brand reputation.

Peter Bond

Peter V.S. Bond is Vice President Of CPG Commercialization, focused on enabling commercial success within the Consumer Packaged Goods/Retail vertical. His experience also includes working with large enterprise CPG and Retail clients Kroger, Coca-Cola, PepsiCo, Campbell Soup and others. He is a voice of the customer and CRM evangelist.